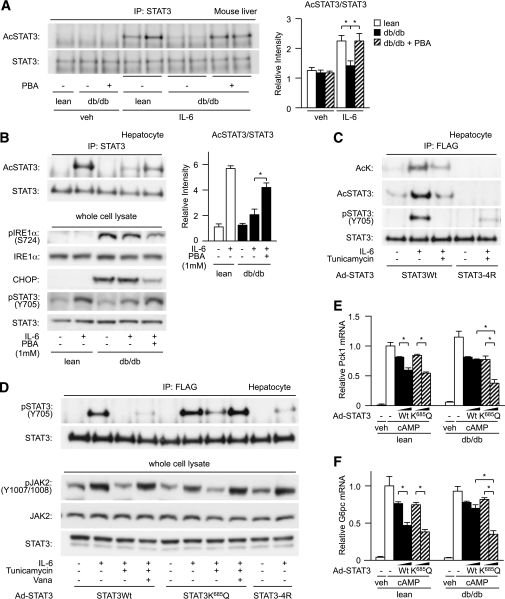
FIG. 5.
Acetylated mutant of STAT3 is less susceptible to ER stress–induced suppression of STAT3 activation. A: Control mice (lean), db/db mice (db), and PBA-treated db/db mice were subjected to continuous IL-6 administration in the presence of somatostatin, and the level of acetylation of hepatic STAT3 was determined by Western blotting (left). Quantitation of STAT3 acetylation levels is normalized to immunoprecipitated STAT3 and is represented as mean ± SE (right). *P < 0.05 (n = 6 in each group); open bar, lean mice; closed bar, db/db mice; striped bar, PBA-treated db/db mice. B: db/db mouse–derived isolated hepatocytes were pretreated with PBA and analyzed for the level of IL-6–stimulated acetylation of STAT3 (left). Quantitation of STAT3 acetylation levels is normalized to immunoprecipitated STAT3 and is represented as mean ± SE (right). Open bar, lean hepatocyte; closed bar, db/db hepatocytes. C: Lean mouse–derived isolated hepatocytes were forced to express wild-type STAT3 or 4R mutant via adenovirus vector, treated with tunicamycin, and analyzed for the level of IL-6–dependent acetylation and tyrosine phosphorylation of exogenously induced STAT3. Cell extracts were immunoprecipitated with anti-FLAG antibody and analyzed by anti–acetyl-lysine (AcK), acetyl-STAT3, phospho-STAT3, and total STAT3 antibody. D: Lean mouse–derived hepatocytes were forced to express wild-type STAT3 or K685Q mutant via infection with an adenovirus vector, treated with tunicamycin and orthovanadate (Vana) for 6 h, and analyzed for the level of IL-6–dependent tyrosine phosphorylation of exogenously induced STAT3. The top row shows the levels of STAT3 tyrosine phosphorylation from an immunoprecipitate with anti-FLAG antibody. The bottom row shows the levels of JAK2 phosphorylation from whole cell lysate. E and F: Lean mouse–derived hepatocytes or db/db mouse–derived isolated hepatocytes were forced to express wild-type STAT3 or K685Q mutant via infection with an adenovirus vector at multiplicity of infection values 3 and 10 and analyzed for their suppressive effect on expressions of Pck1 (E) and G6pc (F) by quantitative RT-PCR. Data are represented as mean ± SE. *P < 0.05 (n = 4 in each group); open bar, β-galactosidase overexpression (control); closed bar, wild-type STAT3; striped bar, K685Q-infected mutant.

