FIG. 3.
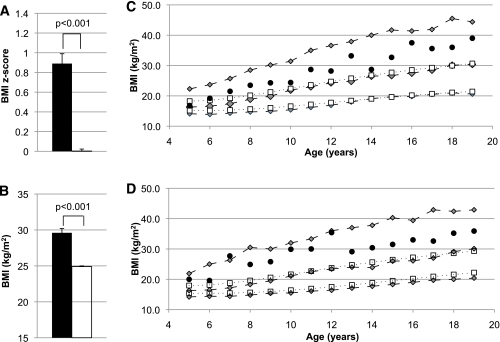
A: Pima population–specific BMI z scores in children (age 5–20 years) with (■) and without (□) partial loss-of-function MC4R mutations after adjustment for birth year, sibling relationships, and degree of Pima heritage. B: Mean BMIs of children with (■) and without (□) loss-of-function MC4R mutations. BMI analysis included age, sex, sibling relationships, degree of Pima heritage, and birth year as covariates. C: The BMI growth chart for girls shows that average BMI for individuals with MC4R deficiency (●) was consistently greater than the 50th percentile for the Pima population (gray diamonds, dashed lines) and greater than the 95th percentile for the U.S. population (white boxes, dotted lines) at every age. D: Corresponding boys’ growth chart for BMI. Gray diamonds, dashed lines = 95th, 50th, and 5th percentile for the Pima population; white boxes, dotted lines = 95th and 50th percentile for the U.S. population. (A high-quality color representation of this figure is available in the online issue.)

