

Abstract
This study examined whether individual differences in aerobic fitness are associated with differences in activation of cognitive control brain networks in preadolescent children. As expected, children performed worse on a measure of cognitive control compared to a group of young adults. However, individual differences in aerobic fitness were associated with cognitive control performance among children. Lower-fit children had disproportionate performance cost in accuracy with increasing task difficulty, relative to higher-fit children. Brain activation was compared between performance-matched groups of lower- and higher-fit children. Fitness groups differed in brain activity for regions associated with response execution and inhibition, task set maintenance, and top-down regulation. Overall, differing activation patterns coupled with different patterns of brain-behavior correlations suggest an important role of aerobic fitness in modulating task strategy and the efficiency of neural networks that implement cognitive control in preadolescent children.
Keywords: exercise, physical activity, aerobic fitness, executive control, fMRI, development
In addition to increasing risk for developing chronic cardiovascular and metabolic diseases, research has shown that poor physical fitness during childhood puts children at risk for lower cognitive performance (Pontifex et al., 2011) and poorer academic achievement (Castelli et al., 2007, Chomitz et al., 2009). To date functional neuroimaging evidence that can help us understand these trends has come primarily from event-related brain potential (ERP) studies of the attentional and executive control systems (Hillman et al., 2005, 2009; Pontifex et al., 2011). The goal of the current study is to extend this research by using functional magnetic resonance imaging (fMRI) to characterize how fitness level relates to patterns of brain activity during cognitive challenge in preadolescent children.
Research that has examined neuroelectric indices of brain function in lower-fit (LF) and higher-fit (HF) preadolescent children has done so in the context of cognitive control theory using modified Eriksen flanker tasks (Hillman et al., 2009, Pontifex et al., 2011), a standard test of conflict resolution (Eriksen and Eriksen, 1974). Successfully inhibiting information that conflicts with an attended target is a subcomponent of executive function, and is associated with activation of a variety of prefrontal regions such as the dorsolateral and anterior prefrontal cortices and the dorsal anterior cingulate cortex (Botvinick et al., 1999, Casey et al., 2000b, Hazeltine et al., 2000). These regions are part of a larger collection of brain regions involved in cognitive control, a term that describes our ability to flexibly adapt behavior to environmental needs, maintain goals for behavior across sustained periods of time, and monitor for errors to adjust control engagement (Botvinick et al., 2001, Braver and Barch, 2006). In this framework, the dorsolateral prefrontal cortex is hypothesized to initiate flexible adjustments in control, whereas the anterior prefrontal cortex maintains context-driven task goals over prolonged periods of time, and the anterior cingulate cortex evaluates and monitors for conflict and errors that signal need to adjust control (Dosenbach et al., 2007, though see Forster and Brown, 2011). The prefrontal cortex is the last association area to fully develop in children, and this extended period of brain plasticity likely contributes to the protracted development of cognitive control processes and integration of their associated brain systems (Casey et al., 2000a, Bunge et al., 2002, Fair et al., 2007).
In the adult brain, the anterior prefrontal cortex and the dorsal anterior cingulate are two regions in a brain network called the cingulo-opercular network, which is involved in prolonged maintenance of task context (Dosenbach et al., 2007). Other brain regions in the network include the anterior insula extending into the central and frontal operculum and the thalamus. A recent study mapping functional cortico-striatal connections also suggests that the putamen is part of the network (Barnes et al., 2010). The cingulo-opercular network is proposed to work together with the fronto-parietal network, which includes the dorsolateral prefrontal cortex and which complements the sustained nature of the cingulo-opercular network with rapid online adjustments of cognitive control (Dosenbach et al., 2007, Dosenbach et al., 2008). Core regions in the fronto-parietal network also include the inferior parietal cortex and the dorsal precuneus.
With the protracted development of the prefrontal cortex, it should come as no surprise that these two cognitive control networks are not fully integrated, distinct networks in pre-adolescence. During childhood the anterior prefrontal cortex and dorsal anterior cingulate are more functionally connected to the fronto-parietal system, but through development to adulthood they become more integrated with the emerging cingulo-opercular system (Fair et al., 2007). Thus, the dual architecture of the cognitive control system develops from one that is optimal for rapid, reactive and adaptive control, to one that can flexibly balance rapid and sustained, goal-oriented control. Moreover, given that these neural networks are in a stage of heightened plasticity during preadolescent development, increased physical fitness during this critical time may serve as an important component to ensure their proper development.
Indeed, ERP research has suggested that this is the case. For example, LF children tend to show decreased P3 amplitude for target processing (Hillman et al., 2009, Pontifex et al., 2011), suggesting that poor physical fitness is associated with poorer attentional allocation processes. These studies have also found that LF children show a greater error-related negativity (ERN), an ERP component thought to index conflict monitoring and error evaluation. LF children were also less accurate in trials following errors of commission. Given that increased ERN amplitude is thought to reflect inefficient conflict monitoring coupled with deficient prefrontally-regulated cognitive control (Gehring and Knight, 2000), these studies suggest that LF children monitor conflict inefficiently through ineffective cingulate and prefrontal interaction during cognitive control. Or, from a brain systems approach, they suggest LF children have less effective interaction between the prefrontal and anterior cingulate components of the fronto-parietal and cingulo-opercular networks. This would also be consistent with research demonstrating that sedentary older adults who completed six months of aerobic training had decreased anterior cingulate activation compared to a non-aerobic control group, coupled with increased right lateral prefrontal activation and better conflict resolution (Colcombe et al., 2004).
The current study tested several of these suggested hypotheses using fMRI with LF and HF preadolescent children. Participants performed a modified Eriksen flanker task during functional imaging. To confirm that the task measured aspects of cognitive control sensitive to development, children were compared to young adult controls on task performance. Although the young adult group had fitness levels somewhere in between those of the LF and HF child groups, young adults have been shown to perform better on the flanker paradigm than children, and we were specifically interested to see if children with higher aerobic fitness levels parallel young adult performance. Next, brain activation related to cognitive control processes for LF and HF children were compared. We hypothesized that fitness would affect activation patterns in the prefrontal cortices, including important areas associated with cognitive control such as the dorsolateral and anterior prefrontal cortices and the anterior cingulate cortex, coupled with poorer performance for LF compared to HF children. Furthermore, if aerobic fitness is associated with more successful integration of the anterior prefrontal cortex and anterior cingulate into the cingulo-opercular network, we expect HF children to more effectively recruit this network to implement cognitive control.
2. Experimental Procedures
2.1. Participants
Participants were recruited from the east-central Illinois region. Eligible participants had to (1) demonstrate strong right handedness, with 75% or above on the Edinburgh Handedness Inventory (Oldfield, 1971), (2) be between the ages of 9 and 10 for children and between 18 and 30 years for young adults, (3) be free of neurological disease, attentional disorders, or physical disabilities, (4) have normal color-vision, (5) have a corrected visual acuity of at least 20/20, and (6) sign an informed assent/consent. For all children, participants provided written assent and their legal guardians provided written informed consent in accordance with the Institutional Review Board of the University of Illinois at Urbana-Champaign. Children, in collaboration with their legal guardian, completed the Tanner Staging Scales (Taylor et al., 2001), indicating that their pubertal status was at or below a score of 2 (i.e., prepubescent) on a 5-point scale. All participants were administered the Kaufman Brief Intelligence Test (KBIT; Kaufman and Kaufman, 1990) by a trained experimenter to assess intelligence quotient. Demographic, KBIT and fitness data for all participants is provided in Table 1.
Table 1a.
Mean (SD) Values for demographic, KBIT and fitness data.
| Children | p-value (2-tailed) | ||||
|---|---|---|---|---|---|
| Variable | Young Adults (YA) |
Lower-Fit (LF) |
Higher-Fit (HF) |
Young- Children |
LF-HF Children |
| N | 26 | 18 | 18 | -- | -- |
| Age | 21.7 (2.1) | 9.9 (.6) | 9.8 (.6) | <.001 | NS |
| N Male (%) | 9 (34.6%) | 7 (38.9%) | 10 (55.6%) | NS | NS |
| Tanner | -- | 1.7 (.5) | 1.6 (.5) | -- | NS |
| K-BIT composite | 108.1 (6.9) | 113.6 (15.0) | 116.8 (6.3) | .008 | NS |
| VO2max (ml/kg/min) | 40.5 (6.2) | 36.9 (4.5) | 52.8 (5.2) | .05 | <.001 |
| VO2max Percentile | 40.25 (24.7) | 14.9 (17.7) | 83.67 (5.3) | NS | <.001 |
2.2. Cardiorespiratory fitness assessment
In addition to the above criteria for children, participants were bifurcated by aerobic fitness into HF or LF groups based on whether their cardiorespiratory fitness level (i.e., VO2max) fell above the 70th percentile or below the 30th percentile according to normative data provided by Shvartz and Reibold (1990). Maximal oxygen consumption (VO2max) was measured using a computerized indirect calorimetry system (ParvoMedics True Max 2400) with averages for oxygen uptake (VO2) and respiratory exchange ratio (RER) assessed every 20 seconds. A modified Balke protocol (Whaley et al., 2006) was employed using a motor-driven treadmill at a constant speed with increases in grade increments of 2.5% every two minutes until volitional exhaustion occurred. A Polar heart rate monitor (Polar WearLink®+ 31, Polar Electro, Finland) was used to measure HR throughout the test and ratings of perceived exertion (RPE) were collected every two minutes using the children’s OMNI scale (Utter et al., 2002). Relative peak oxygen consumption was expressed in ml/kg/min and based upon maximal effort as evidenced by (1) a plateau in oxygen consumption corresponding to an increase of less than 2 ml/kg/min despite an increase in workload, (2) a peak heart rate > 185 bpm (Whaley et al., 2006) or a heart rate plateau (Freedson and Goodman, 1993), (3) RER > 1.0 (Bar-Or, 1983), and/or (4) ratings on the children’s OMNI scale of perceived exertion > 8 (Utter et al., 2002).
2.3. Imaging procedures and processing
Following cardiorespiratory fitness assessment, all participants completed a mock MRI session, wherein they were screened for their ability to complete an experiment in an MRI environment. Participants who passed the mock screening subsequently completed a series of structural and functional MRI scans.
2.3.1. Structural MRI
High resolution T1-weighted brain images were acquired using a 3D MPRAGE (Magnetization Prepared Rapid Gradient Echo Imaging) protocol with 144 contiguous axial slices, collected in ascending fashion parallel to the anterior and posterior commissures, echo time (TE)=3.87 ms, repetition time (TR)=1800 ms, field of view (FOV)=256 mm, acquisition matrix 192 mm × 192 mm, slice thickness=1.3mm, and flip angle=8°. All images were collected on a 3T head-only Siemens Allegra MRI scanner.
2.3.2. Functional MRI
During fMRI scanning participants performed a version of a flanker paradigm in which they were presented with a horizontal array of five fish that faced either right (>) or left (<). Participants were asked to identify the orientation of the central fish, while ignoring the orientation of the peripheral fish (see Figure 1). The stimuli were presented for 1s on each trial followed by a fixed inter-stimulus interval (ISI) of 1s. In the magnet, before scanning began for the task, all participants completed 12 practice trials with feedback. This number of practice trials was sufficient for children to understand the task, as very few participants needed to repeat the practice trials due to misunderstanding or non-response. Practice trials presented all trial types in a random order, but otherwise resembled the event timing of real trials. Task trials during scanning were presented in a blocked design such that there were three blocks of congruent fish and three blocks of incongruent fish trials interleaved with 30s blocks of fixation baseline. In each congruent (Con) and incongruent (Inc) block there were 12 congruent and incongruent trials, respectively, and six neutral (e.g. - - < - -) trials randomly interspersed, for a total of 36 trials for each of Con, Inc, and neutral conditions. The presence of neutral trials ensured that subjects retained a strategy of focusing on the central target while trying to ignore peripheral distractors. Given the block design, activation specific to neutral trials could not be modeled separately. Since there were equal numbers of neutral trials per block, their effect on task-related activation would presumably cancel out. For this reason, only the Con and Inc conditions are presented for behavioral and neuroimaging results. Functional imaging parameters were: TR = 2000 ms, TE = 25 ms, flip angle = 80°, BOLD reps=230 volumes; the order of blocks for all participants was Con, Inc, Inc, Con, Inc, Con.
Figure 1.
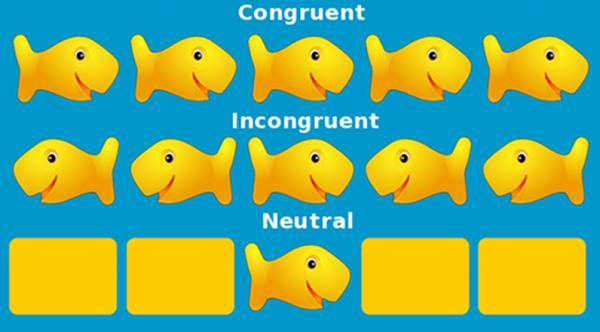
Example task stimuli for a response indicating central target stimulus is pointing to the right.
Functional MRI preprocessing was carried out using FSL 4.1.2 (FMRIB’s Software Library, www.fmrib.ox.ac.uk/fsl). The following pre-statistics processing were applied: rigid body motion correction using MCFLIRT (Jenkinson et al., 2002), removal of non-brain structures using BET (Smith, 2002), spatial smoothing using a Gaussian kernel of FWHM 6.0-mm, grand-mean intensity normalization of the entire 4D dataset by a single multiplicative factor, and temporal filtering with a high pass frequency cut-off of 220 seconds. Regression-based analysis of fMRI data was carried out using FSL’s FEAT Version 5.98. For individual-level analyses, the hemodynamic response to each block was convolved with a double-gamma HRF function. Of primary interest to this study was the contrast of Inc>Con. This contrast was computed for each subject at the individual level and carried forward to a mixed-effects group analysis. Higher-level mixed-effects analyses were carried out using FLAME (Beckmann et al., 2003). For all GLM activation analyses the statistical threshold for significant activation was set to Z>2.33 voxel, p<.05 cluster-correction.
Whole-brain analyses were followed by region-of-interest (ROI) analysis of fMRI activation. When statistically significant clusters of activation from contrasts of interest extended into multiple neuroanatomical regions, fMRI clusters were masked with the Harvard-Oxford cortical and subcortical structural atlases packaged with the FSL software. Separable brain regions in fMRI activation maps were defined as the conjunction of voxels that had a greater than 25% probability of representing a labeled atlas region and statistically significant fMRI activation on the whole-brain group statistical map.
3. Results
3.1. Task Performance
A repeated measures ANOVA was conducted to examine group differences in behavioral performance, with Condition (Con, Inc) as the within-subjects factor and Group (LF, HF, YA) as the between-subjects factor. Sex was entered as a covariate for all analyses. For reaction time (RT), there was a significant effect of Condition, F(1,56)=70.24, p<.001, a significant effect of Group, F(2,56)=59.35, p<.001, and a non-significant Group × Condition interaction (p>.05). These effects reflected that RT was consistently longer for the Inc condition, and the young adults had shorter RT than children. Based on a priori hypotheses concerning fitness effects on cognition, the two groups of children were compared with an ANOVA. This analysis demonstrated that there was a significant effect of Condition, F(1,33)=43.18, p<.001, and non-significant effects of Group and Group × Condition interaction (p>.05). Thus, regardless of group assignment, children responded slower on Inc trials compared to Con trials, see Figure 2A.
Figure 2.

(A) Main effect of Condition for reaction time, (B) LF children showed greater cost specifically for the incongruent condition, *p<.05 as tested by independent samples t-test, (C) Accuracy percent cost, *p<.05, NS=p<.05, as tested by Mann-Whitney non-parametric test.
For accuracy, there was a significant effect of Condition, F(1,56)=4.23, p<.05, a significant effect of Group, F(2,56)=12.42, p<.001, and a significant Group × Condition interaction, F(2,56)=6.15, p<.01. These effects reflected that participants were less accurate on the Inc compared to the Con condition, that young adults were more accurate than children and that accuracy differences occurred with a preferential decrement in the Inc condition (see Figure 2B). A priori analyses aimed at fitness differences in the child groups yielded a significant effect of Condition, F(1,33)=5.32, p<.05, a significant effect of Group, F(1,33)=5.41, p<.05, and a marginal Group × Condition interaction, F(1,33)=3.00, p=.09. These effects reflected that children were less accurate overall on the Inc compared to the Con condition, that LF children were less accurate than HF children, and that this difference tended to be stronger for the Inc condition, see Figure 2B. For example, based on separate independent-samples t-tests for the Con and Inc condition, LF children were less accurate than HF for the Inc (t(34)=2.60, p<.05), but not the Con (t(34)=2.07, p>.05) condition (see Figure 2B). Further, when interference cost was computed ((Con Accuracy – Inc Accuracy)/Inc Accuracy), a Mann-Whitney non-parametric test (percent accuracy cost was not normally distributed) showed that LF children had greater cost than HF children (U=95.5, z=−2.11, p<.05, r=−.35), see Figure 2C. Sex was non-significant in each of the above ANOVAs, therefore it was not a likely confound in the non-parametric group comparison.
3.2. fMRI activation
Behavioral performance results thus indicate that the flanker task captures a cognitive ability that is poorer in children compared to young adults, but which is also sensitive to aerobic fitness differences in children such that HF children outperform LF children and do not differ in accuracy from young adults. Thus, to further understand how aerobic fitness moderates brain function in children, fMRI analysis focused on examining differences in task-related brain activation between LF and HF children. However, before we infer group differences in activation based solely on individual differences in fitness, we must address the confound of group differences in behavioral performance (Church et al., 2010). Therefore LF and HF groups matched on group-level performance in percent accuracy cost were used for all fMRI analyses (see Table 1b). Sex was also used as a covariate in fMRI analyses.
Table 1b.
Mean (SD) Values for demographic, KBIT and fitness data for young adults and performance-matched children groups.
| Children (perf matched) | p-value (2-tailed) | ||||
|---|---|---|---|---|---|
| Variable | Young Adults (YA) |
Lower-Fit (LF) |
Higher-Fit (HF) |
Young- Children |
LF-HF Children |
| N | 26 | 14 | 14 | -- | -- |
| Age | 21.7 (2.1) | 9.9 (.5) | 9.8 (.6) | <.001 | NS |
| N Male (%) | 9 (34.6%) | 5 (35.7%) | 8 (57.1%) | NS | NS |
| Tanner | -- | 1.6 (.5) | 1.6 (.5) | -- | NS |
| K-BIT composite | 108.1 (6.9) | 118.4 (13.1) | 117.9 (6.6) | <.001 | NS |
| VO2max (ml/kg/min) |
40.5 (6.2) | 37.0 (4.1) | 53.6 (5.6) | .05 | <.001 |
| VO2max Percentile | 40.25 (24.7) | 16.7 (19.5) | 83.9 (5.6) | NS | <.001 |
Significant brain activation clusters for both groups for all task contrasts are listed in Table 2. For the current study we focus on group comparisons of the Inc and Con condition, as this contrast best targets cognitive control processes associated with development and fitness. For the Inc>Con fMRI comparison, results indicated that LF children activated brain regions associated with attentional control and inhibition to a greater extent than HF children. Significant brain activation clusters for this Group × Condition interaction are listed in Tables 2c and 2d, and included three extended areas of activation.
Table 2a.
Summary of group differences in fMRI activation for LF and HF groups matched on behavioral performance for (a) LF children, (b) HF children, (c) LF > HF children, and (d) HF > LF children. Task activation foci for lower-fit children
| Cluster Anatomical Description Lower-fit Children Task Contrast |
MNI coordinates (x,y,z) |
Z Score | Voxels | p-value |
|---|---|---|---|---|
| Congruent > Baseline | ||||
| L occipital pole, extending into L lateral inferior occipital cortex |
−22, −98, −10 | 6.18 | 1859 | 7.38 × 10⁻⁵ |
| R occipital pole, extending into R lateral occipital cortex, R lateral inferior occipital cortex, R occipital fusiform gyrus |
22, −94, −10 | 5.98 | 1626 | 2.31 × 10⁻⁴ |
| Incongruent > Baseline | ||||
| L occipital pole, extending into R occipital pole |
−12, −102, −6 | 5.83 | 5838 | 1.58 × 10⁻¹¹ |
| L thalamus, extending into L caudate | −14, −16, 14 | 4.12 | 3442 | 5.96 × 10⁻⁸ |
| L frontal pole | −38, 44, 2 | 3.66 | 1035 | .005 |
| L supplementary motor area, extending into L dorsal anterior cingulate cortex |
−2, −6, 68 | 4.12 | 909 | .01 |
| Congruent > Incongruent | ||||
| None | ||||
| Incongruent > Congruent | ||||
| L thalamus, extending into L inferior pre- central gyrus, L putamen, L caudate |
−8, −8, 10 | 3.66 | 2607 | 2.38 × 10⁻⁷ |
| L middle frontal gyrus, extending into L frontal pole, L inferior frontal gyrus |
−28, 30, 30 | 3.72 | 1046 | .002 |
| R anterior superior temporal gyrus, extending into R central opercular cortex, R inferior pre-central gyrus, R inferior frontal gyrus |
60, 2, 2 | 3.50 | 595 | .04 |
Caption: Statistical parametric map threshold set at Z>2.33 voxel, p<.05 cluster-correction; R=Right, L=Left brain hemisphere, MNI coordinates are for statistical peaks in cluster and Z Score is for corresponding coordinate location; Voxels refer to the number of standard space voxels in the cluster; p-value is the p-value significance for the cluster.
Table 2c.
Summary of group differences in fMRI activation for LF and HF groups matched on behavioral performance for (a) LF children, (b) HF children, (c) LF > HF children, and (d) HF > LF children. Task activation foci for LF > HF
| Cluster Anatomical Description Lower-fit > Higher-Fit Children Task Contrast |
MNI coordinates (x,y,z) |
Z Score | Voxels | p-value |
|---|---|---|---|---|
| Congruent > Baseline | ||||
| None | ||||
| Incongruent > Baseline | ||||
| None | ||||
| Congruent > Incongruent | ||||
| None | ||||
| Incongruent > Congruent | ||||
| L post-central gyrus, extending into L pre-central gyrus, L supplementary motor area, R post-central gyrus, R pre-central gyrus, R dorsal anterior cingulate gyrus, L superior parietal lobule |
−24, −32, 62 | 3.64 | 4895 | 1.18 × 10⁻¹¹ |
| L insular cortex, extending into L central operculum, L temporal pole, L anterior superior temporal gyrus, L putamen, L thalamus |
−38, −2, −6 | 3.37 | 1406 | 1.71 × 10⁻⁴ |
| L middle frontal gyrus, extending into L frontal pole |
−32, 30, 32 | 3.39 | 605 | .04 |
Caption: Statistical parametric map threshold set at Z>2.33 voxel, p<.05 cluster-correction; R=Right, L=Left brain hemisphere, MNI coordinates are for statistical peaks in cluster and Z Score is for corresponding coordinate location; Voxels refer to the number of standard space voxels in the cluster; p-value is the p-value significance for the cluster.
Table 2d.
Summary of group differences in fMRI activation for LF and HF groups matched on behavioral performance for (a) LF children, (b) HF children, (c) LF > HF children, and (d) HF > LF children. Task activation foci for HF > LF children
| Cluster Anatomical Description Higher-fit > Lower-Fit Children Task Contrast |
MNI coordinates (x,y,z) |
Z Score | Voxels | p-value |
|---|---|---|---|---|
| Congruent > Baseline | ||||
| None | ||||
| Incongruent > Baseline | ||||
| None | ||||
| Congruent > Incongruent | ||||
| L post-central gyrus, extending into L pre-central gyrus, L supplementary motor area, R post-central gyrus, R pre-central gyrus, R dorsal anterior cingulate gyrus, L superior parietal lobule |
−24, −32, 62 | 3.64 | 4895 | 1.18 × 10⁻¹¹ |
| L insular cortex, extending into L central operculum, L temporal pole, L anterior superior temporal gyrus, L putamen, L thalamus |
−38, −2, −6 | 3.37 | 1406 | 1.71 × 10⁻⁴ |
| L middle frontal gyrus, extending into L frontal pole |
−32, 30, 32 | 3.39 | 605 | .04 |
| Incongruent > Congruent | ||||
| None |
Caption: Statistical parametric map threshold set at Z>2.33 voxel, p<.05 cluster-correction; R=Right, L=Left brain hemisphere, MNI coordinates are for statistical peaks in cluster and Z Score is for corresponding coordinate location; Voxels refer to the number of standard space voxels in the cluster; p-value is the p-value significance for the cluster.
The first cluster included areas of the left and right pre- and post-central gyri, supplementary motor area, dorsal anterior cingulate gyrus, and left superior parietal lobule. Activation of the supplementary motor area and bilateral pre-central gyrus has been associated with poorer response inhibition, presumably because the activation represents motor activity that is not fully suppressed and therefore leads to increased response competition (Congdon et al., 2010). The second cluster included the left insular cortex, extending into the central opercular cortex, left anterior temporal lobe, left putamen, and left thalamas. The insular, opercular, thalamus, and putamen regions are part of the cingulo-opercular network, hypothesized to be involved in prolonged task maintenance during cognitive control (Dosenbach et al., 2007). The third cluster included areas of the left anterior prefrontal cortex such as the middle frontal gyrus and frontal pole. The lateral anterior prefrontal cortex is hypothesized to work with the anterior cingulate to engage and adjust top-down modulation of cognitive control (Botvinick et al., 2001). To further characterize group differences in activation in these three extended clusters, we conducted ROI analyses based on the conjunction of fMRI activation and neuranatomical regions delineated in the Harvard-Oxford cortical and subcortical atlases packaged with FSL.
The ROI results indicated that fitness was associated with differences in regional activation in the Con and Inc conditions, and suggest that the two groups are using different strategies during task performance. To confirm that each ROI showed the Group × Condition interaction representative of the larger cluster, separate repeated measures ANOVAs for each ROI were conducted to examine group differences in task-related activation, with Condition (Con, Inc) as the within-subjects factor and Group (LF, HF) as the between-subjects factor. All 13 ROIs had a significant Group × Condition interaction at p < .01 (see Table 3). To further break down the Group × Condition interactions, interaction analyses were followed by two-tailed independent t-tests that compared group activation differences in Con and Inc conditions. Results from this analysis are listed in Table 3 and illustrated in Figure 3; they indicate that interactions were largely driven by activation differences during the Con condition, with the exception of the left central opercular cortex.
Table 3.
Summary of statistics for ROI analysis
| Independent samples t-test (2-tailed), DF=26 |
|||
|---|---|---|---|
|
Cluster ROI |
Group x Condition |
Con | Inc |
| Cluster 1 | |||
| Anterior cingulate cortex | F=19.13, p<.001 | t=2.66, p=.01, HF>LF | NS |
| Post-central gyrus | F=11.02, p=.003 | t=2.85, p=.008, HF>LF | NS |
| Pre-central gyrus | F=13.43, p=.001 | t=2.69, p=.01, HF>LF | NS |
| L Superior parietal lobule | F=8.82, p=.006 | t=2.74, p=.01, HF>LF | NS |
| Supplementary motor area | F=11.15, p=.003 | t=2.34, p=.03, HF>LF | NS |
| Precuneus | F=7.86, p=.009 | t=3.16, p=.004, HF>LF | NS |
| Cluster 2 | |||
| L Central opercular cortex | F=13.31, p=.001 | NS | t=1.94, p=.06, LF>HF |
| L Insular cortex | F=18.93, p<.001 | NS | NS |
| L Temporal lobe | F=8.44, p=.007 | t=1.95, p=.06, HF>LF | NS |
| L Putamen | F=9.76, p=.004 | NS | NS |
| L Thalamus | F=17.41, p<.001 | t=2.28, p=.03, HF>LF | NS |
| Cluster 3 | |||
| L Frontal pole | F=10.59, p=.003 | NS | NS |
| L Middle frontal gyrus | F=14.22, p=.001 | t=3.43, p=.002, HF>LF | NS |
Caption: Degrees of freedom for Group × Condition interaction are F(1,26); NS denotes p>.10, exact p-values given when p<.10, and p-value range given when p<.001.
Figure 3.

ROI task activation summary for Con and Inc condition for LF and HF children; Harvard Oxford anatomical ROIs derived from activation clusters that were significant for group × condition interaction (see Table 2c, 2d); *p≤.05, †p>.05<.10; error bars represent SE of mean; all brains depicted in radiological orientation (R=L, L=R). ROIs for cluster 1 include (left to right): dorsal anterior cingulate cortex, post-central gyrus, pre-central gyrus, superior parietal lobule, supplementary motor area, precuneus; ROIs for cluster 2 include: left central opercular cortex, insula, anterior temporal lobe, putamen, and thalamus; ROIs for cluster 3 include: left frontal pole and left middle frontal gyrus.
If there were strategy differences between fitness groups, we would expect different ROIs to be related to different aspects of behavioral performance. Thus, to examine how differences in task-related brain activity may be related to task strategy, we assessed the association between regional brain activation and task performance within groups. For this analysis, due to small group sizes, conservative estimates of brain-behavior associations were examined with two-tailed non-parametric Kendall’s tau correlations; we report only correlations that were significant at p ≤ .05, and results are summarized in Figure 4. Only activation for the HF group was correlated with task performance. Activity in the left putamen was associated with greater Con accuracy (r = .44, p = .04), whereas activity in the left central opercular cortex and dorsal anterior cingulate during the Inc condition was associated with higher Inc accuracy (r =.42, p = .05; r = .47, p = .03, respectively). Activation in the left middle frontal gyrus and left putamen during the Inc condition were associated with greater Inc accuracy, with marginal significance (r = .40, p = .06; r = .40, p=.06, respectively).
Figure 4.

Summary of associations between functional activity and performance; LF=Lower-fit, HF=Higher-fit; +Con act. and +Inc act. indicate greater activation for congruent and incongruent conditions, respectively; +Con acc and +Inc acc indicate greater accuracy for congruent and incongruent conditions, respectively. Statistical maps are shown in neurological orientation (R=R and L=L), surface visualization is on the PALS-B12 atlas using CARET (http://brainvis.wustl.edu); activations are significant clusters for fitness × condition interaction (see Table 2c, 2d), at voxel threshold of Z >2.33, and cluster-correction threshold of p<.05.
4. Discussion
Our results add to the growing research on the development of cognitive control and with ERP studies that have investigated whether individual differences in aerobic fitness are associated with improved cognitive control in children. Children performed poorer than adults on the task condition requiring greater cognitive control, while showing generally slower response speed. However, HF children showed greater overall accuracy and less interference cost than LF children; accuracy cost was not significantly different between HF children and YA, and LF children showed significantly more cost than both HF and YA. These results suggest accuracy may be more sensitive to individual differences in fitness in children, and corroborate previous studies of cognitive control and fitness in children (Hillman et al., 2009, Pontifex et al., 2011), and the broader literature of cognitive development (Davidson et al., 2006).
Given that behavioral results suggest aerobic fitness affects functional capacities of the cognitive control system in children, we examined whether this would be evident based on brain activation patterns of performance-matched LF and HF children while performing a task that modulated cognitive control requirements. Results showed that as the task became more difficult LF children had greater activation of a network associated with cognitive control compared to HF children. Condition-specific comparisons further showed that activation during the Con condition primarily drove Group × Condition interactions in brain activation, with HF children activating significantly more than LF in the Con condition. Only the left central opercular cortex showed a group difference in Inc activation, with HF children showing a trend for less activation than LF during the Inc condition. Also, within-group brain-behavior correlations showed that only activation for the HF group was associated with performance. Greater activation in the left central opercular and dorsal anterior cingulate cortices during the Inc condition was associated with greater Inc accuracy. Interestingly, in both of these regions HF children had greater activation during the Con condition and showed either significantly less (opercular) or the same (anterior cingulate) activation than LF children during the Inc condition. Results also showed that greater left putamen activity during the Con condition was associated with greater Con accuracy. Yet left putamen activation was not statistically different between groups during the Con condition.
Since groups were matched on performance, we interpret the results in the context of different task strategies made possible by differences in brain function between LF and HF children. Overall, there is a pattern where HF activate more in the Con condition than Inc, whereas LF activate more in the Inc than the Con condition. This pattern may be interpreted in the context of a theory we posited previously (Pontifex et al., 2011), where LF children are hypothesized to engage in reactive control strategies compared to HF children, who are more likely to engage in proactive cognitive control. Reactive control is transiently engaged following stimulus selection but preceding response execution, whereas proactive control engages the cognitive control system based on task context, involving maintenance of a flexible task set that biases attention to relevant stimuli before selection and response (Braver et al., 2009). In most situations, reactive control is less optimal as it is more vulnerable to stimulus-based interference. Pontifex et al. (2011) suggested that LF children adopt a reactive control strategy by continually engaging the anterior cingulate to try to initiate top-down control from the prefrontal cortex. Whereas the reactive control strategy may be beneficial for LF children in the Con condition, they are unable to up-regulate the system to efficiently implement a reactive strategy in the more difficult Inc condition. In contrast, HF children may adopt a proactive strategy according to increased demand for cognitive control in the Inc condition, resulting in an increased capacity for the anterior cingulate to initiate top-down control from the lateral prefrontal cortex. The difference in strategy may be driven by the inability of LF children to effectively engage the anterior prefrontal cortex to maintain a sustained task set (Fair et al., 2007), as this has been suggested as a hypothesis for why older adults tend to also use a reactive versus a proactive control strategy (Paxton et al., 2008).
In this context, activation during the Con condition may reflect enhanced reactive control for the LF children and lack of engagement of proactive control for the HF children. In contrast, during the Inc condition, LF children are unable to efficiently engage the reactive strategy, which results in greater activation of the network, reflective of inefficient regulation of cognitive control, and in turn worse performance as the task becomes more difficult. Whereas HF children sufficiently upregulate the proactive strategy in the more difficult condition, which results in more efficient processing, and in turn less brain activation coupled with better task performance. Thus, more efficient activation from HF children during difficult task conditions would explain the seemingly paradoxical effect where they activate less, yet within the smaller range of brain activity, more activation is associated with better performance. Also in-line with this theoretical account was the marginal association between increased left middle frontal gyrus activation and Inc accuracy for HF, but not LF children. Together, the interaction pattern and differences in within-group brain-behavior correlations suggest that HF children are utilizing a different strategy that is made possible by more efficient cognitive control brain networks. To more directly test this hypothesis, however, future research could utilize an fMRI experimental design that permits dissociating cue and target stimulus processing (Braver et al., 2009) to examine whether the timecourse of preparatory (proactive) versus reactive brain activity differs between fitness groups or whether strategy shifts occur following aerobic training.
As predicted, in this study fitness was associated with different brain activation patterns in regions associated with cognitive control processes. HF children demonstrated more efficient activation of brain regions involved in the cingulo-opercular network. Yet one study that has shown this brain network continues to develop throughout childhood examined this network during the resting state, a measure of functional brain activity during quiet rest (Fair et al., 2007). This suggests that fitness may not only affect the extent to which these brain regions are evoked during task demands, but that fitness may also affect the fundamental functional architecture of cognitive control brain systems. The two possibilities are not mutually exclusive, as the cohesion of brain networks during the resting state is thought to directly affect their active recruitment. Nevertheless, it will be important for future research to characterize how the resting functional architecture of the developing brain is impacted by individual differences in fitness, and the impact of such differences on differences in task-related brain activity and performance.
The extent to which brain volume differences contribute to our results is unknown. A recent study has shown that HF children have greater dorsal striatum volume compared to LF children, which was in turn related to improved conflict resolution (Chaddock et al., 2010). However, in this study although HF children had greater volume of the left putamen, volume in this region was not associated with Con accuracy. Thus, it is unlikely that volumetric differences played a role in the left putamen functional activation differences in the current study. However, it will be important for future research to integrate how individual differences in developmental structural and functional plasticity interact to affect performance in children. Another limitation of this study is the cross-sectional design, and it is therefore possible that genetic or lifestyle factors other than aerobic fitness level contributed to our results. To address this concern, information about average hours of television viewing on weekday and weekend, average computer hours on weekday and weekend, average hours of videogame play on weekday and weekend, and socioeconomic status was collected. However, LF and HF groups did not differ on any of these variables (all p>.05 from two-tailed independent t-test). Yet, it is important to point out that replication of these results in a longitudinal, randomized controlled exercise training study would greatly increase the strength of the conclusions from the current study.
This is the first study to use fMRI to examine how the developing functional brain is affected by individual differences in aerobic fitness in children who vary on aerobic fitness but who are not overweight. For example, while a recent study showed that aerobic fitness training resulted in increased prefrontal cortex activation and decreased posterior parietal cortex activation during a task requiring cognitive control, activation specific to cognitive control was not isolated and participants were only included in the study if they were overweight based on their body mass index (Davis et al., 2011). We therefore provide novel evidence for the role of aerobic fitness in facilitating greater efficiency of cognitive control networks in children. Our results also add to previous ERP research by offering insight into their spatial realization in the functioning brain. Additionally, our results raise important issues for future study such as whether event-related fMRI activity consistent with different cognitive control strategies would differentially emerge in LF and HF children, and to what extent differences in resting state functional connectivity of cognitive control networks would contribute to fitness differences in performance and task-related brain activation patterns.
Research Highlights.
We examined the impact of fitness on cognitive control in preadolescent children.
Higher-fit children outperformed lower-fit children on a cognitive control measure.
We examined differences in brain activation for performance-matched fitness groups.
Brain activity differences suggested the two groups used different strategies.
Higher-fit children used a strategy that enabled more efficient cognitive control.
Table 2b.
Summary of group differences in fMRI activation for LF and HF groups matched on behavioral performance for (a) LF children, (b) HF children, (c) LF > HF children, and (d) HF > LF children. Task activation foci for higher-fit children
| Cluster Anatomical Description Higher-fit Children Task Contrast |
MNI coordinates (x,y,z) |
Z Score | Voxels | p-value |
|---|---|---|---|---|
| Congruent > Baseline | ||||
| L supplementary motor area, extending into R supplementary motor area, R pre- central gyrus, L superior frontal gyrus |
−10, −2, 56 | 4.50 | 2493 | 4.11 × 10⁻⁶ |
| R occipital pole, extending into R occipital fusiform gyrus |
22, −94, −10 | 5.70 | 1487 | 4.67 × 10⁻⁴ |
| L occipital pole, extending into L lateral occipital cortex |
−22, −100, − 12 |
5.59 | 1137 | .003 |
| L thalamus, extending into L putamen, L insular cortex, L caudate |
−14, −20, 18 | 4.18 | 714 | .04 |
| Incongruent > Baseline | ||||
| R occipital pole, extending into R occipital fusiform gyrus |
24, −94, −10 | 4.79 | 1287 | .001 |
| L occipital pole, extending into L inferior lateral occipital cortex |
−20, −98, −12 | 4.96 | 891 | .01 |
| Congruent > Incongruent | ||||
| None | ||||
| Incongruent > Congruent | ||||
| None |
Caption: Statistical parametric map threshold set at Z>2.33 voxel, p<.05 cluster-correction; R=Right, L=Left brain hemisphere, MNI coordinates are for statistical peaks in cluster and Z Score is for corresponding coordinate location; Voxels refer to the number of standard space voxels in the cluster; p-value is the p-value significance for the cluster.
Acknowledgements
We would like to thank Nancy Dodge, Holly Tracy and Luke Tseng for their help in data collection. Support for our research was provided by grants from the National Institute on Aging (RO1 AG25667 and RO1 AG25302) to Arthur Kramer and the National Institute of Child Health and Human Development (RO1 HD055352) to Charles Hillman.
Footnotes
Publisher's Disclaimer: This is a PDF file of an unedited manuscript that has been accepted for publication. As a service to our customers we are providing this early version of the manuscript. The manuscript will undergo copyediting, typesetting, and review of the resulting proof before it is published in its final citable form. Please note that during the production process errors may be discovered which could affect the content, and all legal disclaimers that apply to the journal pertain.
References
- Bar-Or O. Pediatric sports medicine for the practitioner: From physiologic principles to clinical applications. Springer-Verlag; New York: 1983. [Google Scholar]
- Barnes KA, Cohen AL, Power JD, Nelson SM, Dosenbach YBL, Miezin FM, Petersen SE, Schlaggar BL. Identifying Basal Ganglia divisions in individuals using resting-state functional connectivity MRI. Front Syst Neurosci. 2010;4:18. doi: 10.3389/fnsys.2010.00018. [DOI] [PMC free article] [PubMed] [Google Scholar]
- Beckmann CF, Jenkinson M, Smith SM. General multilevel linear modeling for group analysis in FMRI. NeuroImage. 2003;20:1052–1063. doi: 10.1016/S1053-8119(03)00435-X. [DOI] [PubMed] [Google Scholar]
- Botvinick M, Nystrom LE, Fissell K, Carter CS, Cohen JD. Conflict monitoring versus selection-for-action in anterior cingulate cortex. Nature. 1999;402:179–181. doi: 10.1038/46035. [DOI] [PubMed] [Google Scholar]
- Botvinick MM, Braver TS, Barch DM, Carter CS, Cohen JD. Conflict monitoring and cognitive control. Psychological Review. 2001;108:624–652. doi: 10.1037/0033-295x.108.3.624. [DOI] [PubMed] [Google Scholar]
- Braver TS, Barch DM. Extracting core components of cognitive control. Trends in Cognitive Sciences. 2006;10:529–532. doi: 10.1016/j.tics.2006.10.006. [DOI] [PubMed] [Google Scholar]
- Braver TS, Paxton JL, Locke HS, Barch DM. Flexible neural mechanisms of cognitive control within human prefrontal cortex. Proc Natl Acad Sci USA. 2009;106:7351–7356. doi: 10.1073/pnas.0808187106. [DOI] [PMC free article] [PubMed] [Google Scholar]
- Bunge SA, Dudukovic NM, Thomason ME, Vaidya CJ, Gabrieli JDE. Immature frontal lobe contributions to cognitive control in children: evidence from fMRI. Neuron. 2002;33:301–311. doi: 10.1016/s0896-6273(01)00583-9. [DOI] [PMC free article] [PubMed] [Google Scholar]
- Casey BJ, Giedd JN, Thomas KM. Structural and functional brain development and its relation to cognitive development. Biol Psychol. 2000a;54:241–257. doi: 10.1016/s0301-0511(00)00058-2. [DOI] [PubMed] [Google Scholar]
- Casey BJ, Thomas KM, Welsh TF, Badgaiyan RD, Eccard CH, Jennings JR, Crone EA. Dissociation of response conflict, attentional selection, and expectancy with functional magnetic resonance imaging. Proc Natl Acad Sci USA. 2000b;97:8728–8733. doi: 10.1073/pnas.97.15.8728. [DOI] [PMC free article] [PubMed] [Google Scholar]
- Castelli DM, Hillman CH, Buck SM, Erwin HE. Physical Fitness and Academic Achievement in Third- and Fifth-Grade Students. Journal of Sport and Exericse Psychology. 2007:1–8. doi: 10.1123/jsep.29.2.239. [DOI] [PubMed] [Google Scholar]
- Chaddock L, Erickson K, Prakash R, Vanpatter M, Voss M, Pontifex M, Raine L, Hillman C, Kramer A. Basal Ganglia Volume Is Associated with Aerobic Fitness in Preadolescent Children. Developmental Neuroscience. 2010;32:249–256. doi: 10.1159/000316648. [DOI] [PMC free article] [PubMed] [Google Scholar]
- Chomitz VR, Slining MM, McGowan RJ, Mitchell SE, Dawson GF, Hacker KA. Is there a relationship between physical fitness and academic achievement? Positive results from public school children in the northeastern United States. J Sch Health. 2009;79:30–37. doi: 10.1111/j.1746-1561.2008.00371.x. [DOI] [PubMed] [Google Scholar]
- Church JA, Petersen SE, Schlaggar BL. The “Task B problem” and other considerations in developmental functional neuroimaging. Human Brain Mapping. 2010;31:852–862. doi: 10.1002/hbm.21036. [DOI] [PMC free article] [PubMed] [Google Scholar]
- Colcombe SJ, Kramer AF, Erickson KI, Scalf P, McAuley E, Cohen NJ, Webb A, Jerome GJ, Marquez DX, Elavsky S. Cardiovascular fitness, cortical plasticity, and aging. Proc Natl Acad Sci USA. 2004;101:3316–3321. doi: 10.1073/pnas.0400266101. [DOI] [PMC free article] [PubMed] [Google Scholar]
- Congdon E, Mumford JA, Cohen JR, Galvan A, Aron AR, Xue G, Miller E, Poldrack RA. Engagement of large-scale networks is related to individual differences in inhibitory control. Neuroimage. 2010;53:653–663. doi: 10.1016/j.neuroimage.2010.06.062. [DOI] [PMC free article] [PubMed] [Google Scholar]
- Davidson MC, Amso D, Anderson LC, Diamond A. Development of cognitive control and executive functions from 4 to 13 years: evidence from manipulations of memory, inhibition, and task switching. Neuropsychologia. 2006;44:2037–2078. doi: 10.1016/j.neuropsychologia.2006.02.006. [DOI] [PMC free article] [PubMed] [Google Scholar]
- Davis CL, Tomporowski PD, McDowell JE, Austin BP, Miller PH, Yanasak NE, Allison JD, Naglieri JA. Health psychology : official journal of the Division of Health Psychology. Vol. 30. American Psychological Association; 2011. Exercise improves executive function and achievement and alters brain activation in overweight children: a randomized, controlled trial; pp. 91–98. [DOI] [PMC free article] [PubMed] [Google Scholar]
- Dosenbach NUF, Fair DA, Cohen AL, Schlaggar BL, Petersen SE. A dual-networks architecture of top-down control. Trends in Cognitive Sciences. 2008;12:99–105. doi: 10.1016/j.tics.2008.01.001. [DOI] [PMC free article] [PubMed] [Google Scholar]
- Dosenbach NUF, Fair DA, Miezin FM, Cohen AL, Wenger KK, Dosenbach RAT, Fox MD, Snyder AZ, Vincent JL, Raichle ME, Schlaggar BL, Petersen SE. Distinct brain networks for adaptive and stable task control in humans. Proc Natl Acad Sci USA. 2007;104:11073–11078. doi: 10.1073/pnas.0704320104. [DOI] [PMC free article] [PubMed] [Google Scholar]
- Eriksen CW, Eriksen BA. Effects of noise letters upon the identification of a target letter in a non-search task. Perception and Psychophysics. 1974;16:143–149. [Google Scholar]
- Fair DA, Dosenbach NUF, Church JA, Cohen AL, Brahmbhatt S, Miezin FM, Barch DM, Raichle ME, Petersen SE, Schlaggar BL. Development of distinct control networks through segregation and integration. Proc Natl Acad Sci USA. 2007;104:13507–13512. doi: 10.1073/pnas.0705843104. [DOI] [PMC free article] [PubMed] [Google Scholar]
- Forster SE, Brown JW. Medial prefrontal cortex predicts and evaluates the timing of action outcomes. NeuroImage. 2011;vol. 55:253–265. doi: 10.1016/j.neuroimage.2010.11.035. [DOI] [PMC free article] [PubMed] [Google Scholar]
- Freedson PS, Goodman TL. Measurement of oxygen consumption. In: Rowland TW, editor. Pediatric laboratory exercise testing: Clinical guidelines. Human Kinetics; Champaign, IL: 1993. pp. 91–113. [Google Scholar]
- Gehring WJ, Knight RT. Prefrontal-cingulate interactions in action monitoring. Nat Neurosci. 2000;3:516–520. doi: 10.1038/74899. [DOI] [PubMed] [Google Scholar]
- Hazeltine E, Poldrack R, Gabrieli JD. Neural activation during response competition. Journal of Cognitive Neuroscience. 2000;12(Suppl 2):118–129. doi: 10.1162/089892900563984. [DOI] [PubMed] [Google Scholar]
- Hillman CH, Buck SM, Themanson JR, Pontifex MB, Castelli DM. Aerobic fitness and cognitive development: Event-related brain potential and task performance indices of executive control in preadolescent children. Dev Psychol. 2009;45:114–129. doi: 10.1037/a0014437. [DOI] [PubMed] [Google Scholar]
- Jenkinson M, Bannister P, Brady M, Smith S. Improved optimization for the robust and accurate linear registration and motion correction of brain images. NeuroImage. 2002;17:825–841. doi: 10.1016/s1053-8119(02)91132-8. [DOI] [PubMed] [Google Scholar]
- Kaufman AS, Kaufman NL. Kaufman Brief Intelligence Test manual. American Guidance Service; Circle Pines, MN: 1990. [Google Scholar]
- Oldfield RC. The assessment and analysis of handedness: the Edinburgh inventory. Neuropsychologia. 1971;9:97–113. doi: 10.1016/0028-3932(71)90067-4. [DOI] [PubMed] [Google Scholar]
- Paxton JL, Barch DM, Racine CA, Braver TS. Cognitive control, goal maintenance, and prefrontal function in healthy aging. Cereb Cortex. 2008;18:1010–1028. doi: 10.1093/cercor/bhm135. [DOI] [PMC free article] [PubMed] [Google Scholar]
- Pontifex MB, Raine LB, Johnson CR, Chaddock L, Voss MW, Cohen NJ, Kramer AF, Hillman CH. Cardiorespiratory Fitness and the Flexible Modulation of Cognitive Control in Preadolescent Children. Journal of cognitive neuroscience. 2011;23:1332–1345. doi: 10.1162/jocn.2010.21528. [DOI] [PubMed] [Google Scholar]
- Smith SM. Fast robust automated brain extraction. Human Brain Mapping. 2002;17:143–155. doi: 10.1002/hbm.10062. [DOI] [PMC free article] [PubMed] [Google Scholar]
- Taylor SJC, Whincup PH, Hindmarsh PC, Lampe F, Odoki K, Cook DG. Performance of a new pubertal self-assessment questionnaire: A preliminary study. Pediatr Perinat Epidemiol. 2001;15:88–94. doi: 10.1046/j.1365-3016.2001.00317.x. [DOI] [PubMed] [Google Scholar]
- Utter AC, Robertson RJ, Nieman DC, Kang J. Children’s OMNI scale of perceived exertion: Walking/running evaluation. Medicine and science in sports and exercise. 2002;34:139–144. doi: 10.1097/00005768-200201000-00021. [DOI] [PubMed] [Google Scholar]
- Whaley MH, Brubaker PH, Otto RM. ACSM’s Guidelines for Exercise Testing and Prescription. 7th Edition Lippincott Williams & Wilkins; New York, NY: 2006. [Google Scholar]