Abstract
The proof of principle for high resolution analysis of intact singly-charged proteins of any size is presented. Singly-charged protein ions were produced by electrospray ionization followed by surface-induced charge reduction at atmospheric pressure. The inlet and trapping system “stops” to forward momentum of the protein ion over a very broad range to be captured by the digitally-produced electric fields of a large radius linear ion trap whereupon they are moved into a smaller radius linear ion trap and collected and concentrated in front of its exit end cap electrode using digital waveform manipulation. The protein ions are then ejected on demand from the end of the small radius linear quadrupole in a tightly collimated ion beam with a instrumentally defined kinetic energy into the acceleration region of an orthogonal acceleration reflectron time-of-flight mass analyzer where their flight times were measured and detected with a Photonis BiPolar TOF detector. We present results that clearly prove that massive singly-charged ions can yield high resolution mass spectra with very low chemical noise and without loss of sensitivity with increasing mass across the entire spectrum. Analysis of noncovalently bound protein complexes was demonstrated with streptavidin-Cy5 bound with a biotinylated peptide mimic. Our results suggest proteins across the entire range can be directly quantified using our mass analysis technique. We present evidence that solvent molecules noncovalently adduct onto the proteins while yielding consistent flight time distributions. Finally, we provide a look into future that will result from the ability to rapidly measure and quantify protein distributions.
Introduction
The development of matrix-assisted laser desorption ionization (MALDI)1 and electrospray ionization (ESI)2 to produce large gas phase ions sparked a revolution in the biological sciences that began in the late 1980s and is going on still. It permitted scientists to use mass spectrometers to analyze biomolecules. Unfortunately, the range of biomolecular masses was greater than the range of the mass spectrometers. For example, protein masses range up to roughly 200 kDa whereas mass spectrometers provide analytically useful data up to roughly 20 kDa.3 Consequently, large biomolecules have to be systematically fragmented or multiply charged so that their mass-to-charge ratio fits within the working range of the mass spectrometer. This makes the analysis of the data tedious; however, the data gleaned is so valuable that entire industries were developed to facilitate this analysis.
Attempts were made to expand the working range of mass spectrometers.4, 5 The time-of-flight mass spectrometer (TOF) was a primary focus for this work because its mass range theoretically unlimited.6 In practice its mass range is limited by the loss of control over the kinetic energy and spatial distributions of the ions with increasing mass as they are injected into the acceleration region of the mass spectrometer with the consequence of a corresponding reduction in mass accuracy and resolution.7
For the first time we show that intact singly-charged proteins over the entire range can be mass analyzed with high resolution and mass accuracy with our newly developed inlet,8 trapping system9 and digital waveform technology that permits trapped ions be injected into the TOF in a well-collimated ion beam10 to obtain high resolution and mass accuracy at any protein mass. Rapid quantitation of complex protein distributions is now feasible by mass spectrometry.
Loss of control of the ions with increasing mass results from the expansion into vacuum—the greater the mass the greater the expansion induced kinetic energy. Attempts have been made to eliminate the expansion-induced kinetic energy by increasing the buffer gas pressure in the first ion guide of quadrupole time-of-flight mass analyzers (Q-TOFs).5 This yielded increased sensitivity but poor resolving power (m/Δm ≈ 200). Our analysis of their data suggested that the effusive expansion out of the first ion guide created dispersive trajectories out of the guide that increased with increasing mass.7
Experimental
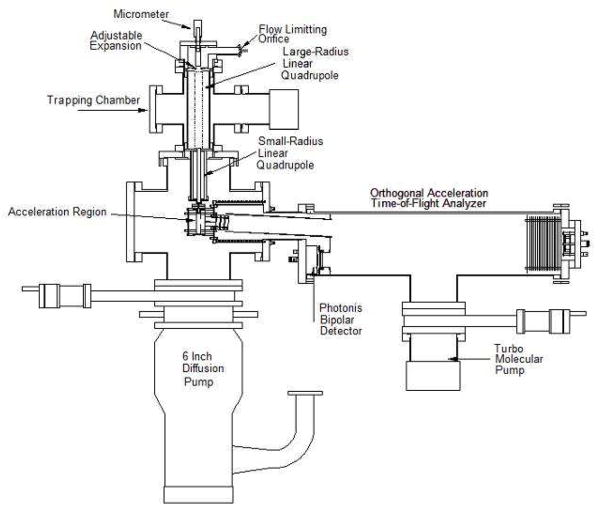
Our analysis of the mass related resolution problem led to the development of the instrument shown in Figure 1. It consists of a kinetic energy reducing inlet8 and a large radius linear quadrupole ion trap9 (25.4 mm rods) that is used to transfer the ions into vacuum and capture them to remove the residual expansion-induced kinetic energy. The details of the inlet and trapping systems for capturing massive singly charged ions are covered in references 8 and 9 respectively. A second smaller radius linear quadrupole ion guide/trap (12.5 mm rods) was added after the large trap to collect the ions before they are introduced to the orthogonal acceleration time-of-flight mass analyzer (oa-TOF) (RM Jordan Co. Inc.). Electrodes were inserted in between the quadrupole rods of the linear traps to push the ions along the symmetry axes of the traps after the forward motion of the ions has been arrested in the first guide.10 The ion guides are operated digitally. The applied digital waveforms were manipulated to trap and subsequently eject the ions in a well-collimated ion beam with controlled kinetic energy into the acceleration region of the oa-TOF.10 Trapping the ions at the end of the small ion guide just before the entrance of the oa-TOF and then ejecting them in a collimated beam permits high resolution and mass accuracy at any mass-to-charge ratio.10
Figure 1.
Schematic of the ultra high mass spectrometer. Ions enter the instrument through a flow limiting orifice and undergo a controlled expansion into a large linear ion trap/guide. They are then transferred into a small trap and collected near the exit. The ions are then axially ejected in a well-collimated plug into the oa-TOF using digital waveform manipulation to yield sensitive spectra with high resolution and mass accuracy.
Results and Discussion
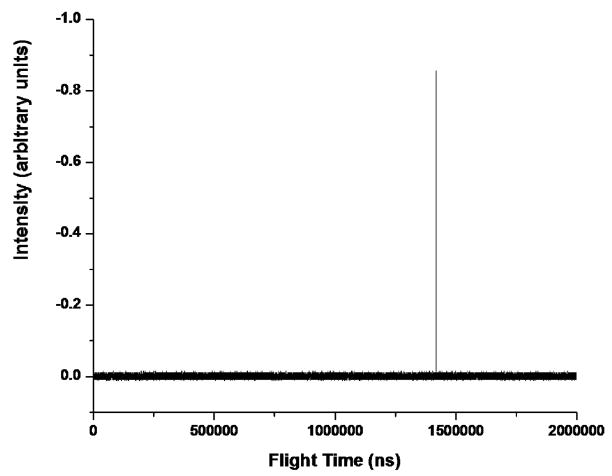
Figure 2 demonstrates the proof of principle that massive singly-charged ions can be mass analyzed with high resolution and accuracy if their trajectories into the TOF can be controlled. It is a single unaveraged spectrum. 5 μM bovine serum albumin (BSA, 66 kDa) was electrosprayed from a 1:1 solution of methanol and water. BSA from the manufacturer (Sigma Aldrich) was used without modification or purification. The BSA aerosol impacted the inside surface of the 1/4 in. tube before the 100 μm inlet orifice.8, 9 Figure 3 reveals the geometry of the electrospray ionization-charge reduction process (ESI-CR). The beauty of this ion generation process is that it is extremely easy to set up and it can yield singly-charged ions exclusively. Deliberately impacting the highly-charged aerosol droplets with the grounded metal surface reduced the charge distribution of the BSA-containing droplets in a manner similar to the desorption electrospray process (DESI).11 There are other methods of charge reduction.12–16 There is even a commercial ESI-CR system made by TSI Inc. that we have in our laboratory. We use the method depicted in Figure 3 because it is extremely robust, reproducible and expedient. The BSA+ ions present as a singular well-resolved peak. Perhaps the best feature of the technique is the precision of the mass measurement. The peak of the protein’s mass distribution can be identified to within 1ns (limited by the digitizer). The jitter of the spectrum is about 6 ns on a shot to shot comparison of the BSA time of flight. That is about the equivalent of 0.5 Da for BSA. Better power supplies and electronics should minimize the observed jitter. Since the flight time of BSA+ is approximately 1.4 ms, the temporal precision is better than 1 ppm. The peak or average of a protein’s isotopic mass distribution can be identified to approximately one tenth of a mass unit. It is our contention that the accurately measured nominal flight time can be used to identify proteins.
Figure 2.
High resolution (1 ns/point) mass spectrum of singly-charged bovine serum albumin (BSA+).
Figure 3.
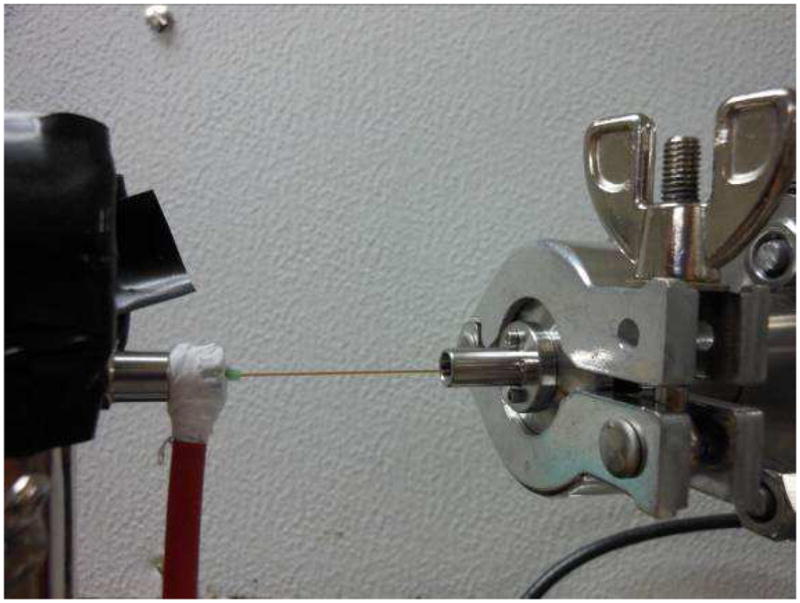
Image of the electrospray setup that yields charge reduction. The charged aerosol droplets impact on the inside tube surface to yield charge reduction and then enter the mass spectrometer.
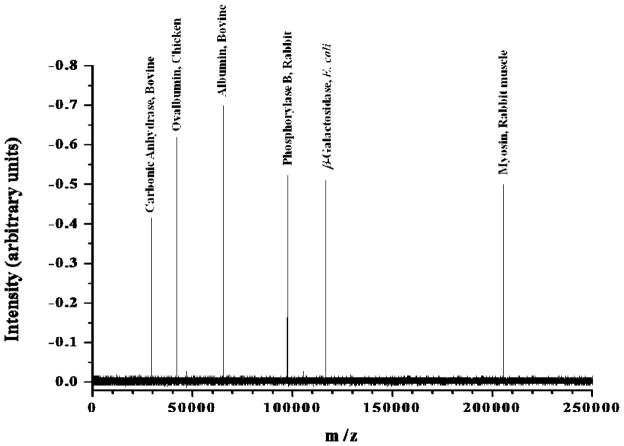
Our intention has always been to use this mass analysis technique to rapidly measure protein distributions and quantify the changes in them associated with specific influences. The current state-of-the-art method for characterizing protein distributions is page gel separation. For comparison, a commercially available standard mixture of molecular weight marker proteins, SDS6H2 Sigma Aldrich, was dissolved in a 1:1 solution of methanol and water (1.0 mg/ml) to make a stock solution. This solution was diluted by a factor of 20 in 1:1 methanol/water yielding 50 μg/ml total concentration of all the proteins. No buffer was added. The mixture was then electrosprayed directly into the ¼ in OD tube where the highly charged droplets impact on the inside of the tube and undergo charge reduction.8 The resulting mass spectrum is shown in Figure 4. It is a single unaveraged spectrum. According to a Sigma-Aldrich representative, the concentration of the marker proteins was formulated to yield well-defined bands after staining with myosin having the lowest molar concentration. They would not reveal the relative concentrations in the sample. However, if we assume that staining optical density is a function of protein mass rather than the number of moles, then the molar concentration of myosin in Figure 4 is less than 40 picomolar. The total number of ions injected into the TOF for each of the presented spectra (Figures 3, 4 and 5) is approximately 2 × 10⁶ as defined by a Faraday plate placed on the opposite side of the acceleration region of the TOF. The protein ion intensities and resolution in our mass spectrum do not markedly decrease with increasing mass over a very broad range of masses. This is not typical. It is a testament to the validity of our ion handling technique. Ions with an order of magnitude difference in mass can be transferred into vacuum from the atmosphere with roughly equal efficiency. Moreover, those ions are equally collimated into an ion beam or plug and injected into the oa-TOF with minimal dispersion and tightly controlled kinetic energy.
Figure 4.
Mass spectrum of protein marker mixture, SDS6H2 (Sigma-Aldrich) containing carbonic anhydrase (29 kDa), ovalbumin (45 kDa), bovine serum albumin (66 kDa), phosphorylase B (97 kDa), β-galactosidase (116 kDa) and myosin (205 kDa)
Figure 5.
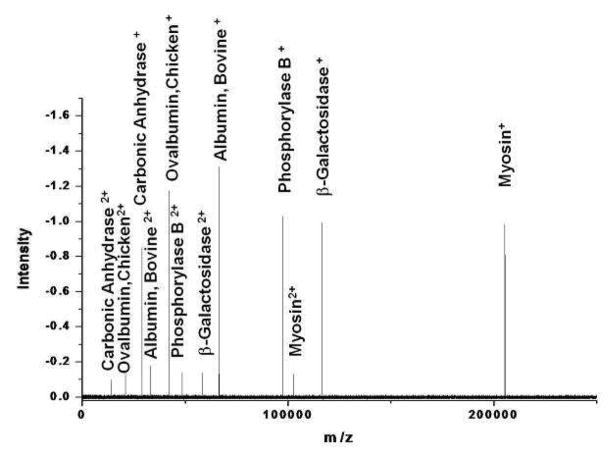
Low resolution ESI-CR of SDS6-H2 marker protein mixture. The observed charge distribution change results from translating the ESI capillary further into the stainless steel tube (see Figure 3).
One of the questions that has often been asked is, “Where is the noise?” It has been claimed that the low apparent mass resolution of massive highly-charged ions is due to chemical heterogeneity of either the sample or induced by multiple adducts/salts to the protein sample.17 That is not happening here. The proteins used in our measurements were used directly from the manufacturer without further purification. In this publication, we are not interested in establishing the sensitivity of the technique; therefore, liberal protein sample concentrations were used to demonstrate the proof of principle for high resolution in the ultra high mass range. The 1:1 solution of methanol/water did not add any observable alkali ions. (Later in this manuscript we will show that we would easily differentiate sodium adducts.) The lack of chemical noise in our case is due in part to the purity of the samples and solvents; however for these large intact proteins, it is primarily due to the quality of our ion handling technique. The only time that our sample solutions interact with a surface is during their travel through the electrospray capillary and while they are in electrospray produced droplets as they impact on the inside surface of the ¼ in OD stainless steel tube in front of the thin 100 μm flow limiting orifice. The other place where mass spectral noise may arise is during the ion injection process into the TOF analyzer. In a previous publication,7 we showed that an effusive expansion out of the first quadrupole can create dispersive ion injection into the TOF when the ions are large but not when they are small. Dispersive ion injection results in sample ions impacting on surfaces in acceleration region of the mass spectrometer. That process is a major culprit of noisy spectra and does not happen with our injection technique. Theoretically, if the ion trajectories into an orthogonal acceleration TOF parallel the surfaces of the electrodes with a precisely controlled kinetic energy distribution, the time-of-flight profiles will precisely correlate with the mass distribution of the ions injected. Therefore, chemical adducts should be resolvable and not create noise. The novelty of our technique is that we can make this happen at essentially any mass. This is the reason that we obtain high resolution in the ultra high mass range (m/z > 20,000). It is also the reason that our spectra are not noisy.
To illustrate our ability to manipulate the ion charge, the electrospray needle tip was translated further into the ¼ in OD tube (see Figure 3). This increased the concentration of the doubly charged ions (see Figure 5). It is a single unaveraged spectrum. The same stock solution was used, but was diluted by a factor of 100 to yield a total concentration of 10 μg/ml. This spectrum was taken on a different day than the one in Figure 4. To make the ion intensities in the spectra comparable, the mass spectrometer was set to collect the ESI-CR output for 10 times as long. Ideally, if the charge reduction conditions were identical, the ion intensities in Figure 5 should be twice that of Figure 4. It’s not quite because the charge reduction conditions were changed slightly so that approximately 10% of the ions were doubly charged and the average ion ratio of each protein in the spectrum is 1.920 ± 0.024. That yields a 1.3% standard deviation in the relative signal intensities of all the proteins. Moreover, the doubly charged ion intensities map the singly charged ion intensities. This is a direct indication of the robustness and simplicity of the ESI-CR ion creation process. It shows that the ionization process is not analyte dependent. This should not be surprising considering our methodology. The charge reduction process occurs while the analyte is encapsulated by the droplet. Therefore, the charge reduction process will depend not on the analyte but rather the characteristics of the solvent. Consequently, changing the solution pH may change to overall ion production efficiency, but it should not change the relative ionization efficiency of the analytes.
We have cursorily looked at the linearity of the signal with concentration and seen linearity over roughly couple orders of magnitude so far. We are not ready to complete the measurement of the dynamic range of the instrument because we have not yet optimized the ion ESI-CR process. Additionally, we would like to also compare it to atmospheric pressure chemical ionization (APCI) before we define the sensitivity and dynamic range.
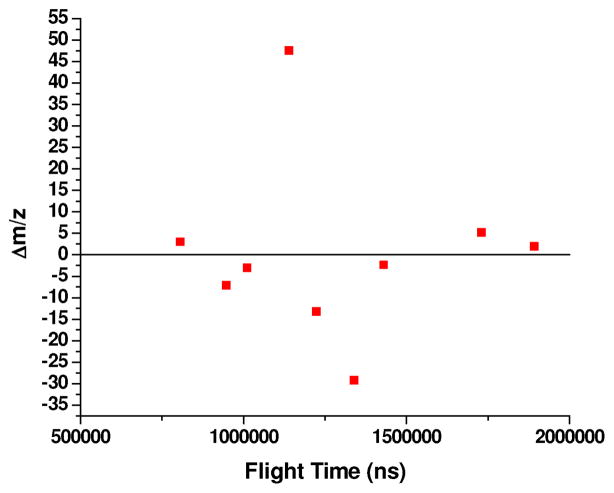
We used the spectrum in Figure 5 to produce the calibration curve shown in Figure 6. We did not include myosin in the calibration because an accurate molecular weight was not available. Our calibration yielded a projected value of m/z of 205,367 for the singly charged and a value of 102,643 for doubly-charged myosin. These two numbers do not reconcile as they should if we can make measurements within 1 mass unit. In Figure 7, we have plotted the mass difference between the reported protein masses plus the requisite number of protons and a nonlinear least squares derived mass calibration curve as a function of the flight time for singly and doubly charged ions. These defects can be quite large and range from −29 to +47 mass units. It is our contention that the large mass differences are not caused by the mass spectrometer or the ion handling. Rather, we believed that it results from solvent molecules hitchhiking along with the proteins up the flight tube and thereby causing the observed large mass defects. The presence of solvent molecules attached to proteins should not come as a surprise. Isotopically resolved intact measurements of multiply charged BSA by FTMS clearly show that a much broader mass spread than can be attributed to the isotope distribution.18
Figure 6.
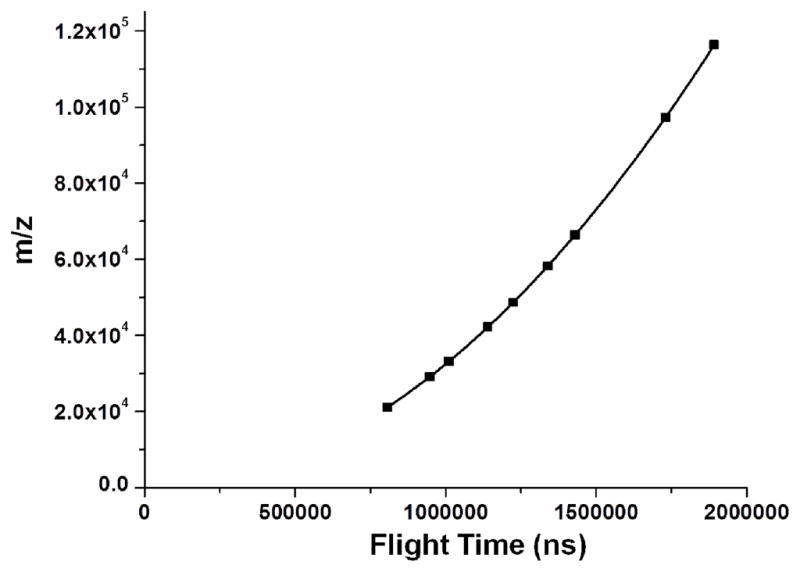
Flight time/mass calibration using the reported masses of the analyzed proteins
Figure 7.
Mass difference between the reported protein masses and those derived from the calibration of their corresponding flight times.
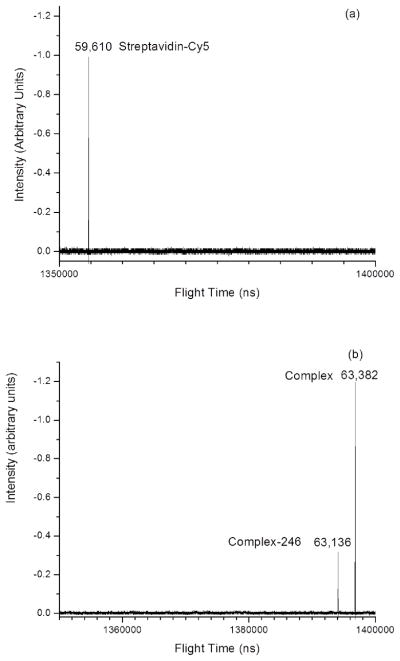
The proof that the proteins are carrying solvent hitchhikers came from characterization of the streptavidin-Cy5 and streptavidin-Cy5 noncovalently bound to a biotinylated peptidomimetic inhibitor of the enzyme-biomarker prostrate specific membrane antigen (PSMA).19 Streptavidin is a well known bacterium-produced homo-tetrameric protein complex that has a very high affinity for biotin. There are four sites available for biotin binding on the streptavidin tetramer. Figure 8(a) presents the spectrum of the streptavidin tetramer observed as a single peak at an m/z of 59,610 without any evidence of fragmentation. Figure 8(b) presents the spectrum of streptavidin noncovalently bound to three biotinylated peptomimetic PSMA inhibitor molecules. The small peak in Figure 8(b) (Complex – 246 u) is likely the loss of a stabilizer molecule may occur when the inhibitors are attached. The proof of water binding comes from the mass analysis of product ions. The mass difference between the inhibitor complex and the native streptavidin is 3772 units. The molecular weight of a biotinylated peptidomimetic PSMA inhibitor molecule is 1269. Three inhibitors noncovalently bound to streptavidin yield a mass deficit of ~35 mass units that can be accounted within the error by the displacement of two water molecules.
Figure 8.
Comparison of the mass spectra of (a) the streptavidin-Cy5 and (b) the preformed complex. The molecular weight difference is 3772 u.
The characterization of the stretavidin complex illustrates two important points. First, our ionization and analysis techniques are extremely gentle. They do not produce significant dissociation of noncovalently bound complexes. Moreover, our ability analyze huge singly-charged complexes suggests that a broader range of complexes should be amenable to analysis because of the lack of charge repulsion inherent in the analysis of multiply-charged species. Second, it illustrates a key strength of our technique; it can measure small differences in very large masses. This makes our analysis technique ideal for the analysis of chemically modified proteins.
Further evidence of solvent hitchhikers is suggested by close examination of the isotope profiles of the peaks. The isotope profile of proteins (without metals) should be Gaussian above ~20 kDa. Some of the proteins that we measured yielded decidedly non-Gaussian profiles. Bovine serum albumin is a case in point. The expanded width of the mass peak is shown in black in Figure 9. Each vertical division represents two mass units. The measured width is ~21 mass units at full width half maximum. The BSA isotope population is represented as the red Gaussian distribution. Its width at half maximum should be approximately 14 mass units. The deviation of the mass peak shape from the Gaussian distribution in anisotropic. We recognized that collisions with the gas phase molecules in the flight tube can happen with such large molecules. A flight tube pressure of 1 × 10⁻⁷ Torr yields a collision rate z for BSA+ ions (dBSA = 6.1 nm) and the background gas (dBG ≈ 0.15 nm) of 100 s−1: z=σνPNA/RT, where P is the pressure NA is Avagadro’s number, R is the gas constant, T is the absolute temperature, ν is the ion velocity (flight length/flight time) and σ is the collision cross section (σ≈¼*d2BSA*π). Each BSA+ ion undergoes an average of 0.14 collisions with the background gas during the flight through the tube. Those collisions occur from both sides of the ion while the ion is moving in one direction. Since the momentum transfer is defined by mΔv, the change in momentum (velocity) of the huge molecules by singular small gas molecule collisions is not isotropic. The ions should be slowed more than they are accelerated by singular collisions. We were not sure of the magnitude of the change in velocity but we thought that it may be possible to have the flight time of such large molecules perturbed by a few parts per million by collisions with background gas whose molecular weight is the parts per million range compared to the large molecular ions. If these collisions lead to the observed distortion of the peak shape from the red Gaussian distribution and limit the observed resolution, lowering the flight tube pressure in the 10−8 Torr range or lower should limit collisions. This pressure range is standard ultra high vacuum used in surface science measurements. It can easily be achieved.
Figure 9.
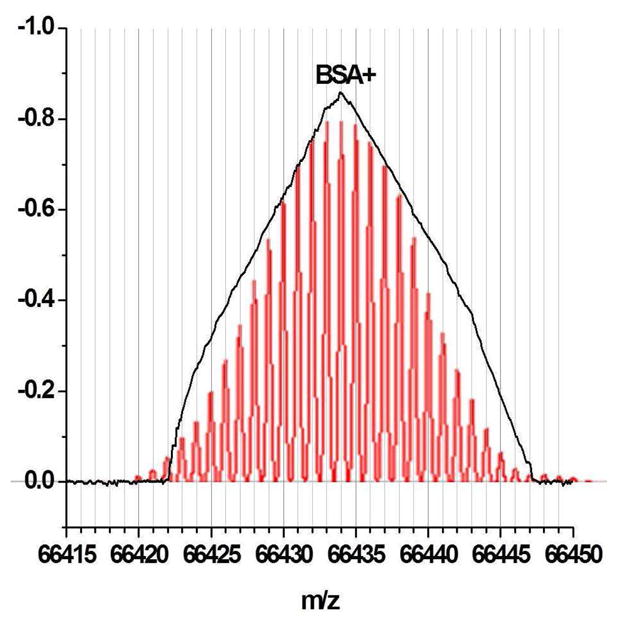
Reveals the expanded view of the BSA+ flight time distribution shown in Figure 2 (black line). The red plot depicts the isotope distribution of BSA calculated from sequence information. The mass scale was derived from the calibration. There are approximately 10 data points for every nominal mass unit. The peak of the distribution can be defined within 1 ns.
Another possibility for the distorted shape of the TOF distribution is noncovalent adduct formation. The distribution could be explained by the different conformers of BSA holding different numbers of solvent molecules, BSA-(H2O)n and BSA-(H2O)n+1 for example. Furthermore, we automatically assume that the hitchhiker is water because of its greater dipole moment. But it does not have to be, if the solvent is 50% methanol. BSA has 17 disulfide bonds to help maintain it in a folded configuration. This could conceivably create structures capable of binding methanol. A mixed distribution of BSA-methanol and BSA-H2O could also explain the distribution.
Analysis of other protein isotope distributions reveals shapes that are closer to the normal Gaussian distribution. These observed TOF distributions are very consistent and reproducible. Consequently, we are leaning toward heterogeneous solvent adduct formation to explain the shape of the distribution—at least in part. The other anomaly that we observe is the abrupt drop in ion intensity at the ends of the distribution. Heterogeneous adduct formation should yield a distribution that is a sum of Gaussians. The abrupt drop in ion intensity cannot be explained by adduct formation. The initial position and velocity distributions of the ions as they enter the TOF also cannot explain this departure either. We suspect that it is an artifact of the detector. Our detector is a Photonis BiPolar detector (Photonis USA, Sturbridge, MA). It consists of an electron multiplier channel plate in front of a scintillator followed by a photomultiplier tube for detection. However, given the physics of the signal generation process, we have been unable to determine a reason for the non-Gaussian distribution. More analysis is required to develop a concrete understanding of this phenomenon. However, one thing is abundantly clear from closeup analysis of the isotope distributions, if alkali adducts or any other chemical modifications of the proteins were present, we would see those changes reflected in the mass distribution.
Future Work
We plan to accurately calibrate the mass spectrometer with polydisperse gold and/or CsI nanoparticles to obtain an exact mass calibration. Since gold and CsI have only one stable isotopic, they should also provide an accurate mass resolution. Further experiments on the isotope distribution are planned. We will be changing solvents and performing deuterium exchange experiments looking for changes in the distributions and to define the number of adducted solvent molecules. If the number of associated solvent molecules can accurately be determined then these proteins can be used for accurate mass calibration because they consistently yield the same flight time to mass relationship.
The signal from the ions across the range of proteins has been observed to vary linearly with concentration. We have not yet determined the linear dynamic range of concentrations as a function of molecular mass as yet over the entire range but our results to date (some of which have been shown) suggest that it will be the same over the range of proteins. Other ionization methods that yield minimal charging such as atmospheric pressure chemical ionization are currently being explored. Once a robust and sensitive method of producing singly charged intact proteins has been demonstrated, concentration range measurements will be made as a function of mass and reported.
The ion handling techniques demonstrated here work equally well for multiply charged ions. We analyze singly-charged intact proteins first because we can, but secondly because there are other advantages besides the improvement of measurement precision. For example, because our technique works with singly-charged ions at such enormous values of m/z, protein complexes can be measured with much greater facility because charge repulsion will not limit and distort the complexes studied. This technique can be applied to the measurement of protein distributions or any other type of biological molecule or nanoparticle because the working range of the mass spectrometer has been expanded to include these analytes.
This work is a giant step toward the ability to rapidly and precisely quantify protein distributions because we will soon be able to accurately measure their mass without loss of sensitivity. Furthermore, we have shown that the quantity of one protein correlates with the others even with a change in the analysis conditions. Our next tasks are to define the concentration range over which quantitation is feasible and establish standard protein separation methodology before the introducing the proteins to the mass analyzer. These are minor steps that are obviously achievable given our current results and the literature. We will show that proteins in complex distributions can be rapidly quantified and that protein distributions can be directly compared with our mass analysis technique. Once completed, it will mark a seminal improvement in biological analysis. High resolution analysis in the ultra high mass range represents a large leap forward in the development of the ability to quantify the state of biological systems. With the work presented in this manuscript, the proof of principle for high resolution in the ultra high mass range is now complete. The range of the analyzer now fits the range of the analyte. The paradigm for biological mass analysis will now begin to change.
Acknowledgments
This research was sponsored by the National Institutes of Health, NIGMS, under Grant: R01 GM088501, the Washington State Life Sciences Discovery Fund (LSDF 08-01 2374880) and the National Institutes of Health (5R01CA140617-02). Peter Reilly wishes to acknowledge Professor Hideya Koizumi, Arkansas State University. He was instrumental in the development of this technology.
References
- 1.Karas M, Hillenkamp F. Analytical Chemistry. 1988;60:2299–2301. doi: 10.1021/ac00171a028. [DOI] [PubMed] [Google Scholar]
- 2.Fenn JB, Mann M, Meng CK, Wong SF, Whitehouse CM. Science. 1989;246:64–71. doi: 10.1126/science.2675315. [DOI] [PubMed] [Google Scholar]
- 3.Balogh MP. LC GC Europe. 2004;17:152–159. [Google Scholar]
- 4.Sobott F, Hernandez H, McCammon MG, Tito MA, Robinson CV. Analytical Chemistry. 2002;74:1402–1407. doi: 10.1021/ac0110552. [DOI] [PubMed] [Google Scholar]
- 5.Chernushevich IV, Thomson BA. Analytical Chemistry. 2004;76:1754–1760. doi: 10.1021/ac035406j. [DOI] [PubMed] [Google Scholar]
- 6.Cotter RJ, editor. Time-of-Flight Mass Spectrometry. American Chemical Society; Washington, DC: 1992. [Google Scholar]
- 7.Lee J, Reilly PTA. Analytical Chemistry. 2011;83:5831–5833. doi: 10.1021/ac201537b. [DOI] [PMC free article] [PubMed] [Google Scholar]
- 8.Koizumi H, Whitten WB, Reilly PTA. Journal of the American Society for Mass Spectrometry. 2010;21:242–248. doi: 10.1016/j.jasms.2009.10.009. [DOI] [PubMed] [Google Scholar]
- 9.Koizumi H, Whitten WB, Reilly PTA. Journal of the American Society for Mass Spectrometry. 2008;19:1942–1947. doi: 10.1016/j.jasms.2008.08.007. [DOI] [PubMed] [Google Scholar]
- 10.Lee J, Marino MA, Koizumi H, Reilly PTA. International Journal of Mass Spectrometry. 2011;304:36–40. doi: 10.1016/j.ijms.2011.03.011. [DOI] [PMC free article] [PubMed] [Google Scholar]
- 11.Takats Z, Cotte-Rodriguez I, Talaty N, Chen H, Cooks RG. Chemical Communications. 2005:1950–1952. doi: 10.1039/b418697d. [DOI] [PubMed] [Google Scholar]
- 12.Bacher G, Szymanski WW, Kaufman SL, Zollner P, Blaas D, Allmaier G. Journal of Mass Spectrometry. 2001;36:1038–1052. doi: 10.1002/jms.208. [DOI] [PubMed] [Google Scholar]
- 13.Chen DR, Pui DYH, Kaufman SL. Journal of Aerosol Science. 1995;26:963–977. [Google Scholar]
- 14.Kaufman SL. Journal of Aerosol Science. 1998;29:537–552. [Google Scholar]
- 15.Laschober C, Kaufman SL, Reischl G, Allmaier G, Szymanski WW. Journal of Nanoscience and Nanotechnology. 2006;6:1474–1481. doi: 10.1166/jnn.2006.308. [DOI] [PubMed] [Google Scholar]
- 16.Scalf M, Westphall MS, Krause J, Kaufman SL, Smith LM. Science. 1999;283:194–197. doi: 10.1126/science.283.5399.194. [DOI] [PubMed] [Google Scholar]
- 17.Huang L, Paiva A, Bhat R, Wong M. Journal of the American Society for Mass Spectrometry. 1996;7:1219–1226. doi: 10.1016/S1044-0305(96)00102-X. [DOI] [PubMed] [Google Scholar]
- 18.Tolmachev AV, Robinson EW, Wu S, Pasa-Tolic L, Smith RD. International Journal of Mass Spectrometry. 2009;287:32–38. doi: 10.1016/j.ijms.2008.10.010. [DOI] [PMC free article] [PubMed] [Google Scholar]
- 19.Liu T, Nedrow-Byers JR, Hopkins MR, Wu LY, Lee J, Reilly PTA, Berkman CE. Chemical Biology. 2011 manuscript in preparation. [Google Scholar]


