Abstract
A full description of the human proteome relies on the challenging task of detecting mature and changing forms of protein molecules in the body. Large scale proteome analysis1 has routinely involved digesting intact proteins followed by inferred protein identification using mass spectrometry (MS)2. This “bottom up” process affords a high number of identifications (not always unique to a single gene). However, complications arise from incomplete or ambiguous2 characterization of alternative splice forms, diverse modifications (e.g., acetylation and methylation), and endogenous protein cleavages, especially when combinations of these create complex patterns of intact protein isoforms and species3. “Top down” interrogation of whole proteins can overcome these problems for individual proteins4,5, but has not been achieved on a proteome scale due to the lack of intact protein fractionation methods that are well integrated with tandem MS. Here we show, using a new four dimensional (4D) separation system, identification of 1,043 gene products from human cells that are dispersed into >3,000 protein species created by post-translational modification, RNA splicing, and proteolysis. The overall system produced >20-fold increases in both separation power and proteome coverage, enabling the identification of proteins up to 105 kilodaltons and those with up to 11 transmembrane helices. Many previously undetected isoforms of endogenous human proteins were mapped, including changes in multiply-modified species in response to accelerated cellular aging (senescence) induced by DNA damage. Integrated with the latest version of the Swiss-Prot database6, the data provide precise correlations to individual genes and proof-of-concept for large scale interrogation of whole protein molecules. The technology promises to improve the link between proteomics data and complex phenotypes in basic biology and disease research7.
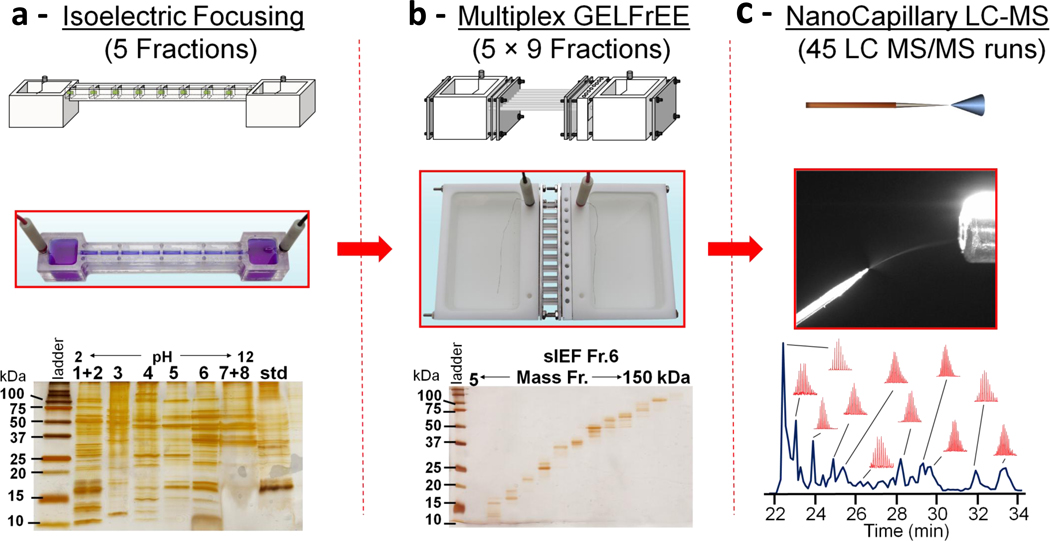
Effective fractionation8-10 is critical for sample handling prior to MS-based proteomics. To date, no fractionation procedure for intact proteins can match the resolution of two-dimensional gel electrophoresis (2D gels). Here we use a liquid phase alternative to 2D gels that bypasses both their low recovery and extensive workup steps prior to MS11. This procedure for two-dimensional liquid electrophoresis (2D-LE)12 is comprised of solution isoelectric focusing (sIEF) followed by gel-eluted liquid fraction entrapment electrophoresis (GELFrEE)13 for fractionation by protein isoelectric point and size, respectively (Fig. 1a,b). Combining these with nanocapillary liquid chromatography and mass spectrometry (LC-MS) (Fig. 1c) for both low14 and high molecular weight proteins15 results in an overall 4D separation of whole protein molecules prior to ion fragmentation by tandem MS and protein identification.
Figure 1.
Schematic of the four dimensional (4D) platform for high resolution fractionation of protein molecules. Schematics (top) and photographs (middle) are shown for (a) a custom device for solution isoelectric focusing (sIEF), (b) a custom device for multiplexed gel eluted liquid fraction entrapment electrophoresis (mGELFrEE), and (c) reversed phase chromatography (RPLC) coupled t o M S. Representative 1D gels of fractions collected from the two electrophoretic devices are shown below their pictures; note the resolution attainable at the level of intact proteins. The combined resolution of RPLC with Fourier-Transform Mass Spectrometry (FTMS) is depicted by the chromatogram along with selected isotopic distributions for protein ions measured during the run.
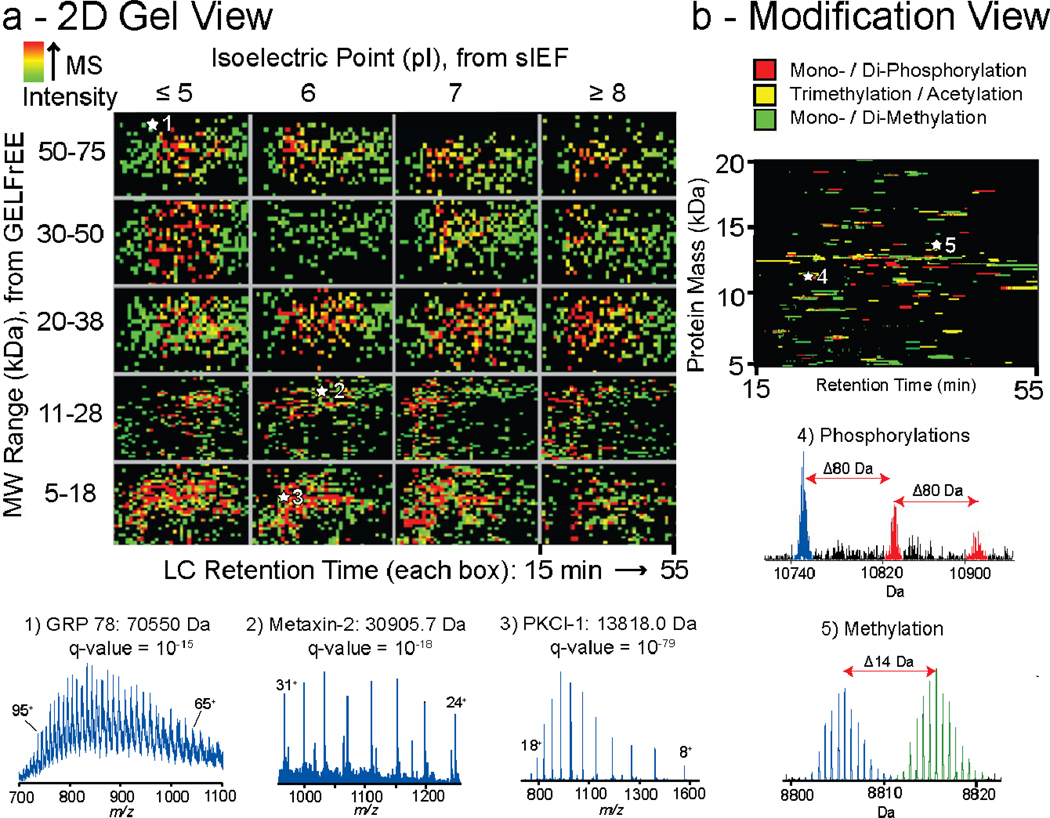
Using the 4D platform described above, we generated a quasi-2D gel perspective of the human proteome with extremely high molecular detail (Fig. 2a) from individual replicate analyses of nuclear and cytosolic extracts of HeLa S3 cells (Supplementary Fig. 1). In discovery mode, the IEF-GELFrEE-nanocapillary LC platform used 0.5 - 1 mg of input protein and provided a peak capacity of well over 2,000 for separation of protein molecules in solution. Considering the separation power of the mass spectrometer, the peak capacity of the 4D system is >100,000 for proteins below ~25 kDa (Supplementary Information). This is 20-fold higher than the peak capacity for high resolution 2D gels (<5,000). Identification and characterization of isoforms were achieved using fragmentation data acquired with <10 part-per-million mass accuracy for searching databases with highly annotated primary sequences16. Using tailored software17, we overcame the “protein inference problem” where identification ambiguity results when isoforms (e.g., from members of a gene family or alternative splicing) produce many identical tryptic peptides2,18. The databases and search engine used here are fully compatible with the UniProt flat file format and enable a deep consideration of known post-translational modifications (PTMs), alternative splice variants, polymorphisms, endogenous proteolysis, and diverse combinations of all these sources of molecular variation at the protein level16. Together with the careful curation of the Swiss-Prot database6, the result is an informatics framework that maps each given protein identification to a single gene (except in rare cases like ubiquitin where multiple genes can produce the identical sequence). Extended details on statistical analysis are provided in the Methods section.
Figure 2.
Two visual representations of proteome-scale runs. (a) The heat map is generated from combined 4D runs of nuclear and cytosolic extracts. Intact mass and pI values are indicated on the y-axis and x-axis respectively. Each box in the grid displays total ion chromatograms from LC runs of 2D-LE fractions plotted as time vs. neutral intact mass. The MS intensity is indicated by color (legend on top left). Representative precursor scans were extracted from the heat map for ESI-MS spectra of high (1), medium (2), and low (3) mass proteins, along with their identifications from online fragmentation (insets at bottom). (b) Plot created from selective display of protein pairs with mass differences consistent with acetylation (yellow), phosphorylation (red), and methylation (green), with three and two protein species shown as examples in insets (4) and (5), respectively.
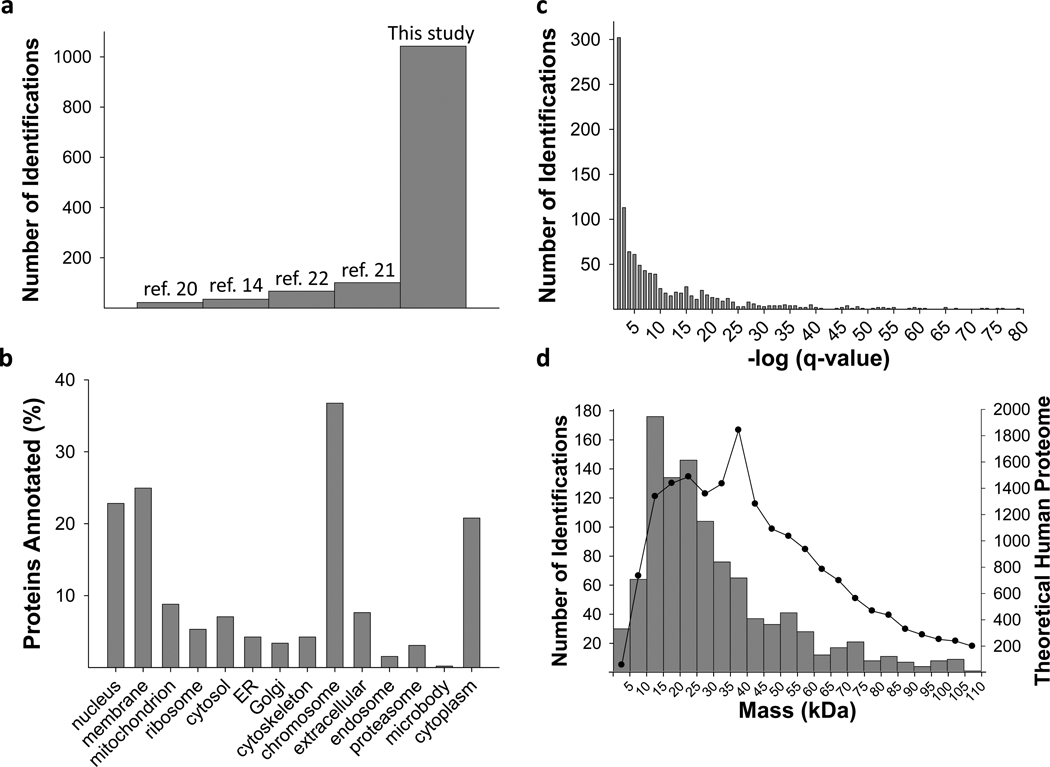
A total of 1043 proteins were identified with unique Swiss-Prot accession numbers in this study (Supplementary Table 1). These identifications originate from 1,045 human genes, 77% of whose protein products displayed N-terminal acetylation. The distribution of q-values, which indicates the confidence of protein identifications (see Methods), is shown in Fig. 3c. This level of proteome coverage represents the most comprehensive implementation of top down MS to date, with a ~10 fold increase in identifications of intact proteins for any microbial system19-21 and a >20 fold increase over any prior work in mammalian cells14,22 (Fig. 3a). In addition, fragmentation evidence for 3,093 protein isoforms/species was captured in this initial report (Supplementary Table 1), with PTMs detected as follows: 645 phosphorylations, 538 lysine acetylations, 158 methylations, 19 lipid/terpenes, and 5 hypusines. Over 400 species were attributed to core histones alone. Comparisons of predicted protein hydrophobicity and isoelectric point showed minimal bias versus that expected for the human proteome (Supplementary Fig. 2).
Figure 3.
Proteome analysis metrics associated with this study. (a) Graph showing the striking increase in identifications from previous studies achieved in archaeal, bacterial, yeast or human systems. (b) A gene ontology analysis for the identifications in this study. (c) Histogram showing the distribution of q-values for the identified proteins. (d) Plot showing the molecular weight distribution for the unique identifications obtained. The line graph depicts the theoretical molecular weight distribution for the human proteome (Swiss-Prot, Homo sapiens, 20223 entries).
Using an orthogonal method to detect PTMs based on intact mass values17, we detected pairs of protein species showing characteristic mass differences (Fig. 2b). For proteins <20 kDa, 225 pairs showed mass differences consistent within 0.05 Da with mono-methylation, 185 with di-methylation, and 122 with tri-methylation/acetylation. Other mass differences revealed 87 cases consistent with double acetylation, 140 with mono-phosphorylation, and 100 with di-phosphorylation events (Fig. 2b). Using this set of mass differences on the entire HeLa data set for all isotopically-resolved proteins, a total of 2,130 such mass shifts were found.
Complete characterization of a protein requires the theoretical and experimental mass values to match within error. For the 1,043 proteins identified, 431 and 331 were identified with intact mass information from either isotope spacings or deconvolution of charge states, respectively. Of these data, 54% of the isotopically-resolved proteins matched the species identified from the database within 2 Da (Supplementary Fig. 3a). Likewise, 130 of 331 of the masses determined by deconvolution were manually determined to be of high quality and 51% of these matched within 200 Da (Supplementary Fig. 3b). The protein species outside these windows are clearly identified by fragmentation, but harbor unexplained mass discrepancies (Δm’s) at this time. The complete explanation of Δm’s in the human proteome motivates future refinements in data acquisition to obtain enough MS/MS information on all the protein isoforms/species.
Major functional differences can exist among protein isoforms in a family, making their precise identification a major boost in the information content of proteomic analyses in higher eukaryotes. An intact protein mass and matching fragment ions from both termini are usually sufficient to accomplish a gene-specific identification4,17. Here, 9 of the ~15 isoforms of histone H2A were fully characterized in an automated fashion despite their >95% sequence identity (including the H2A.Z and H2A.X variants) with an additional three having Δm’s >1 Da (H2A type 1-D, 2-C, and 2-B). Also identified were nine S100 proteins, several alpha and beta tubulins, 7 unique isoforms of human keratin (a widely known contaminant in proteomics), MLC20, BTF3, and their related sequences (which are 97% and 81% identical, respectively Supplementary Fig. 4 and 5), and over 100 isoforms/species from the HMG family (e.g., Fig. 4). Significant improvements for top down proteomics in discovery mode were made for proteins in the 40–110 kDa range (Fig. 3d), including extensive characterization of GRP78, a 70.6 kDa heat shock protein (>12 fragment ions mapping to each terminus, Supplementary Fig. 6), and identification of several proteins >90 kDa, such as P33991 and Q14697 at 97 and 104 kDa, respectively (Supplementary Table 2).
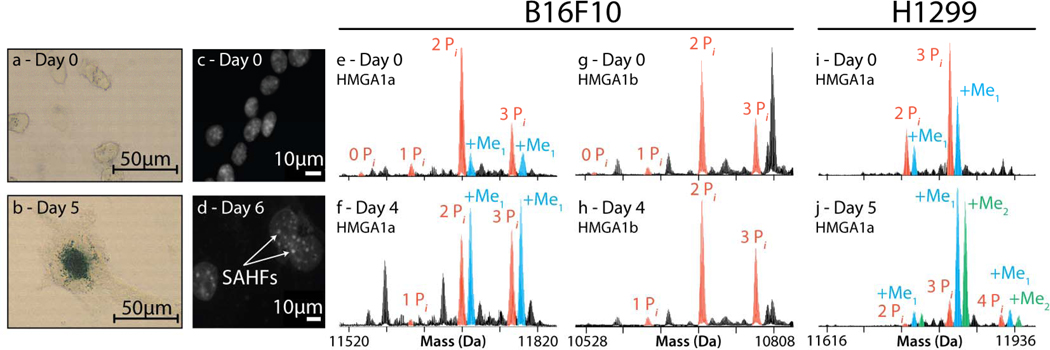
Figure 4.
Monitoring dynamics of HMGA1 isoforms during senescence in B16F10 and H1299 cells. After induction of DNA damage by transient treatment with camptothecin for H1299 cells or etoposide for B16F10, progression of accelerated senescence was monitored by SA-β-Gal (a–b) or DAPI staining (c-d) over the specified recovery period. Changes in modification profiles on HMGA1a (e–f) and HMGA1b (g–h) from B16F10 showed mild increases in phosphorylation occupancy but a significant increase in methylation levels on multiply-phosphorylated species. A more striking increase in both methylation and phosphorylation was observed in senescent H1299 cells (i–j). No such methylations were observed in the HMGA1b profiles for either cell line.
Since the 2D-LE platform makes use of SDS extensively, we anticipated reduced bias against integral membrane proteins. In all, 32% of the 1,043 total identifications from HeLa cells were membrane-associated proteins (GO:0016020), with 62% of these annotated as integral membrane proteins (GO:0016021, Supplementary Table 4). A more focused study of a mitochondrial membrane fraction (see Methods) used chromatographic procedures modified for enhanced separation of membrane proteins. We identified an additional 46 integral membrane proteins (Supplementary Table 3) from a single 3D experiment (no isoelectric focusing). Detailed inspection of the species that eluted from the column during LC-MS revealed proteins with a distribution of 1–11 transmembrane helices (Supplementary Table 3). This shows a broad applicability of this study and will drive further efforts to detect full-length isoforms of membrane proteins23.
As part of our study of the HeLa proteome, cells were treated with etoposide to elicit the DNA damage response (see Methods), followed by 4D fractionation and top down tandem MS. Using Gene Ontology (GO) analysis, we annotated all 4D identifications according to cell compartment (Fig. 3b) or biological process (Supplementary Fig. 7). Many proteins detected were involved in cell cycle regulation and apoptosis, including nine that interact with PCNA during repair of DNA damage (Supplementary Fig. 8). Also, several proteins involved in the Fanconi anemia pathway were identified including FANCE, RAD51AP1, RAD23B, and RPA3, with the latter two completely characterized (Supplementary Table 5). Several CDK inhibitors were found, such as p27Kip1 (CDKN1B) and p16INK4a (CDKN2A), T53G1, and the protein product from a target gene of p53 (Q9Y2A0, p53-activated protein 1).
Using the 3D fractionation approach (i.e., GELFrEE-nanocapillary LC-MS) to readout phosphorylation stoichiometry with high fidelity (Supplementary Information and Supplementary Fig. 9), we monitored 17 phosphoprotein targets across three time points at three different concentrations of etoposide (Supplementary Table 6). We found increases in the occupancy of phosphorylation in H2A.X-pSer139 (γH2A.X) after treatment with 25 µM or 100 µM etoposide for 1 h (Supplementary Fig. 10). After a 24 h recovery from treatment, a return to basal levels of phosphorylation of γH2A.X was found, consistent with engagement of the DNA-repair machinery24. Further, we observed a strong correlation between the phosphorylation stoichiometry of γH2A.X determined by MS with the results from immunofluorescence and western blotting run in parallel (Supplementary Fig. 10a–c).
In separate studies we tracked over 2,300 species (from 690 proteins) in H1299 cells (Supplementary Table 7) and 2,300 species (from 708 proteins) in B16F10 melanoma cells (Supplementary Table 8) in the days after a 24 h treatment with camptothecin or 5 h of etoposide, respectively, using only the 3D fractionation approach. After induction of DNA-damage, we also monitored the classic hallmarks of stress-induced senescence in H129925 and B16F1026 over several days (Supplementary Fig. 11a–c), including cell enlargement and formation of Senescence Associated Heterochromatic Foci (SAHFs) (Supplementary Fig. 11d–f). While levels of γH2A.X remained the same as in control cells, a striking upregulation in methylated forms of di- and tri-phosphorylated HMGA1a, but not of its splice variant HMGA1b was observed as both B16F10 and H1299 cells entered stress-induced senescence (Fig. 4 and Supplementary Fig. 11g–l).
Full descriptions of the fragmentation data for two multiply-modified species of HMGA1 are presented in Supplementary Fig. 12. In mapping these species, the hierarchy of phosphorylations on HMGA1a was determined for control cells to be Ser101 and Ser102 occupied in the 2 Pi form and evidence for the third site pointing predominantly toward pSer98. The 3Pi and 4Pi forms both showed some occupancy for pSer43 (data not shown), a site only available in the splice region specific to the HMGA1a variant (Supplementary Fig. 12). For day 5 in senescent H1299 cells, the effect on methylation was particularly dramatic, with both the mono- and di-methylated species (also harboring multiple phosphorylations) reproducibly increased to be >80% of the total signal for species from the hmga1 gene (Fig. 4 and see Supplementary Fig. 13 for biological replicates). The methylation site was localized precisely to Arg25 (Supplementary Fig. 12), consistent with prior work on HMGA1 proteins27. A similar response for methylated HMGA species has been observed in damaged cancer cells undergoing apoptosis27,28 but the B16F10 and H1299 cells prepared here were clearly senescent as measured by Annexin V staining and FACS analysis through day 6 (data not shown). As Arg25 is in the first AT-hook DNA-binding region (residues 21–31), it is possible that the R25me1 and R25me2 marks perturb DNA-kinking and allows HMGA1a to be preferentially incorporated into SAHFs29 during accelerated cellular senescence. Other changes in bulk chromatin were also notable, such as hypoacetylation on all core histones, increased levels of H3.2K27me2/3, and decreased H3.2K36me3.
The sharp increase in proteome coverage demonstrated here provides a path ahead for interrogating the natural complexity of protein primary structures that exist within human cells and tissues. Since this is the first time top down proteomics has been achieved at this scale, an early glimpse at the prevalence of uncharacterized mass shifting events has been revealed in the human proteome. With faithful mapping of intact isoforms on a proteomic scale, detecting covariance in modification patterns will help lay bare the post-translational logic of intracellular signaling. Also, proper speciation of protein molecules offers the promise of increased efficiency for biomarker discovery through stronger correlations between measurements and organismal phenotype (e.g., a particular isoform of apolipoprotin C-III and HDL/LDL levels in human blood7). Technology for intact protein characterization could also become a central approach to focus an analogous effort to the human genome project – to provide a definitive description of protein molecules present in the human body30.
Methods Summary
For large scale global analysis, HeLa S3 cells were prefractionated using custom 2D-LE platform, comprised of sIEF coupled to multiplexed GELFrEE12,13. HeLa S3, H1299, B16F10 cells, and mitochondrial membrane proteins were also fractionated using the custom GELFrEE13 device alone (no sIEF). After separation, detergent and salt were removed, and the fractions were injected into nanocapillary RPLC columns for elution into a 12 Tesla LTQ FTMS for online detection and fragmentation14,15. The MS RAW files were processed with in-house software called crawler to assign masses. Using this program, determination of both the intact masses and the corresponding fragment masses were performed and these data were searched against a human proteome database. Extensive statistical workups were also performed using several FDR estimation approaches (with decoy databases both concatenated and not). A final q-value procedure is described in detail (Methods), with the data above reported using a 5% instantaneous FDR (i.e., q-value) cutoff at the protein level (Supplementary Fig. 14).
Supplementary Material
Acknowledgements
We would like to thank all members of the group who contributed to development of top down mass spectrometry over the years along with several private foundations: The Searle Scholars Program, The Burroughs Wellcome Fund, The David and Lucile Packard Foundation, The Richard and Camille Dreyfus Foundation, and The Chicago Biomedical Consortium with support from The Searle Funds at The Chicago Community Trust. We further acknowledge the Department of Chemistry at the University of Illinois, the Institute on Drug Abuse (DA 018310), the Institute for General Medical Sciences at the National Institutes of Health (GM 067193-08), and the National Science Foundation (DMS 0800631), whose combined investment in basic research over the past decade made this work possible. We dedicate this work in fond memory of Jonathan Widom.
Footnotes
Full Methods and any associated references are available in the online version of the paper at www.nature.com/nature.
Supplementary Information is linked to the online version of the paper at www.nature.com/nature.
Author Contributions
Project Design: J.C.T., L.Z., P.M.T., N.L.K. Cell Culture and Biology: J.C.T., J.E.L., A.D.C., D.R.A., M.L., C.W., S.M.M.S., N.S. Separations: J.C.T., J.E.L., A.D.C., D.R.A. Mass Spectrometry: J.C.T., J.E.L., A.D.C., D.R.A., J.D.T., A.V., J.F.K., P.D.C. Data Analysis and Statistics: J.C.T., L.Z., K.R.D., B.P.E., R.D.L., P.M.T., N.L.K. Writing: J.C.T., N.L.K.
Author Information Reprints and permissions information is available at www.nature.com/reprints. The authors declare competing financial interests as some components of the separations and software are available commercially. Readers are welcome to comment on the online version of this article at www.nature.com/nature.
References
- 1.Wisniewski JR, Zougman A, Nagaraj N, Mann M. Universal sample preparation method for proteome analysis. Nat. Methods. 2009;6:359–362. doi: 10.1038/nmeth.1322. [DOI] [PubMed] [Google Scholar]
- 2.Nesvizhskii AI, Aebersold R. Interpretation of shotgun proteomic data: the protein inference problem. Mol. Cell. Proteomics. 2005;4:1419–1440. doi: 10.1074/mcp.R500012-MCP200. [DOI] [PubMed] [Google Scholar]
- 3.Schluter H, Apweiler R, Holzhutter HG, Jungblut PR. Finding one's way in proteomics: a protein species nomenclature. Chem. Cent. J. 2009;3(11) doi: 10.1186/1752-153X-3-11. [DOI] [PMC free article] [PubMed] [Google Scholar]
- 4.Boyne MT, Pesavento JJ, Mizzen CA, Kelleher NL. Precise characterization of human histories in the H2A gene family by top down mass spectrometry. J. Proteome Res. 2006;5:248–253. doi: 10.1021/pr050269n. [DOI] [PubMed] [Google Scholar]
- 5.Ge Y, Rybakova IN, Xu QG, Moss RL. Top-down high-resolution mass spectrometry of cardiac myosin binding protein C revealed that truncation alters protein phosphorylation state. Proc. Natl. Acad. Sci. U.S.A. 2009;106:12658–12663. doi: 10.1073/pnas.0813369106. [DOI] [PMC free article] [PubMed] [Google Scholar]
- 6.Nilsson T, et al. Mass spectrometry in high-throughput proteomics: ready for the big time. Nat. Methods. 2010;7:681–685. doi: 10.1038/nmeth0910-681. [DOI] [PubMed] [Google Scholar]
- 7.Mazur MT, et al. Quantitative analysis of intact apolipoproteins in human HDL by top-down differential mass spectrometry. Proc. Natl. Acad. Sci. U.S.A. 2010;107:7728–7733. doi: 10.1073/pnas.0910776107. [DOI] [PMC free article] [PubMed] [Google Scholar]
- 8.Righetti PG, Castagna A, Antonioli P, Boschetti E. Prefractionation techniques in proteome analysis: the mining tools of the third millennium. Electrophoresis. 2005;26:297–319. doi: 10.1002/elps.200406189. [DOI] [PubMed] [Google Scholar]
- 9.Wang H, et al. Intact-protein-based high-resolution three-dimensional quantitative analysis system for proteome profiling of biological fluids. Mol. Cell. Proteomics. 2005;4:618–625. doi: 10.1074/mcp.M400126-MCP200. [DOI] [PubMed] [Google Scholar]
- 10.Capriotti AL, Cavaliere C, Foglia P, Samperi R, Laganà A. Intact protein separation by chromatographic and/or electrophoretic techniques for top-down proteomics. J. Chromatogr. A. doi: 10.1016/j.chroma.2011.05.094. In Press. [DOI] [PubMed] [Google Scholar]
- 11.Gygi SP, Corthals GL, Zhang Y, Rochon Y, Aebersold R. Evaluation of two-dimensional gel electrophoresis-based proteome analysis technology. Proc. Natl. Acad. Sci. U.S.A. 2000;97:9390–9395. doi: 10.1073/pnas.160270797. [DOI] [PMC free article] [PubMed] [Google Scholar]
- 12.Tran JC, Doucette AA. Multiplexed size separation of intact proteins in solution phase for mass spectrometry. Anal. Chem. 2009;81:6201–6209. doi: 10.1021/ac900729r. [DOI] [PubMed] [Google Scholar]
- 13.Tran JC, Doucette AA. Gel-eluted liquid fraction entrapment electrophoresis: an electrophoretic method for broad molecular weight range proteome separation. Anal. Chem. 2008;80:1568–1573. doi: 10.1021/ac702197w. [DOI] [PubMed] [Google Scholar]
- 14.Lee JE, et al. A robust two-dimensional separation for top-down tandem mass spectrometry of the low-mass proteome. J. Am. Soc. Mass Spectrom. 2009;20:2183–2191. doi: 10.1016/j.jasms.2009.08.001. [DOI] [PMC free article] [PubMed] [Google Scholar]
- 15.Vellaichamy A, et al. Size-sorting combined with improved nanocapillary liquid chromatography-mass spectrometry for identification of intact proteins up to 80 kDa. Anal. Chem. 2010;82:1234–1244. doi: 10.1021/ac9021083. [DOI] [PMC free article] [PubMed] [Google Scholar]
- 16.Roth MJ, et al. Precise and parallel characterization of coding polymorphisms, alternative splicing, and modifications in human proteins by mass spectrometry. Mol. Cell. Proteomics. 2005;4:1002–1008. doi: 10.1074/mcp.M500064-MCP200. [DOI] [PMC free article] [PubMed] [Google Scholar]
- 17.Durbin KR, et al. Intact mass detection, interpretation, and visualization to automate top down proteomics on a large scale. Proteomics. 2010;10:3589–3597. doi: 10.1002/pmic.201000177. [DOI] [PMC free article] [PubMed] [Google Scholar]
- 18.Duncan MW, Aebersold R, Caprioli RM. The pros and cons of peptide-centric proteomics. Nat. Biotechnol. 2010;28:659–664. doi: 10.1038/nbt0710-659. [DOI] [PubMed] [Google Scholar]
- 19.Bunger MK, Cargile BJ, Ngunjiri A, Bundy JL, Stephenson JLJ. Automated proteomics of E. coli via top-down electron-transfer dissociation mass spectrometry. Anal. Chem. 2008;80:1459–1467. doi: 10.1021/ac7018409. [DOI] [PubMed] [Google Scholar]
- 20.Parks BA, et al. Top-down proteomics on a chromatographic time scale using linear ion trap fourier transform hybrid mass spectrometers. Anal. Chem. 2007;79:7984–7991. doi: 10.1021/ac070553t. [DOI] [PMC free article] [PubMed] [Google Scholar]
- 21.Patrie SM, et al. Top Down Mass Spectrometry of <60-kDa Proteins from Methanosarcina acetivorans using quadrupole FTMS with automated octopole collisionally activated dissociation. Mol. Cell. Proteomics. 2006;5:14–25. doi: 10.1074/mcp.M500219-MCP200. [DOI] [PubMed] [Google Scholar]
- 22.Roth MJ, Parks BA, Ferguson JT, Boyne MTI, Kelleher NL. "Proteotyping": Population proteomics of human leukocytes using top down mass spectrometry. Anal. Chem. 2008;80:2857–2866. doi: 10.1021/ac800141g. [DOI] [PMC free article] [PubMed] [Google Scholar]
- 23.Gomez SM, Nishio JN, Faull KF, Whitelegge JP. The chloroplast grana proteome defined by intact mass measurements from liquid chromatography mass spectrometry. Mol. Cell. Proteomics. 2002;1:46–59. doi: 10.1074/mcp.m100007-mcp200. [DOI] [PubMed] [Google Scholar]
- 24.Matsuoka S, et al. ATM and ATR substrate analysis reveals extensive protein networks responsive to DNA damage. Science. 2007;316:1160–1166. doi: 10.1126/science.1140321. [DOI] [PubMed] [Google Scholar]
- 25.Roberson RS, Kussick SJ, Vallieres E, Chen SY, Wu DY. Escape from therapy-induced accelerated cellular senescence in p53-null lung cancer cells and in human lung cancers. Cancer Res. 2005;65:2795–2803. doi: 10.1158/0008-5472.CAN-04-1270. [DOI] [PubMed] [Google Scholar]
- 26.Yawata T, et al. Identification of a <= 600-kb region on human chromosome 1q42.3 inducing cellular senescence. Oncogene. 2003;22:281–290. doi: 10.1038/sj.onc.1206143. [DOI] [PubMed] [Google Scholar]
- 27.Sgarra R, et al. During apoptosis of tumor cells HMGA1a protein undergoes methylation: identification of the modification site by mass spectrometry. Biochemistry. 2003;42:3575–3585. doi: 10.1021/bi027338l. [DOI] [PubMed] [Google Scholar]
- 28.Sgarra R, et al. The AT-hook of the chromatin architectural transcription factor high mobility group A1a is arginine-methylated by protein arginine methyltransferase 6. J. Biol. Chem. 2006;281:3764–3772. doi: 10.1074/jbc.M510231200. [DOI] [PubMed] [Google Scholar]
- 29.Narita M, et al. A novel role for high-mobility group A proteins in cellular senescence and heterochromatin formation. Cell. 2006;126:503–514. doi: 10.1016/j.cell.2006.05.052. [DOI] [PubMed] [Google Scholar]
- 30.Service RF. Proteomics ponders prime time. Science. 2008;321:1758–1761. doi: 10.1126/science.321.5897.1758. [DOI] [PubMed] [Google Scholar]
Associated Data
This section collects any data citations, data availability statements, or supplementary materials included in this article.


