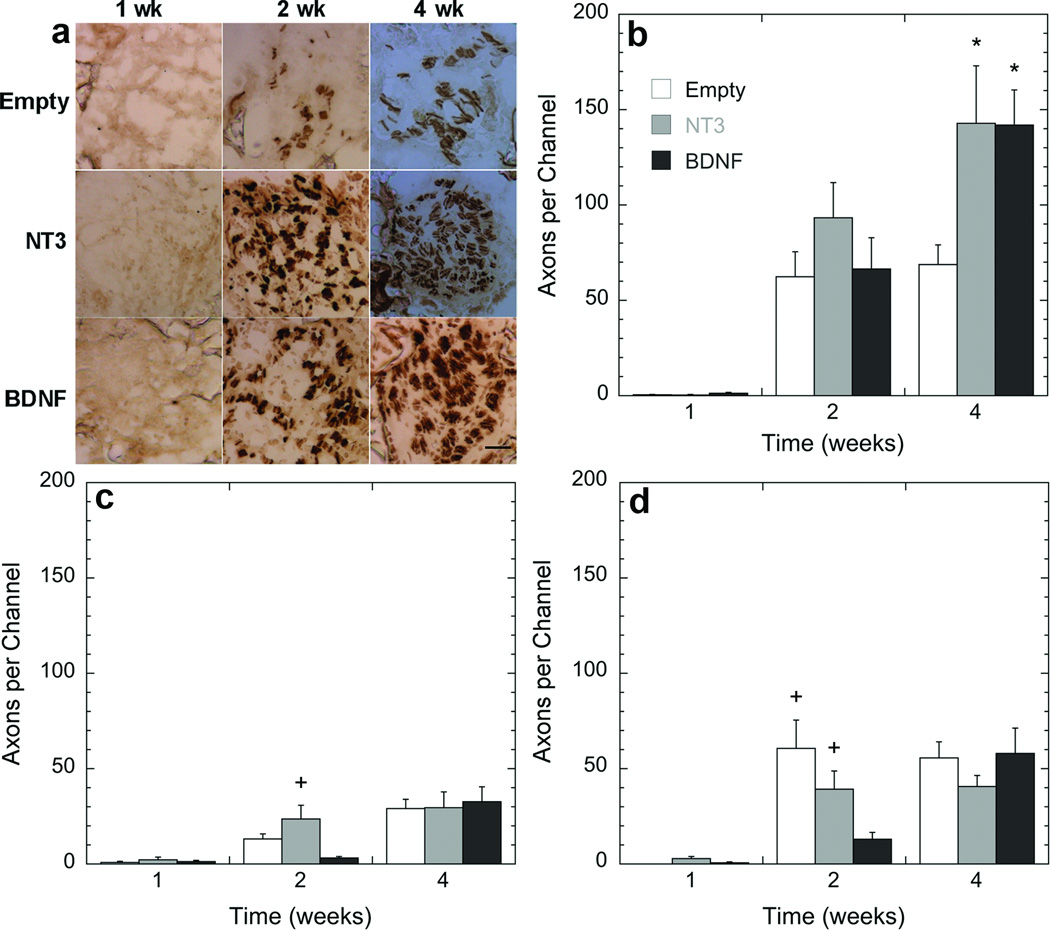
Figure 5. Quantification of axonal regeneration as a function of time and position within the bridges.
(a) Time course of a single channel at the rostral position. (b-d) Axons were quantified by counting the number of NF200 positive neurofilaments inside the channels. Slides analyzed were selected from the (b) rostral (300 µm), (c) middle (2000 µm), and (d) caudal (3500 µm) regions of the bridge. Statistical analysis was done by an ANOVA with Tukey post hoc test with a p<0.05 found to be significant differently. *, significant difference compared to empty at the same time point; +, significant difference compared to BDNF at the same time point). Scale bar in a is 50 µm.

