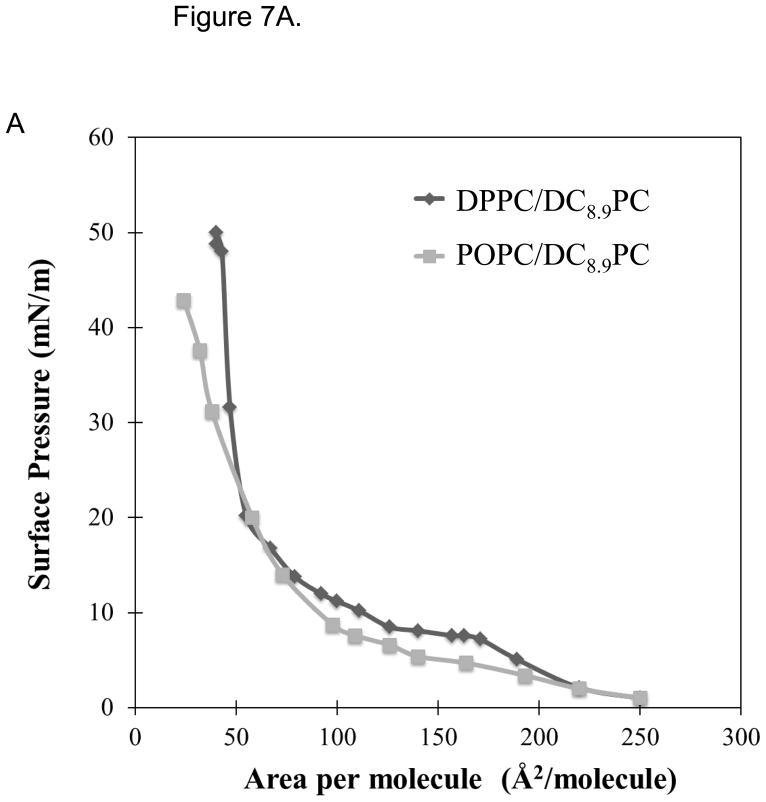
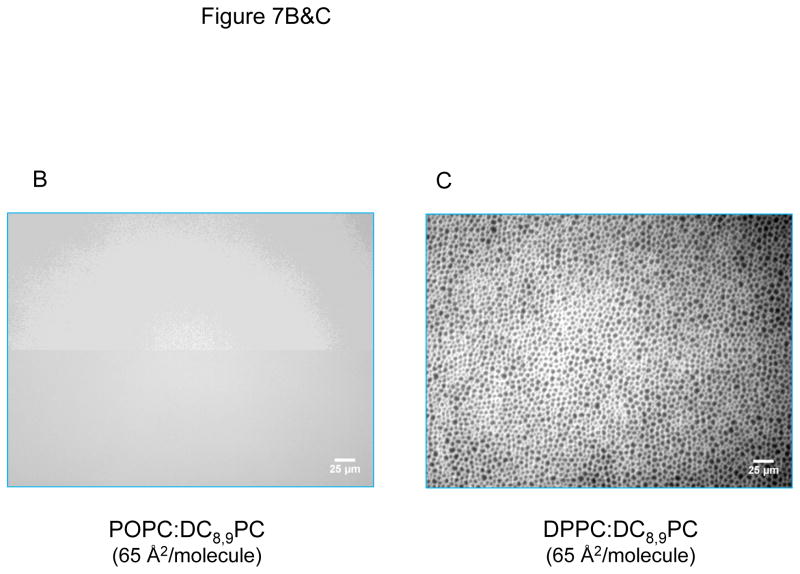
Figure 7.
DC8,9PC clustering analysis in lipid monolyers. (A) Compression isotherms of DPPC/DC8,9PC and POPC/DC8,9PC (both 90:10 mole ratio) at room temperature. The plateau region on DPPC/DC8,9PC is an indicator of phase coexistence in the monolayer. Fluorescence micrographs of both monolayers (B) POPC/DC8,9PC and (C) DPPC/DC8,9PC. Phase separation exists only in (C), where the fluorescence areas are formed by the partition of the fluorescence probe N-Rh-PE into the more disordered phase.


