Abstract
Background
The incidence of patients with lower extremity injuries presenting to emergency departments in the United States with respect to specific anatomic regions and disease categories is unknown. Such information might be used for injury prevention, resource allocation, and training priorities.
Questions/purposes
We determined the anatomic regions, disease categories, and circumstances that account for the highest incidence of leg problems among patients presenting to emergency departments in the United States.
Methods
We used the National Electronic Injury Surveillance System (NEISS) to obtain a probability sample of all lower extremity injuries treated at emergency departments during 2009. A total of 119,815 patients who presented to emergency departments with lower extremity injuries in 2009 were entered in the NEISS database. Patient and injury characteristics were analyzed. Incidence rates for various regions, disease categories, injuries, and age groups were calculated using US census data.
Results
We identified 112 unique combinations of disease categories and anatomic regions. Strains and sprains accounted for 36% of all lower extremity injuries. The injury with the greatest incidence was an ankle sprain (206 per 100,000; 95% confidence interval, 181–230). Younger patients were more likely to have ankle sprains, foot contusions/abrasions, and foot strains/sprains. Older patients were more likely to have lower trunk fractures and lower trunk contusions/abrasions. The most common incidence for injury was at home (45%).
Conclusions
Given relatively low-acuity leg problems such as strains and sprains account for a substantial number of emergency department visits pertaining to leg problems, use of telephone triage, scheduled same or next-day urgent care appointments, and other alternatives to the traditional emergency room might result in better use of emergency healthcare resources.
Introduction
According to the National Hospital Ambulatory Medical Care Survey of the approximately 117 million visits to emergency departments in the United States in 2007, 14.6% were for lower extremity injuries [10], but this report provided no additional details regarding the injuries. More detailed characterization of leg problems that bring patients to emergency departments would inform public health measures such as injury prevention, resource allocation, and training priorities.
The US Consumer Product Safety Commission’s (CPSC) NEISS database is a probability sample of emergency departments with data keyed directly into personal computers by staff at the participating hospitals. The 100 participating hospitals have varied geographic locations and are grouped in five strata, four representing hospital emergency departments of different sizes (small, medium, large, very large) and a fifth representing emergency departments from children’s hospitals. The CPSC creates a new sampling frame each year. This frame lists all hospitals with emergency departments in the United States and its territories and includes the annual number of emergency department visits. By assuring the hospitals are appropriately adjusted to required specifications, the sampling frame is used to ratio-adjust the statistical weights for the current NEISS hospital sample to the total number of emergency department visits. Data are accessible to all through the CPSC Web site, which also provides a description of utilization and an explanation of background [13, 17, 18]. The NEISS provides data on anatomic site, disease category, age, and circumstance of injury [18].
We analyzed the NEISS data to determine: (1) the regions and disease categories that accounted for the greatest incidence of leg problems that sent patients to emergency departments in the United States in 2009; (2) the age groups of patients that accounted for the largest portion of the 10 injuries with the highest incidence; (3) the incidence of injuries by location or circumstances where the injury occurred; and (4) the consistency of annual incidence rates year-to-year from 2000 to 2009 for the four most common injuries, and all fractures by anatomic region.
Materials and Methods
We analyzed all presentations of patients with lower extremity injuries to an emergency department between January 1, 2009, and December 31, 2009. There were 119,815 reports of lower extremity injuries in the NEISS for 2009, including 62,368 injuries in males (52%) and 57,428 in females (48%). Gender was not recorded for patients with 19 injuries. Incidence rates were calculated using the combination of estimates of total numbers of lower extremity injuries by region and disease category in the United States calculated according to the NEISS methodology and population data from the corresponding year of the US census [19]. The 95% confidence interval was calculated for the 10 highest incidence rates.
The NEISS uses a body part diagram in which the lower extremity is schematically divided into toe, foot, ankle, lower leg, knee, upper leg, and lower trunk [18]. The toe includes the phalanges whereas the foot includes the metatarsal and tarsal bones. The lower leg is described as the tibia and fibula excluding the ankle and knee. For example, a tibia fracture is considered a lower leg fracture but when it goes through the tibial plateau, according to the NEISS coding manual it is considered a knee fracture. The patella also is considered the knee. The upper leg is the femur excluding from the part that goes into the knee or the femoral neck. This femoral neck is included in the lower trunk together with the hip, pelvis, and lumbar vertebrae.
The NEISS disease categories are amputation, contusion/abrasion, crushing, dislocation, presence of a foreign body, fracture, hematoma, laceration, nerve damage, puncture, strain or sprain, hemorrhage, avulsion (meaning a skin tear or avulsion including avulsion of a toenail), dermatitis, burns, and other/not stated. Burns can be divided into electrical, scald, chemical, radiation, thermal, and burns not specified. As the incidences of specific burn types were low, we combined the burn categories into one group. Although these categorizations do not neatly correspond with the anatomic and disease categories most commonly used by orthopaedic surgeons, they do provide a level of detail that may help provide public health considerations. The different anatomic regions and disease categories result in a total of 112 different injury combinations.
The circumstances of injury are classified by NEISS as home, farm/ranch, street or highway, other public property, manufactured/mobile home, industrial place, school, place of recreation or sports, and not recorded.
To calculate the age groups that accounted for the largest proportion of the 10 highest incidence injuries in 2009, we calculated age-specific incidences by 5-year age groups to age 105 years. To calculate incidences, we used data from 2009 US Census data [20]. The Spearman correlation test was used to see whether age correlated with incidence. We also calculated the incidence according to the location/circumstances of the injury. Finally, we chose to analyze a small sample of the highest incidence injuries (sprains of the ankle, knee, and lower trunk and contusions/abrasions of the lower trunk) and fractures by anatomic region for year-to-year consistency of incidence rates between 2000 and 2009. The choice to analyze these specific injuries is arbitrary and just an example of trends. Linear regression was performed and analyzed to see if there was an increase or decrease in incidence with time. No correction was made to limit type-I (false positive) error for the number of statistical tests applied.
Results
The most common area of injury was the lower trunk (28%), followed by the ankle (20%), knee (16%), foot (15%), lower leg (11%), toe (7%), and upper leg (4%) (Table 1). Strains and sprains accounted for 36% of all lower extremity injuries followed by contusions/abrasions (19%), fractures (18%), and lacerations (8%) (Table 2). Fractures are the most common injuries of the toe, lower leg, and upper leg (38%, 29%, and 31%, respectively). Strains or sprains are the most common injuries in the ankle (72%), the knee (43%), and lower trunk (37%) (Table 3). The majority of the amputations involved the toe (88%). Burns occurred mostly in the lower trunk, lower leg, foot, and upper leg (28%, 25%, 21%, and 19%, respectively). Most crushing injuries were in the toe and foot; together they accounted for 80% of all crushing injuries. The most foreign body injuries were in the foot (60%). Most dislocations were diagnosed in the knee (66%), presumably patellar dislocations because knee dislocations are rare severe injuries. Fractures were distributed over the lower trunk (25%), ankle (19%), lower leg (18%), foot (15%), and toe (14%). Punctures happened mostly in the foot (81%). Most strain or sprain injuries were in the ankle, followed by the lower trunk and knee (39%, 29%, and 19%, respectively). Hemorrhage was seen mostly in the lower leg (39%) and the lower trunk (34%). As for avulsion, the toe was the most affected body part (69%) (Table 4). We found the greatest incidence of lower extremity injuries to be ankle strains or sprains with a calculated incidence of 206 per 100,000 per year (95% CI, 181–230). Lower trunk strains or sprains were second with an incidence of 155 per 100,000 per year (95% CI, 128–183). The third greatest incidence rate was also of strains or sprains but for the knee, with an incidence of 102 per 100,000 per year (95% CI, 88–116). We found incidence rates of 98 per 100,000 per year (95% CI, 82–113) for lower trunk contusions/abrasions, 62 (95% CI, 54–71) for knee contusions/abrasions, and 50 (95% CI, 43–57) for foot contusions/abrasions. For fractures we found incidence rates of 70 per 100,000 per year (95% CI, 59–81) for the lower trunk and 49 (95% CI, 42–57) for ankle fractures (Table 5).
Table 1.
Distribution of lower extremity injuries
| Diagnosis | Percentage |
|---|---|
| Toe | 6.6 |
| Foot | 14.8 |
| Ankle | 19.8 |
| Lower leg | 10.6 |
| Knee | 16.4 |
| Upper leg | 3.5 |
| Lower trunk | 28.3 |
Table 2.
Distribution of lower extremity injuries
| Diagnosis | Percentage |
|---|---|
| Amputation | < 0.0 |
| Burns, total | 1.2 |
| Contusion/abrasion | 18.6 |
| Crushing | 0.1 |
| Dislocation | 1.4 |
| Foreign body | 0.8 |
| Fracture | 17.6 |
| Hematoma | 0.6 |
| Laceration | 8.0 |
| Nerve damage | 0.4 |
| Puncture | 2.2 |
| Strain/sprain | 36.2 |
| Hemorrhage | < 0.0 |
| Avulsion | 0.5 |
| Dermatitis | 0.2 |
| Other/not stated | 12.2 |
Table 3.
Distribution of lower extremity diagnoses*
| Diagnosis | Toe | Foot | Ankle | Lower leg | Knee | Upper leg | Lower trunk |
|---|---|---|---|---|---|---|---|
| Amputation | < 0.0 | < 0.0 | 0 | < 0.0 | 0 | 0 | 0 |
| Burns | 0.2 | 2.0 | 0.2 | 2.9 | 0.2 | 7.1 | 0.8 |
| Contusion/abrasion | 21.0 | 23.5 | 4.0 | 20.6 | 25.7 | 15.6 | 21.4 |
| Crushing | 0.9 | 0.4 | < 0.0 | 0.2 | < 0.0 | 0 | 0 |
| Dislocation | 1.6 | 0.1 | 0.3 | < 0.0 | 5.9 | 0 | 1.1 |
| Foreign body | 1.1 | 3.2 | < 0.0 | 0.6 | 0.2 | 1.3 | 0.4 |
| Fracture | 38.1 | 17.2 | 17.0 | 29.2 | 3.6 | 31.0 | 15.4 |
| Hematoma | 2.2 | 0.3 | 0.1 | 1.5 | 0.2 | 2.0 | 0.4 |
| Laceration | 15.6 | 12.8 | 1.8 | 23.4 | 7.8 | 18.3 | 1.1 |
| Nerve damage | 0 | < 0.0 | 0 | 0.1 | < 0.0 | 0.2 | 1.3 |
| Puncture | 1.1 | 11.8 | 0.1 | 1.2 | 0.3 | 2.3 | 0.2 |
| Strain/sprain | 5.1 | 18.8 | 71.7 | 8.7 | 42.9 | 14.9 | 36.7 |
| Hemorrhage | 0.1 | < 0.0 | < 0.0 | 0.1 | < 0.0 | 0.1 | < 0.0 |
| Avulsion | 5.4 | 0.2 | 0.1 | 0.9 | 0.1 | 0.1 | < 0.0 |
| Dermatitis | < 0.0 | 0.1 | 0.1 | 0.4 | < 0.0 | 0.7 | 0.4 |
| Other/not stated | 7.4 | 9.7 | 4.8 | 10.2 | 13.0 | 6.5 | 20.7 |
| Total | 100 | 100 | 100 | 100 | 100 | 100 | 100 |
* Presented in percentages.
Table 4.
Anatomic distribution of lower extremity injuries*
| Diagnosis | Toe | Foot | Ankle | Lower leg | Knee | Upper leg | Lower trunk | Total |
|---|---|---|---|---|---|---|---|---|
| Amputation | 87.5 | 6.3 | 0 | 6.3 | 0 | 0 | 0 | 100 |
| Burns | 1 | 20.9 | 3.3 | 25 | 2.6 | 18.9 | 28.3 | 100 |
| Contusion/abrasion | 7.4 | 18.6 | 4.2 | 11.8 | 22.6 | 2.9 | 32.5 | 100 |
| Crushing | 40.7 | 39.5 | 4.1 | 12.2 | 2.9 | 0 | 0.6 | 100 |
| Dislocation | 7.2 | 0.7 | 3.4 | 0.1 | 66.3 | 0 | 22.3 | 100 |
| Foreign body | 9 | 59.4 | 0.6 | 8.5 | 3.4 | 5.5 | 13.6 | 100 |
| Fracture | 14.3 | 14.5 | 19.2 | 17.7 | 3.3 | 6.2 | 24.8 | 100 |
| Hematoma | 25.3 | 6.5 | 2.7 | 28.6 | 6.8 | 12.2 | 17.9 | 100 |
| Laceration | 12.8 | 23.6 | 4.4 | 31.1 | 16 | 8 | 4 | 100 |
| Nerve damage | 0 | 1.3 | 0 | 3.5 | 0.2 | 1.5 | 93.5 | 100 |
| Puncture | 3.2 | 80.8 | 0.9 | 5.9 | 2.5 | 3.8 | 3 | 100 |
| Strain/sprain | 0.9 | 7.7 | 39.3 | 2.5 | 19.4 | 1.5 | 28.7 | 100 |
| Hemorrhage | 9.1 | 4.6 | 4.6 | 38.6 | 4.6 | 4.6 | 34.1 | 100 |
| Avulsion | 69 | 4.7 | 1.8 | 19.2 | 3.6 | 0.8 | 1 | 100 |
| Dermatitis | 0.4 | 7.8 | 4.7 | 21.5 | 3.1 | 11.7 | 50.8 | 100 |
| Other/not stated | 4 | 11.8 | 7.8 | 8.9 | 17.5 | 1.9 | 48.2 | 100 |
* Presented in percentages.
Table 5.
Estimated incidence rates of lower extremity injuries*
| Diagnosis | Toe | Foot | Ankle | Lower leg | Knee | Upper leg | Lower trunk |
|---|---|---|---|---|---|---|---|
| Burns | N/A | 3 | N/A | 4 | N/A | 3 | 3 |
| Contusion/abrasion | 19 | 50 | 11 | 30 | 62 | 9 | 98 |
| Crushing | 1 | 1 | N/A | N/A | N/A | N/A | N/A |
| Dislocation | 2 | N/A | 1 | N/A | 15 | N/A | 5 |
| Foreign body | 1 | 6 | N/A | 1 | N/A | 1 | 2 |
| Fracture | 37 | 37 | 49 | 38 | 9 | 13 | 70 |
| Hematoma | 2 | 1 | N/A | 3 | 1 | 1 | 2 |
| Laceration | 15 | 27 | 5 | 36 | 20 | 10 | 4 |
| Nerve damage | N/A | N/A | N/A | N/A | N/A | N/A | 7 |
| Puncture | 1 | 28 | N/A | 2 | 1 | 1 | 1 |
| Strain/sprain | 5 | 41 | 206 | 12 | 102 | 8 | 155 |
| Avulsion | 6 | N/A | N/A | 2 | 30 | N/A | N/A |
| Dermatitis | N/A | N/A | N/A | 1 | N/A | N/A | 1 |
| Other/not stated | 6 | 21 | N/A | 14 | 30 | 3 | 88 |
* Presented in percentages; N/A = sample count is too low to calculate historical estimate.
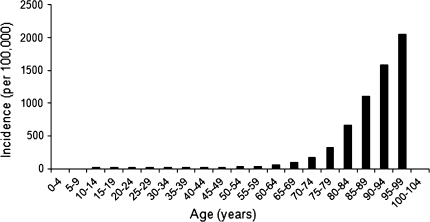
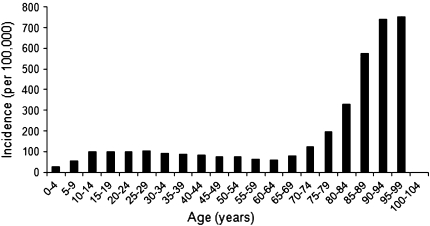
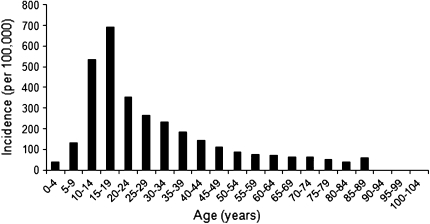
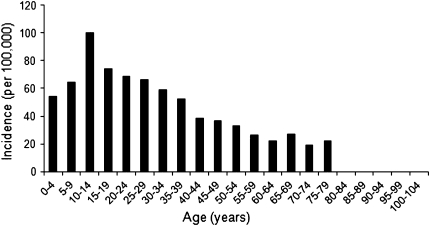
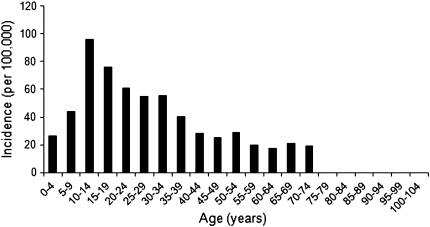
We observed a correlation between increasing age and lower trunk fractures (r = 0.96; p < 0.000) (Fig. 1) and increasing age and lower trunk contusions/abrasions (r = 0.60; p = 0.005) (Fig. 2). Age inversely correlated with ankle strain/sprains (r = −0.65; p = 0.003) (Fig. 3), foot contusions/abrasions (r = −0.89; p < 0.001) (Fig. 4), and foot strains/sprains (r = −0.75; p < 0.001) (Fig. 5), with younger patients more likely to have these injuries.
Fig. 1.
The incidence per age for lower trunk fractures during 2009 is shown.
Fig. 2.
The incidence per age for lower trunk contusions during 2009 is shown.
Fig. 3.
The incidence per age for ankle strains/sprains during 2009 is shown
Fig. 4.
The incidence per age for foot contusions during 2009 is shown.
Fig. 5.
The incidence per age for foot strains/sprains during 2009 is shown.
The most common circumstance of injury was at home (45%) followed by place of recreation or sports (15%); however, location frequently was not recorded (26%) (Table 6).
Table 6.
Percentage of injuries in each circumstance
| Location | Percentage |
|---|---|
| Home | 45 |
| Farm/ranch | 0.1 |
| Street or highway | 2.5 |
| Other public property | 6.4 |
| Manufactured (mobile) home | < 0.0 |
| Industrial place | < 0.0 |
| School | 4.9 |
| Place of recreation or sports | 15.1 |
| Not recorded | 25.9 |
The incidence rates for strains and sprains of the ankle decreased (B = −5.2; p = 0.001; R2 = 0.8) between 2000 and 2009, whereas the incidence of lower trunk contusions/abrasions increased (B = 1.7; p = 0.000; R2 = 0.9). The incidence of strains and sprains of the knee and lower trunk were consistent between 2000 and 2009. There was an increase in the incidence of ankle fractures (B = 0.4; p = 0.014; R2 = 0.55) and lower trunk fractures (B = 1.2; p = 0.001; R2 = 0.75) and a decrease in toe fractures (B = −0.5; p = 0.02; R2 = 0.5). The incidence rates for the other fractures were stable.
Discussion
Knowledge of the relative incidence of injuries according to these categories can provide public health initiatives that address injury prevention, resource allocation, and training priorities. Comparison of seven different data sources available for conducting analyses of emergency department visits (the American Hospital Association Annual Survey Database™, Hospital Market Profiling Solution©, National Emergency Department Inventory, Nationwide Emergency Department Sample, National Hospital Ambulatory Medical Care Survey, National Electronic Injury Surveillance System, and the National Health Interview Survey) showed the NEISS contains the most comprehensive surveillance of injuries treated in the emergency department [11]. The database has been used for various studies [1, 3, 21, 23, 24]. Some of these studies use the NEISS to give an in-depth analysis of a specific injury type such as a shoulder dislocation, scaphoid fracture, or an ankle sprain. Others use the NEISS to map injuries sustained during certain activities (such as ice hockey) or with certain products (such as trampolines). We analyzed the NEISS data to determine leg injury incidence according to (1) region and disease category; (2) age; and (3) location, and we assessed the consistency of these incidence rates over the years in a subsample of injury types.
We acknowledge the limitations of our study. As we used the NEISS database to collect our data, the main limitations are related to this database. Although being the most usable database for our data collection, several issues should be kept in mind when interpreting the data. First, the NEISS data reflect only a sampling and therefore create estimates rather than precise counts; the error rate in the entered data is unknown, but the likelihood of major errors is low. The population data provided by the US Census Bureau are also estimates based on every 10-year sampling. Second, the classification of the different anatomic regions and different injury types is debatable. For example, it is likely that the diagnosis of sprains and strains in this database is not a very specific category but is commonly used for emergency department patients with complaints of lower extremity pain without a fracture or other specific diagnosis. The percentage of these patients with an identifiable torn ligament or tendon is unknown but certainly less than 100%. Furthermore, using the NEISS anatomic classification of the lower trunk, it is not possible to be more specific than we were in this investigation. For instance, when referring to a fracture of the lower trunk it is not clear if the fracture involves the femoral neck, the intertrochanteric region, or even the lumbar vertebrae. Third, data may change with time. We found some variance in consistency with annual incidence rates during the last 10 years. The incidence of ankle strains decreased during the study period. However, most of the observed injuries showed consistency and where variation was present the difference was small. Fourth, these data show incidence rates of emergency department presentations only. The actual incidence of some injury types presumably is greater than those treated by emergency departments. For example, it is likely everyone with a crushing injury of the foot will visit an emergency department, but many people with a hematoma of the foot may not go to the emergency department.
The most common injury was an ankle sprain, with an incidence of 206 per 100,000 per year, and this is an injury of young adults and teenagers. This is also the only lower extremity injury that was evaluated using the NEISS by another study [23]. In that study, the epidemiology of ankle sprains between 2002 and 2006 was investigated in greater detail and factors associated with ankle sprains were age, race, gender, and involvement in athletics. Other previously described incidence rates for ankle sprains vary widely. In settings such as sports, the reported incidence is greater [4, 5], and in the military, the incidence was as high as 5840 per 100,000 persons per year [22]. Other studies that report incidences at emergency departments also report higher incidences of 530 to 700 per 100,000 persons per year [2, 6]. Waterman et al. [23] concluded that the lower incidence of ankle sprains found with the NEISS database could be explained by the fact that only one-third of the individuals with ankle sprains or strains seek treatment in an emergency department. One of these studies [6] also included strains/sprains of the foot, which might explain the higher incidence reported in that study, but if we were to combine incidence rates of ankle and foot strain/sprains in our study, it still would be far less than their reported incidence (247 versus 700).
The high correlation between advancing age and lower trunk fractures is well recognized [7–9, 12, 14]. We found injuries in the knee or below the knee were associated with younger age whereas injuries above the knee were associated with increasing age. Our analysis also showed the ability to track incidence rates, although we think it is important to have many more years of data given that our study from 2000 to 2009 showed an increasing incidence of ankle sprains, but a prior study between 2000 and 2006 did not, suggesting a strong influence of sampling [23]. The finding that most lower extremity injuries occur at home indicates preventative measures are needed.
Relatively low-acuity lower extremity problems such as strains and sprains account for a substantial prevalence of emergency department visits. Different approaches to triage and evaluation of lower extremity injury might result in better utilization of emergency healthcare resources. For instance, patients with ankle injuries might call an emergency phone number to be triaged for an urgent visit or a scheduled visit during regular business hours based on factors such as the Ottawa ankle rules [15, 16].
Footnotes
One of the authors (KL) has received funding for his research fellowship from the Marti-Keuning Eckhardt Foundation, the Netherlands and the Anna Foundation, the Netherlands.
Each author certifies that he or she has no commercial associations (eg, consultancies, stock ownership, equity interest, patent/licensing arrangements, etc) that might pose a conflict of interest in connection with the submitted article.
References
- 1.Alexander K, Eager D, Scarrott C, Sushinsky G. Effectiveness of pads and enclosures as safety interventions on consumer trampolines. Inj Prev. 2010;16:185–189. doi: 10.1136/ip.2009.025494. [DOI] [PMC free article] [PubMed] [Google Scholar]
- 2.Bridgman SA, Clement D, Downing A, Walley G, Phair I, Maffulli N. Population based epidemiology of ankle sprains attending accident and emergency units in the West Midlands of England, and a survey of UK practice for severe ankle sprains. Emerg Med J. 2003;20:508–510. doi: 10.1136/emj.20.6.508. [DOI] [PMC free article] [PubMed] [Google Scholar]
- 3.Deits J, Yard EE, Collins CL, Fields SK, Comstock RD. Patients with ice hockey injuries presenting to US emergency departments, 1990–2006. J Athl Train. 2010;45:467–474. doi: 10.4085/1062-6050-45.5.467. [DOI] [PMC free article] [PubMed] [Google Scholar]
- 4.Fernandez WG, Yard EE, Comstock RD. Epidemiology of lower extremity injuries among U.S. high school athletes. Acad Emerg Med. 2007;14:641–645. doi: 10.1197/j.aem.2007.03.1354. [DOI] [PubMed] [Google Scholar]
- 5.Fong DT, Man CY, Yung PS, Cheung SY, Chan KM. Sport-related ankle injuries attending an accident and emergency department. Injury. 2008;39:1222–1227. doi: 10.1016/j.injury.2008.02.032. [DOI] [PubMed] [Google Scholar]
- 6.Holmer P, Sondergaard L, Konradsen L, Nielsen PT, Jorgensen LN. Epidemiology of sprains in the lateral ankle and foot. Foot Ankle Int. 1994;15:72–74. doi: 10.1177/107110079401500204. [DOI] [PubMed] [Google Scholar]
- 7.Kannus P, Parkkari J, Sievanen H, Heinonen A, Vuori I, Jarvinen M. Epidemiology of hip fractures. Bone. 1996;18(1 suppl):57S–63S. doi: 10.1016/8756-3282(95)00381-9. [DOI] [PubMed] [Google Scholar]
- 8.Koval KJ, Skovron ML, Aharonoff GB, Zuckerman JD. Predictors of functional recovery after hip fracture in the elderly. Clin Orthop Relat Res. 1998;348:22–28. [PubMed] [Google Scholar]
- 9.Miyamoto RG, Kaplan KM, Levine BR, Egol KA, Zuckerman JD. Surgical management of hip fractures: an evidence-based review of the literature. I: femoral neck fractures. J Am Acad Orthop Surg. 2008;16:596–607. doi: 10.5435/00124635-200810000-00005. [DOI] [PubMed] [Google Scholar]
- 10.Niska R, Bhuiya F, Xu J. National Hospital Ambulatory Medical Care Survey: 2007 emergency department summary. Natl Health Stat Report. 2010;26:1–31. [PubMed] [Google Scholar]
- 11.Owens PL, Barrett ML, Gibson TB, Andrews RM, Weinick RM, Mutter RL. Emergency department care in the United States: a profile of national data sources. Ann Emerg Med. 2010;56:150–165. doi: 10.1016/j.annemergmed.2009.11.022. [DOI] [PubMed] [Google Scholar]
- 12.Pillai A, Eranki V, Shenoy R, Hadidi M. Age related incidence and early outcomes of hip fractures: a prospective cohort study of 1177 patients. J Orthop Surg Res. 2011;6:5. doi: 10.1186/1749-799X-6-5. [DOI] [PMC free article] [PubMed] [Google Scholar]
- 13.Schroeder T, Ault K. The NEISS sample (design and implementation) 1997 to present. U.S. Consumer product safety Commission Division of Hazard and Injury Data Systems. 2001. Available at: http://www.cpsc.gov/neiss/2001d011-6b6.pdf. Accessed September 1, 2010.
- 14.Smith W, Williams A, Agudelo J, Shannon M, Morgan S, Stahel P, Moore E. Early predictors of mortality in hemodynamically unstable pelvis fractures. J Orthop Trauma. 2007;21:31–37. doi: 10.1097/BOT.0b013e31802ea951. [DOI] [PubMed] [Google Scholar]
- 15.Stiell IG, Greenberg GH, McKnight RD, Nair RC, McDowell I, Worthington JR. A study to develop clinical decision rules for the use of radiography in acute ankle injuries. Ann Emerg Med. 1992;21:384–390. doi: 10.1016/S0196-0644(05)82656-3. [DOI] [PubMed] [Google Scholar]
- 16.Stiell IG, McKnight RD, Greenberg GH, McDowell I, Nair RC, Wells GA, Johns C, Worthington JR. Implementation of the Ottawa ankle rules. JAMA. 1994;271:827–832. doi: 10.1001/jama.1994.03510350037034. [DOI] [PubMed] [Google Scholar]
- 17.The National Electronic Injury Surveillance System. A Tool for Researchers. U.S. Consumer Product Safety Commission Division of Hazard and Injury Data Systems. 2000. Available at: http://www.cpsc.gov/neiss/2000d015.pdf. Accessed September 1, 2010.
- 18.The National Electronic Injury Surveillance System. Coding Manual. 2010. Available at: http://www.cpsc.gov/neiss/completemanual.pdf. Accessed September 1, 2010.
- 19.United States Census. Annual Population Estimates 2000 to 2009. Available at: http://www.census.gov/popest/states/tables/NST-EST2009-01.xls. Accessed September 1, 2010.
- 20.United States Census. Monthly Postcensal Resident Population, by single year of age, sex, race, and Hispanic origin, 1/1/2009 to 6/1/2009. Available at: http://www.census.gov/popest/national/asrh/files/NC-EST2009-ALLDATA-R-File19.csv Accessed September 1, 2010.
- 21.Tassel DC, Owens BD, Wolf JM. Incidence estimates and demographics of scaphoid fracture in the U.S. population. J Hand Surg Am. 2010;35:1242–1245. doi: 10.1016/j.jhsa.2010.05.017. [DOI] [PubMed] [Google Scholar]
- 22.Waterman BR, Belmont PJ Jr, Cameron KL, Deberardino TM, Owens BD. Epidemiology of ankle sprain at the United States Military Academy. Am J Sports Med.38:797–803. [DOI] [PubMed]
- 23.Waterman BR, Owens BD, Davey S, Zacchilli MA, Belmont PJ., Jr The epidemiology of ankle sprains in the United States. J Bone Joint Surg Am. 2010;92:2279–2284. doi: 10.2106/JBJS.I.01537. [DOI] [PubMed] [Google Scholar]
- 24.Zacchilli MA, Owens BD. Epidemiology of shoulder dislocations presenting to emergency departments in the United States. J Bone Joint Surg Am. 2010;92:542–549. doi: 10.2106/JBJS.I.00450. [DOI] [PubMed] [Google Scholar]


