

Abstract
Pancreatic stellate cells (PaSC) are emerging as key mediators in chronic pancreatitis and pancreatic cancer pathogenesis. Proteins regulating the biomolecular pathways involved in the conversion of quiescent to activated PaSC may have a significant influence in the development of chronic pancreatitis. We aim to compare differentially expressed proteins in activated and serum-starved non-proliferating PaSC using a mass spectrometry-based proteomics strategy. We cultured an immortalized rat PaSC cell line in media supplemented with 10% fetal bovine serum and in serum-free media. Using gel-based mass spectrometry (GeLC-MS/MS), we identified nearly 1500 proteins. Qualitative and quantitative proteomic analysis revealed several hundred proteins as differentially abundant between the two cell states. Proteins of greater abundance in activated PaSC included isoforms of actin (e.g., smooth muscle actin) and ribosomal proteins. Conversely, proteins more abundant in non-proliferating PaSC than in activated PaSC included signaling proteins MAP kinase 3 and Ras-related proteins. In addition, we have determined the molecular functions and biological pathways for these proteins. We are confident that the application of mass spectrometry-based strategies, such as that described herein, to investigate specific proteins in PaSC may lead to a better understanding of the molecular mechanisms involved in pancreatic diseases, such as chronic pancreatitis.
Keywords: pancreatitis, biomarker, proteomics, fibrosis, stellate cells
INTRODUCTION
Chronic pancreatitis is a progressively debilitating disorder which can only be detected at a moderate to advanced stage on radiologic / endoscopic imaging, and as such, only symptomatic treatment is possible. Early-stage chronic pancreatitis has been defined by the development of pancreatic fibrosis [1] and has been modeled by the SAPE hypothesis [2]. Under this hypothesis, an initial insult to acinar and duct cells (e.g., alcohol) is followed by the invasion of inflammatory cells, which produce cytokines and activate baseline quiescent PaSC. Understanding the mechanisms that activate and control the cellular functions of PaSC could provide potential targets for the treatment or diagnosis of pancreatic fibrosis, which is a precursor to the development of chronic pancreatitis [3].
Pancreatic stellate cells (PaSC) are myofibroblast-like cells residing in exocrine areas of the pancreas and have been shown to toggle from the quiescent to activated phenotypes, analogous to hepatic stellate cells [2]. In addition, studies have shown 99% mRNA conservation between PaSC and hepatic stellate cells [4]. PaSC may have a role in pancreatic repair and regeneration by way of secretions which may nucleate cell proliferation, migration, and assembly [5-8]. When activated, PaSC migrate to the injured location, and participate in tissue repair activities, such as secreting extracellular matrix components. In addition, PaSC may be a major factor in the pathogenesis of pancreatitis and pancreatic cancer. In response to pancreatic injury, PaSC undergo functional changes including the expression of several growth factors and cytokines, which participate in inflammatory and fibrotic processes [5, 9-14]. Proteins secreted from activated PaSC may be pivotal to the development of chronic pancreatitis.
Pancreatic stellate cell research remains an untapped source of potential biomarker proteins. Investigation of the roles of PaSC in pancreatic disease may lead to a better understanding of the mechanism of fibrosis associated with chronic pancreatitis. Although extensive studies have focused on the proteomic analyses of hepatic stellate cells [15-20], to date, analogous large-scale studies focusing on PaSC have been sparse.
In this study, we aim to 1) characterize the proteomes of a PaSC cell line [21] in the presence and absence of fetal bovine serum (FBS) in the growth media using SDS-PAGE/mass spectrometry-based proteomic analysis (GeLC-MS/MS), 2) apply label-free spectral counting quantification strategies (QSPEC) [22] to identify differentially abundant proteins between the two cell states, and 3) bioinformatically analyze the identified proteins to determine the localization, molecular function and signaling pathways of the differentially-abundant proteins using gene ontology (GO) and KEGG pathway analysis.
Here we present the first proteomic analysis of rat PaSC in the activated and a non-proliferating state. The proteins and pathways identified herein provide a foundation for future studies investigating the roles of stellate cells in pancreatic disease.
MATERIALS AND METHODS
Materials
Dulbecco’s Modified Eagle Media (DMEM; 11330) was purchased from Gibco (Carlsbad, CA). Fetal bovine serum (FBS; F0392) was purchased from Sigma (St. Louis, MO). CellStripper (25-056-CL) was purchased from Mediatech (Manassas, VA). SeeBluePlus2 Pre-Stained standard (LC5925), LDS (lithium dodecyl sulfate) sample buffer (NP0008), NuPAGE 4-12% Bis-Tris polyacrylamide gels (NP0335), SimplyBlue Coomassie stain (LC0665), and MES-SDS electrophoresis buffer (NP002) were from Invitrogen (Carlsbad, CA). Other reagents and solvents were from Sigma-Aldrich (St. Louis, MO) and Honeywell, Burdick & Jackson (Morristown, NJ), respectively.
Experimental Workflow
The experimental workflow is illustrated in Figure 1. An immortalized cell line of rat PaSC [21] was grown in DMEM either with or without fetal bovine serum (FBS). The experiments were performed in triplicate, that is, the following procedure was repeated in parallel for three plates of each cell state. Cells were harvested by dislodgment from a 10-cm cell culture dish using non-enzymatic CellStripper reagent. The cells were lysed via homogenization and crudely fractionated into soluble and membrane-enriched solubilized protein fractions by ultracentrifugation at 100,000 × g for 1 hr. The isolated protein fractions were separated by SDS-PAGE and processed using standard GeLC-MS/MS techniques. Finally, the collected mass spectrometric data were analyzed using a series of bioinformatics methods, including database searching with ProteinPilot, spectral counting (QSPEC), gene ontology (GO) classification, and KEGG pathway analysis. The cell culture and mass spectrometry experiments were performed at the Proteomics Center at Children’s Hospital Boston (J.P. and H.S.) and the immortalized PaSC cell line originated from the Mayo Clinic (R.U.).
Figure 1. General workflow.
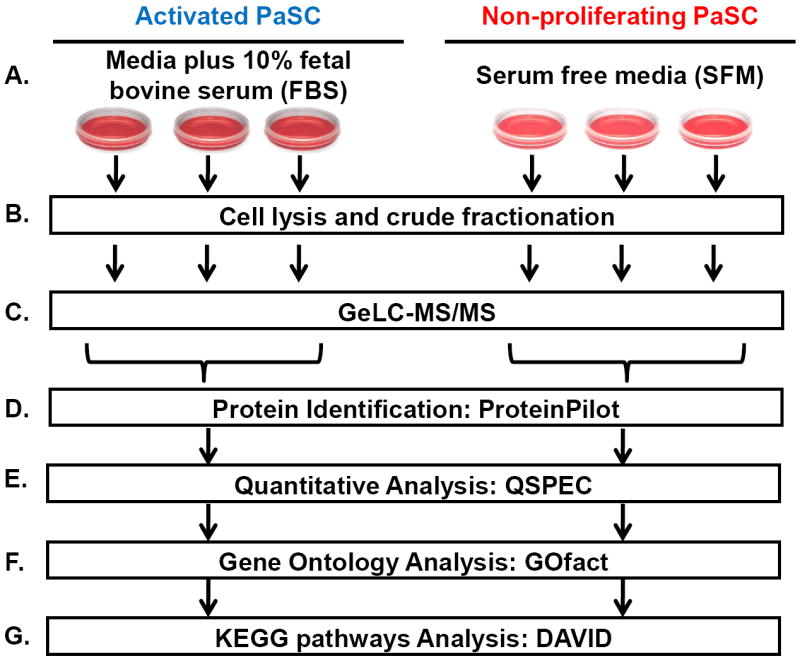
The general workflow was as follows: a. Rat PaSC were grown in DMEM media either with or without fetal bovine serum. b. Cells were lysed and crudely fractionated into cytoplasmic and membrane-rich protein fractions. c. The isolated protein fractions were separated by SDS-PAGE and GeLC-MS/MS was performed. d. The mass spectrometric data was analyzed using a series of bioinformatics methods.
Cell growth and harvesting
An immortalized pancreatic stellate cell line from rat (rattus norvegicus) origin was propagated in DMEM supplemented with 10% fetal bovine serum (FBS). Upon achieving 90% confluence (on the order of 107 cells), the growth media was aspirated and the cells were washed 3 times with ice-cold PBS. For the preparation of non-proliferating cells, DMEM was added without FBS supplementation. In parallel, fresh DMEM with 10% FBS was added to those cells which were slated to remain in the activated state. Twenty-four hours following the addition of fresh media, the cells were dislodged with non-enzymatic CellStripper, harvested with the addition of 10 mL PBS and pelleted by centrifugation at 3,000 × g for 5 min at 4°C, after which the supernatant was removed.
Cell lysis and crude fractionation
This procedure was summarized in Figure 2. One milliliter of TBSp (50 mM Tris, 150 mM NaCl, pH 7.4 supplemented with 1X Roche Complete protease inhibitors) was added per plate of cells, which were then homogenized with 20-25 strokes of a Potter-Elvehjem glass homogenizer. The homogenate was centrifuged at 100,000 × g for 60 minutes at 4°C to sediment proteins in membrane vesicles. The supernatant (s1) was collected; the pellet was reconstituted in 1 mL ice-cold TBSp plus 1% Triton X-100 and 0.5% SDS. The reconstituted pellet was once again homogenized with 20-25 strokes of a Potter-Elvehjem glass homogenizer and incubated on ice with gentle agitation for 1 hour. Detergent-solubilized proteins (s2) were separated from the insoluble proteins and cellular debris by ultracentrifugation at 100,000 × g for 60 minutes at 4°C. Protein concentrations for both the s1 and s2 fractions were determined using the BCA assay (23225, ThermoFisher Scientific).
Figure 2. PaSC sample processing for GeLC-MS/MS analysis.

The general workflow was as follows: A) Cells were grown in the absence or presence of 10% FBS. B) The cells were washed with phosphate buffered saline and dislodged with CellStripper. C) The cells were lysed and homogenized. D) Following ultracentrifugation, the soluble protein (s1) was collected. E) Meanwhile, the insoluble fraction was homogenized in detergent-containing buffer. F) The insoluble fraction was once again subjected to ultracentrifugation to isolate the detergent-solubilized fraction (s2). G) The two isolated fractions were subjected to GeLC-MS/MS and subsequent bioinformatics analysis.
SDS-PAGE analysis of cell lysates
LDS sample buffer (20 μl) was added at a 1X concentration to 100 μg of protein. To each sample, 2 μl of 0.1 M DTT (dithiothreitol) were added, and the sample was then incubated at 56°C for 1 hour. After cooling, samples were alkylated with 2 μl of 40% acrylamide for 30 minutes at 23°C. SDS-PAGE protein separation was performed at 150 volts in MES buffer for 45 minutes. Gels were rinsed in deionized water for 10 minutes, fixed in 45% methanol/45% water/10% acetic acid for 30 minutes, stained with SimplyBlue Coomassie for 1 hour, and destained overnight in deionized water.
GeLC-MS/MS analysis
In total, six gel lanes (3 for activated cells and 3 for non-proliferating cells) of cell lysate proteins were subjected to in-gel tryptic digestion followed by reversed-phase liquid chromatography in-line with a tandem mass spectrometer (GeLC-MS/MS). In brief, entire gel lanes were divided into 10 sections and proteins in each gel section were digested with trypsin [23, 24]. Peptides extracted from each gel section were fractionated and analyzed by a nanoflow reversed-phase ultra-high pressure liquid chromatography system (UPLC, Eksigent) in-line with a linear trap quadrupole-Fourier transform ion cyclotron resonance mass spectrometer (LTQ-FT Ultra, Thermo Scientific). The LC columns (15 cm × 100 μm ID) were packed in-house (Magic C18, 5 μm, 100 Å, Michrom BioResources). Samples were analyzed with a 60-minute linear gradient (0-35% acetonitrile with 0.2% formic acid) and data were acquired in a data-dependent manner, with 6 MS/MS scans for every full scan spectrum.
Bioinformatics and data analysis
Data generated from the gel sections were searched against the UniProt human database (20,330 entries, downloaded: November 11, 2010) using the Paragon Algorithm [25], which is integrated into the ProteinPilot search engine (v.3; AB SCIEX, Foster City, CA). Search parameters were set as follows: sample type, identification; Cys alkylation, propionamide; Digestion, trypsin; Instrument, Orbitrap/FT (1-3 ppm); Special factors, gel-based ID; ID focus, none; database, UniProt; detection protein threshold, 99.0%; and search effort, thorough ID. We defined an identified protein as one containing a peptide of >95% confidence, as determined by the Paragon Algorithm [25]. The analysis included a decoy database search, which resulted in a false discovery rate of less than 1% as determined using the Proteomics System Performance Evaluation Pipeline Software (PSPEP) which was built into the ProteinPilot software.
Spectral counting
We performed relative protein quantitation using a label-free technique, spectral counting, which compared the number of identified tandem MS spectra for the same protein across multiple data sets. In searching for differences in the protein profile among data sets, spectral counts were normalized based on the total spectral counts, as previously suggested [26]. More specifically, spectral counts of each protein were divided first by the total spectral counts of all proteins from the same sample, and then multiplied by the total spectral counts of the sample with the maximum total number of spectral counts. Significance analysis of our spectral count data was performed using QSPEC, a recently published algorithm for determining the statistical significance of differences in spectral counting data from two sample sets [27]. This algorithm used the Bayes Factor, in lieu of the p-value, as a measure of statistical significance [28, 29]. According to convention, a Bayes factor greater than 10 suggests strong evidence that a particular protein was differentially expressed with statistical significance between the two cell states, thus a value of 10 was used as our significance threshold [30].
Gene Ontology (GO) Analysis
GO analysis [31] was performed using the GoFact online tool [32, 33] and verified manually using the UniProt [34] database using both the exclusive and differentially abundant proteins. Annotation categories used were as follows: functions: enzyme regulator activity, ion binding, kinase activity, lipid binding, nucleic acid binding, nucleotide binding, oxygen binding, peptidase activity, protein binding, signal transducer activity, structural molecule activity, transcription regulator activity, and transporter activity; cellular component: cytoplasm (includes both cytoskeletal and cytosolic protein categories), endoplasmic reticulum (ER), endosome, extracellular matrix, extracellular region, Golgi apparatus, lysosomes, membrane, mitochondrion, nucleus, ribonucleoprotein complex, and vacuole.
KEGG Pathway Analysis
Using the DAVID (Database for Annotation, Visualization and Integrated Discovery) Bioinformatics Database (http://david.abcc.ncifcrf.gov/) interface [35, 36], we analyzed the exclusive and differentially abundant proteins with KEGG (Kyoto Encyclopedia of Genes and Genomes) pathway analysis [37-39].
RESULTS
Morphological differences were apparent in PaSC after growth for 24 hrs in FBS-containing and serum-free media
PaSC were successfully grown in DMEM with and without supplementation of 10% FBS. The cells grown in serum-free media for 24 hr, remained attached to the culture dish, but generally acquired a more rounded morphology, similar to quiescent PaSC [40-42]. In addition, the cells lacking FBS in the media stopped proliferating and remained in such a state for 3 to 4 days, after which they are no longer viable. It is of interest to note that if FBS is added to the cells within the 3 to 4 days of “non-proliferation,” the cells revert back to their “activated state” morphology. This particular observation may be considered a topic for future analyses.
SDS-PAGE revealed similar protein patterns between lysates of activated and non-proliferating PaSC
Following 24 hr of growth in the selected media, both activated and non-proliferating cells were lysed and processed as depicted in Figure 2. SDS-PAGE fractionation was performed on the s1 and s2 fractions for both cell states (Figure 3). Similar protein banding patterns were obtained for replicates both within and between the two cell states. It was also worth noting that the s1 and s2 fractions vary significantly in their protein banding patterns. This difference was prevalent particularly in the lower molecular weight range of the s2 lanes, as protein bands representing histones from the nucleus were visible. For GeLC-MS/MS analysis, each gel lane was subdivided into 10 sections that were individually processed and analyzed. The data were merged in ProteinPilot so that each replicate sample included proteins from an s1 fraction and the corresponding s2 fraction.
Figure 3. SDS-PAGE protein fractionation of PaSC lysates.
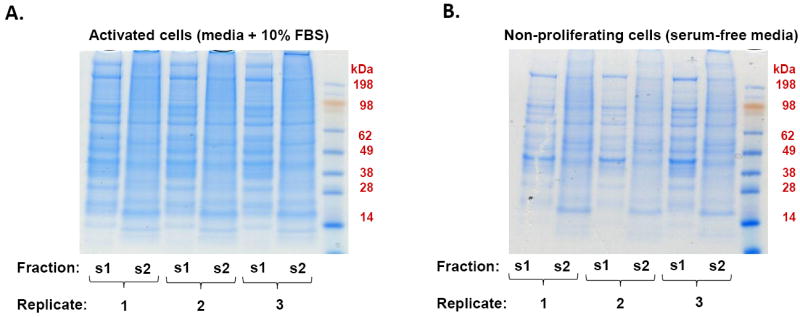
Each gel lane represented approximately 100 μg of proteins from either A) activated PaSC (grown in DMEM and 10% FBS) or B) non-proliferating PaSC (grown in serum-free media). Fraction indicates either the soluble protein (s1) or the detergent solubilized protein (s2).
Proteins exclusive to either activated or non-proliferating PaSC were identified using our GeLC-MS/MS protein identification strategy
We identified a total of 1174 non-redundant proteins in activated PaSC and 1350 proteins in non-proliferating PaSC (Table 1). Qualitatively, 124 of these proteins were exclusive to activated PaSC (Supplementary Table 1) and 300 proteins were exclusive to pseudo-activated PaSC (Supplementary Table 2). Proteins exclusive to activated PaSC included: several ribosomal proteins, alpha-1-macroglobulin, plasminogen activator inhibitor 1, tubulin alpha-1B chain and several serine/threonine-protein kinases, mTOR, PAK 2, 2A, 4, and PP1-alpha. Similarly, proteins exclusive to the non-proliferating PaSC included alpha skeletal muscle actin, ADP-ribosylation factor 5, calmodulin-like protein 3, desmin, elongator complex protein 1, various isotypes of myosin, and Ras-related protein Rab-35, Rab-4B, Rab-8A, and Rab-8B.
Table 1.
Summary of proteins identified for each cell state.
| cell state | replicate # | proteins identified in each replicate | non-redundant proteins identified in each cell state | proteins exclusive to each cell state | proteins statistically more abundant in each cell state | total number of differentially expressed proteins between cell states |
|---|---|---|---|---|---|---|
| 1 | 1014 | |||||
| activated | 2 | 938 | 1174 | 124 | 52 | 176 |
| 3 | 920 | |||||
|
| ||||||
| 1 | 1162 | |||||
| non-proliferating | 2 | 1190 | 1350 | 300 | 75 | 375 |
| 3 | 1200 | |||||
total number of differentially expressed proteins between cell states= proteins exclusive to each cell state + proteins statistically more abundant in each cell state
Spectral counting analysis determined statistically significant abundance differences between proteins common to both activated and non-proliferating PaSC
We used the QSPEC algorithm to determine statistically significant differences between proteins that were identified in both activated and non-proliferating PaSC. We summarized these differences in protein identifications by two Venn diagrams (Figure 4). A total of 52 proteins were determined to be of statistically significant higher abundance in activated PaSC (Supplementary Table 3) and likewise, 75 were of higher abundance in non-proliferating PaSC (Supplementary Table 4). In addition, there were 923 proteins which did not show statistically significant differential abundance in either cell state (Supplementary Table 5). We listed the peptides and associated parameters for all proteins identified in this study in Supplementary Table 6.
Figure 4. Venn diagram of the total number of non-redundant proteins identified by GeLC-MS/MS in the two cell states (activated and non-proliferating).
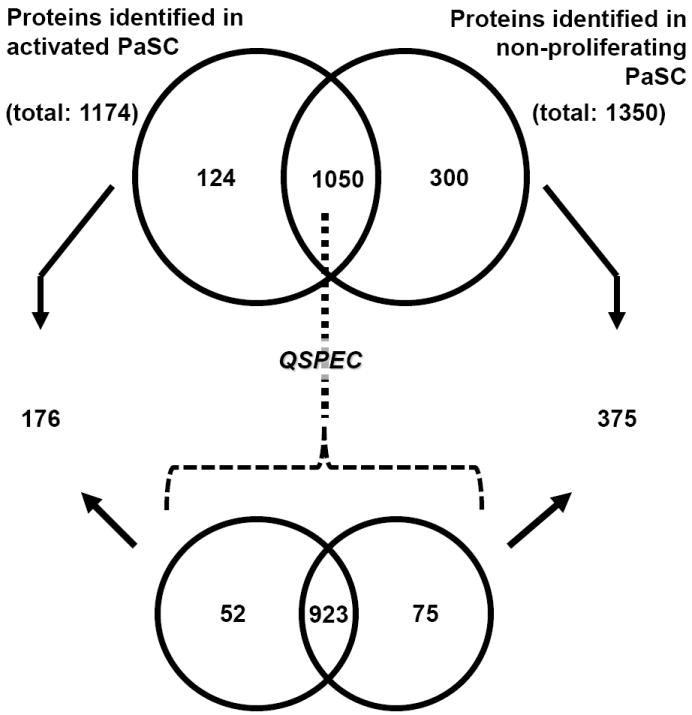
In total, 1174 non-redundant proteins were identified in activated PaSC and 1350 proteins were identified exclusively in non-proliferating PaSC. A total of 124 and 300 proteins were identified exclusively in activated and non-proliferating PaSC, respectively. Statistically significant differences between the remaining 1050 proteins that were identified in both activated and non-proliferating PaSC were examined using QSPEC. This analysis revealed an additional 52 proteins that were of statistically significant (Bayes factor ≥ 10) higher abundance in activated PaSC and 75 proteins which were of likewise higher abundance in non-proliferating PaSC.
Proteins determined to be of higher abundance via QSPEC analysis in activated PaSC included: myosin-9, vimentin, plectin, and various isotypes of actin, including the cytoplasmic 1 and 2, gamma-enteric smooth muscle, and aortic smooth muscle types. Similarly, proteins determined to be of higher abundance via QSPEC analysis in non-proliferating PaSC included: cullin-associated NEDD8-dissociated protein 1 (Cand1), Ras-related protein Rab-1B, and protease anionic trypsin-1, cationic trypsin-3, and aminopeptidase B. Proteins for which differences were not statistically significant in activated and non-proliferating PaSC and have the highest number of combined spectral counts included alpha-actinin-4, the common housekeeping protein glyceraldehyde-3-phosphate dehydrogenase, tubulin beta-5 chain, annexin A2, and alpha-enolase. These proteins may be considered a part of a core set which may be useful for normalization purposes in downstream biochemical assays.
Gene ontology (GO) annotation analysis revealed differences in subcellular localization and molecular function between the activated and non-proliferating PaSC cell states
As summarized in Figure 4, we determined 176 proteins as exclusive to (124) or of statistically higher abundance (52) in activated PaSC. Likewise, we determined 375 as exclusive to (300) or of statistically higher abundance (75) in non-proliferating PaSC. These two sets of differentially abundant proteins (176 for activated PaSC and 375 for non-proliferating PaSC) were used for GO and KEGG pathway analyses. Using the GoFact online tool [32, 33], we examined the subcellular localization (Figure 5A) and molecular function (Figure 5B) of these proteins. The analysis of the subcellular localization indicated that activated PaSC showed a greater percentage of proteins that were of cytoplasmic, endoplasmic reticulum (ER), membrane, or ribonucleic protein complex origin. However, non-proliferating PaSC showed a greater percentage of proteins that were of extracellular, Golgi complex, or nuclear origin. Similarly, when examining the molecular function of the differently expressed proteins, we noted that activated PaSC showed a greater percentage of proteins that were enzyme regulating, nucleic acid binding, nucleotide binding, protein binding, or transporters. However, GO analysis of non-proliferating PaSC showed a greater percentage of proteins that were kinases, ion binding, or peptidases.
Figure 5. Gene ontology analysis of A) subcellular localization and B) molecular function for proteins that were differentially expressed in activated and non-proliferating PaSC.

Gene ontology classification of proteins which were either exclusive to or determined to have statistically significant differences in a particular cell state was performed manually with the UniProt [34] database or using the GoFact online tool [32, 33].
KEGG pathway analysis revealed differences in biological pathways between the activated and non-proliferating PaSC cell states
Using the DAVID interface [35, 36], we surveyed the biomolecular pathways of which proteins that we determined to be differentially expressed between the two cell states were members. Of note, not all proteins identified were associated with a KEGG pathway, thus we were limited to those proteins annotated in the KEGG pathway database. Tables 2 and 3 listed the pathways and the number of proteins within the given pathway for activated and non-proliferating PaSC cell states, respectively. For activated PaSC (Table 2), the ribosome pathway was among those with the highest number of associated proteins. For the non-proliferating PaSC (Table 3), regulation of actin cytoskeleton, focal adhesions, and lysosomes were among the pathways with the highest number of associated proteins. In addition, there were several pathways which included proteins from both cells states, including smooth muscle contraction, tight junctions and the signaling pathways ErbB, GnRH, and VEGF. A complex network of proteins were involved in these pathways with certain proteins activating or inhibiting others through different mechanisms, and so proteins from both lists are expected to be found in common pathways.
Table 2.
KEGG pathways analysis of proteins that were present exclusively, or with statistically significant higher abundance, in activated PaSC.
| Pathway | # proteins | % of total proteins |
|---|---|---|
| Ribosome | 11 | 6.25% |
| Tight junction | 9 | 5.11% |
| Vascular smooth muscle contraction | 9 | 5.11% |
| Gap junction | 8 | 4.55% |
| GnRH signaling pathway | 7 | 3.98% |
| Insulin signaling pathway | 7 | 3.98% |
| Long-term depression | 7 | 3.98% |
| Long-term potentiation | 7 | 3.98% |
| ErbB signaling pathway | 6 | 3.41% |
| Spliceosome | 6 | 3.41% |
| T cell receptor signaling pathway | 6 | 3.41% |
| VEGF signaling pathway | 6 | 3.41% |
Table 3.
KEGG pathways analysis of proteins that were present exclusively, or with statistically significant higher abundance, in non-proliferating PaSC.
| Pathway | # proteins | % of total proteins |
|---|---|---|
| Regulation of actin cytoskeleton | 15 | 4.00% |
| Tight junction | 14 | 3.73% |
| Focal adhesion | 13 | 3.47% |
| Insulin signaling pathway | 10 | 2.67% |
| Lysosome | 9 | 2.40% |
| Glutathione metabolism | 8 | 2.13% |
| PPAR signaling pathway | 8 | 2.13% |
| T cell receptor signaling | 8 | 2.13% |
| Vascular smooth muscle contraction | 8 | 2.13% |
| Cardiac muscle contraction | 7 | 1.87% |
| Citrate cycle (TCA cycle) | 7 | 1.87% |
| ErbB signaling pathway | 7 | 1.87% |
| Fatty acid metabolism | 7 | 1.87% |
| GnRH signaling pathway | 7 | 1.87% |
| Propanoate metabolism | 7 | 1.87% |
| Valine, leucine and isoleucine degradation | 7 | 1.87% |
| Arginine and proline metabolism | 6 | 1.60% |
| Glioma | 6 | 1.60% |
| Long-term potentiation | 6 | 1.60% |
| VEGF signaling pathway | 6 | 1.60% |
DISCUSSION
We have successfully identified differentially-expressed proteins from an immortalized rat PaSC cell line in the presence and absence of FBS in the growth media using a GeLC-MS/MS-based strategy. In total, 1174 proteins are identified in activated PaSC and 1350 are identified in non-proliferating PaSC. Of these, 176 proteins are identified exclusively or determined to be of higher abundance with statistical significance in the activated cells. Analogously, for the non-proliferating cells (grown in serum free media), 375 proteins are exclusive to or determined to be of higher abundance with statistical significance in this cell state.
GO analysis reveals variations in both the cellular origin and molecular function of the differentially expressed proteins from each cohort. In terms of cellular origin, the most striking difference is the increase of proteins from ribonucleic complexes and endoplasmic reticulum in activated PaSC, while non-proliferating cells show a higher abundance of differentially-expressed proteins in the Golgi complex and the extracellular region. In terms of molecular function, activated cells have a larger proportion of nucleotide, protein, and nucleic acid binding proteins, while peptidases and ion binding proteins are predominant among the up-regulated proteins in the non-proliferating cells.
We investigate further the differentially expressed proteins by KEGG pathways analysis to gain insight into the dissimilarity in GO classifications between the two cell states. KEGG pathway analysis investigates the biomolecular pathways in which these proteins have been previously determined to have a role. In activated PaSC, protein synthesis, of which a major component is the ribosome, is the pathway with the greatest number of identified proteins. Similarly, we identify a high number of proteins in ribonucleic complexes and the endoplasmic reticulum, as well as the nucleotide and nucleic acid binding function by GO analysis of activated PaSC. Again, such a result indicates the importance of protein synthesis in the proliferating, activated PaSC, relative to their counterparts grown in serum-free media. When evaluating the GO and KEGG pathway analyses for the non-proliferating cells, there is also correlation, albeit less apparent than for the activated cells. Regulation of actin cytoskeleton, focal adhesion, and lysosome (proteolytic) pathways are those with the greatest number of proteins that are of statistically significant higher abundance in the non-proliferating cells. The lysosomal enzymes are particularly relevant as peptidases also appear to be up-regulated in activated PaSC according to GO analysis. The morphological changes occurring during the conversion of PaSC from activated to non-proliferating may be a result of proteins involved in the regulation of actin cytoskeleton and focal adhesion. It cannot be concluded, without further supporting evidence, that the pathways under consideration are being positively or negatively regulated by the identified proteins, but rather that these proteins are present in the pathway in some capacity. Similarly, the implication of these pathways in pancreatic fibrosis will require further study to understand better these cellular mechanisms.
Protein quantitation is an important aspect of our analysis, as the mere presence or absence of a protein is not the sole indicator of differential expression. It follows that one or more proteins present at a lower or higher level relative to another state could drive the cellular machinery in an alternate direction. To quantify protein abundance in our study, we use the spectral counting approach that allows for label-free quantitation [27]. We choose this method of quantitative data analysis, as we had not performed a priori labeling. In addition, studies have demonstrated that there is a good linear correlation between relative protein abundance and sequence coverage, with a dynamic range of over two orders of magnitude [43]. Furthermore, spectral counting quantitation has been shown to be more reproducible and as having a higher dynamic range than peptide ion chromatogram-based quantitation [44].
Although we use the well-established and accepted spectral counting method for relative protein quantitation, other methods are available which can exploit multiplexing capabilities and allow for more robust protein quantitation. iTRAQ (isobaric tag for relative and absolute quantification) or TMT (tandem mass tag) labeling strategies [45, 46] may offer further advantages, as under ideal conditions all N-terminus and side-chain amines of peptides are labeled and, thus, quantifiable. Here peptide samples are covalently labeled with isobaric isotope-coded tags that fragment during the MS/MS process producing reporter ions of known masses for which intensities correlate to the abundance of the associated peptides, thus proteins, in a given sample. The multiplexing ability of these approaches allows for comparison of up to 8 different cell states/growth conditions. Another alternative labeling strategy, metabolic labeling of cell cultures, ensures that all proteins in the culture are labeled prior to digestion. SILAC (stable isotope labeling by/with amino acids in cell culture), for example, is the most commonly used and versatile of such methods and can quantitatively compare up to three [47] or even five [48] cell states in a single set of mass spectrometric analyses. Such strategies should be considered for future comparison of PaSC cell states.
As a result of PaSC becoming activated upon culturing, we are limited by the unavailability of a truly quiescent PaSC cell line for comparison with the activated PaSC cell line. This deficiency prompted us to exclude FBS from the growth media resulting in non-proliferating PaSC. At this time, we do not have evidence of whether or not these PaSC grown in serum-free media mimic the quiescent PaSC cell state, or if they are merely responding to stress associated from serum withdrawal. Although we did not notice fat droplets, we did see a significant increase in spectral counts for smooth muscle actin when comparing the two cell states. Further verification would be required to ensure that the isolated cells are indeed activated or quiescent. Such experiments would exploit the time window when freshly isolated quiescent PaSC may be harvested before the transition to activation. In particular, the work of Masamune, et al [41], has shown PaSC that have been freshly isolated and can remain in a non-proliferative state for 7 days in the presence of curcumin. Similarly, 25 hrs after plating, freshly isolated PaSC retain their lipid droplets, as work by Bachem, et al [49] has shown, and which has been supported by a study from Vonlaufen, et al [42]. It addition, Wehr et al [40] have shown recently that PaSC may remain quiescent when plated on collagen-I coated plates. It follows that further studies are needed compare the proteomes of the immortalized PaSC cell lines and those of freshly isolated PaSC for future analyses. Such experiments will confirm that the cell line can be indeed a surrogate for freshly isolated PaSC and that our findings may be translated directly to in vivo studies.
In addition, when the experiments described herein were performed, we were unaware of the availability of an immortalized human PaSC cell line. As the ultimate goal of understanding the molecular mechanisms of chronic pancreatitis is to develop a means of decreasing the burdens of the disease in humans, differences in the biomolecular mechanisms among species may confound certain findings. A cross-species proteomic comparison between the rat and human PaSC cell lines may be beneficial to alleviate such concerns. Nonetheless, the study of rodent models, which have stringently controlled genetics and experimental parameters, provides a conduit from which pharmacological studies can emerge and develop. Moreover, recently developed knockout rat technology may be of potential future use once specific proteins to be targeted are determined [50]. Furthermore, the methodology utilized herein is a valuable resource for analogous future investigations, including those involving human PaSC.
In conclusion, the propagation of PaSC in the presence and absence of fetal bovine serum (FBS) in tandem with GeLC-MS/MS analysis has laid the foundation for the elucidation of the molecular mechanisms which may have a role in the activation of PaSC. We have successfully identified and quantified proteins differentially expressed in activated and non-proliferating PaSC. Such work is in line with the long-term goal of understanding how this transition can be arrested or reversed in human pancreatic diseases, such as chronic pancreatitis. Proteins determined to be of greater abundance in activated PaSC include isoforms of actin (e.g., smooth muscle actin) and ribosomal proteins. Conversely, proteins determined to be more abundant in non-proliferating PaSC than in activated PaSC include signaling proteins MAP kinase 3 and Ras-related proteins. Furthermore, validation of our findings via an orthogonal methodology, such as western blotting and/or ELISA, may be performed at an individual protein level. In addition, mRNA expression profiling on tissues and/or isolated PaSC may be performed to further support our work [21, 51-53]. In conclusion, we have established a workflow that resulted in the identification of proteins and associated pathways which are potential targets for further studies investigating the proteome of PaSC.
Supplementary Material
Proteins identified exclusively in activated PaSC, and that were not identified in non-proliferating PaSC (ordered alphabetically).
Proteins identified exclusively in non-proliferating PaSC, and that were not identified in activated PaSC (ordered alphabetically).
Proteins determined to be of higher abundance (via QSPEC analysis) in activated PaSC compared to non-proliferating PaSC (ordered by decreasing Bayes factor).
Proteins determined to be of higher abundance (via QSPEC analysis) in non-proliferating PaSC compared to activated PaSC (ordered by decreasing Bayes factor).
Proteins determined to be common between the cell states and for which abundance differences are not statistically significant in activated and non-proliferating PaSC (ordered alphabetically).
Peptides identified by mass spectrometry analysis. The table lists the cell state (activated or non-proliferating), replicate number, protein % coverage, accession numbers, protein name, peptide confidence, peptide sequence, peptide post-translational modifications, missed cleavages, mass error, measured molecular weight (Da), measured mass-to-charge ratio (m/z: Th), theoretical molecular weight (Da), theoretical mass-to-charge ratio (Th), charge (z), and Paragon Score.
Acknowledgments
Funds were provided by the following NIH grants: 1 F32 DK085835-01A1) (JP), 1 R21 DK081703-01A2 (DC) and 5 P30 DK034854-24 (Harvard Digestive Diseases Center; DC). We would also like to thank members of the Steen Lab at Children’s Hospital Boston, in particular John FK Sauld and Dominic Winter for their technical assistance and critical reading of the manuscript.
LIST OF ABBREVIATIONS
- FBS
fetal bovine serum
- GeLC-MS/MS
SDS-PAGE (gel) coupled with liquid chromatography tandem mass spectrometry
- GO
gene ontology
- KEGG
Kyoto encyclopedia of genes and genomics
- PaSC
pancreatic stellate cells
Footnotes
AUTHOR CONTRIBUTIONS JP carried out the experiments and drafted the original manuscript. JP and DC conceived of the study. HS facilitated the proteomic experiments. JP, DC, RU, PB and HS participated in its design and coordination. All authors helped to draft the manuscript and approved the final manuscript.
COMPETING INTERESTS The authors declare no competing interests.
Publisher's Disclaimer: This is a PDF file of an unedited manuscript that has been accepted for publication. As a service to our customers we are providing this early version of the manuscript. The manuscript will undergo copyediting, typesetting, and review of the resulting proof before it is published in its final citable form. Please note that during the production process errors may be discovered which could affect the content, and all legal disclaimers that apply to the journal pertain.
Contributor Information
Joao A. Paulo, Department of Pathology, Children’s Hospital Boston, Boston, MA; Proteomics Center at Children’s Hospital Boston, Boston, MA; Center for Pancreatic Disease, Division of Gastroenterology, Hepatology and Endoscopy, Brigham and Women’s Hospital and Department of Medicine, Harvard Medical School, Boston, MA.
Raul Urrutia, Division of Gastroenterology and Hepatology, Gastroenterology Research Unit, Mayo Clinic and Foundation, Rochester, MN.
Peter A. Banks, Center for Pancreatic Disease, Division of Gastroenterology, Hepatology and Endoscopy, Brigham and Women’s Hospital and Department of Medicine, Harvard Medical School, Boston, MA.
Darwin L. Conwell, Center for Pancreatic Disease, Division of Gastroenterology, Hepatology and Endoscopy, Brigham and Women’s Hospital and Department of Medicine, Harvard Medical School, Boston, MA.
Hanno Steen, Department of Pathology, Children’s Hospital Boston and Harvard Medical School, Boston, MA; Proteomics Center at Children’s Hospital Boston, Boston, MA.
References
- 1.Kloppel G, Detlefsen S, Feyerabend B. Fibrosis of the pancreas: the initial tissue damage and the resulting pattern. Virchows Arch. 2004;445:1–8. doi: 10.1007/s00428-004-1021-5. [DOI] [PubMed] [Google Scholar]
- 2.Schneider A, Whitcomb DC. Hereditary pancreatitis: a model for inflammatory diseases of the pancreas. Best Pract Res Clin Gastroenterol. 2002;16:347–63. doi: 10.1053/bega.2002.0311. [DOI] [PubMed] [Google Scholar]
- 3.Masamune A, Shimosegawa T. Signal transduction in pancreatic stellate cells. J Gastroenterol. 2009;44:249–60. doi: 10.1007/s00535-009-0013-2. [DOI] [PubMed] [Google Scholar]
- 4.Omary MB, Lugea A, Lowe AW, Pandol SJ. The pancreatic stellate cell: a star on the rise in pancreatic diseases. J Clin Invest. 2007;117:50–9. doi: 10.1172/JCI30082. [DOI] [PMC free article] [PubMed] [Google Scholar]
- 5.Shimizu K. Mechanisms of pancreatic fibrosis and applications to the treatment of chronic pancreatitis. J Gastroenterol. 2008;43:823–32. doi: 10.1007/s00535-008-2249-7. [DOI] [PubMed] [Google Scholar]
- 6.Patel M, Fine DR. Fibrogenesis in the pancreas after acinar cell injury. Scand J Surg. 2005;94:108–11. doi: 10.1177/145749690509400205. [DOI] [PubMed] [Google Scholar]
- 7.Ellenrieder V, Schneiderhan W, Bachem M, Adler G. Fibrogenesis in the pancreas. Rocz Akad Med Bialymst. 2004;49:40–6. [PubMed] [Google Scholar]
- 8.Apte MV, Wilson JS. Mechanisms of pancreatic fibrosis. Dig Dis. 2004;22:273–9. doi: 10.1159/000082799. [DOI] [PubMed] [Google Scholar]
- 9.Masamune A, Kikuta K, Watanabe T, Satoh K, Hirota M, Hamada S, et al. Fibrinogen induces cytokine and collagen production in pancreatic stellate cells. Gut. 2009;58:550–9. doi: 10.1136/gut.2008.154401. [DOI] [PubMed] [Google Scholar]
- 10.Farrow B, Albo D, Berger DH. The role of the tumor microenvironment in the progression of pancreatic cancer. J Surg Res. 2008;149:319–28. doi: 10.1016/j.jss.2007.12.757. [DOI] [PubMed] [Google Scholar]
- 11.Aust S, Jager W, Kirschner H, Klimpfinger M, Thalhammer T. Pancreatic stellate/myofibroblast cells express G-protein-coupled melatonin receptor 1. Wien Med Wochenschr. 2008;158:575–8. doi: 10.1007/s10354-008-0599-7. [DOI] [PubMed] [Google Scholar]
- 12.Vonlaufen A, Apte MV, Imhof BA, Frossard JL. The role of inflammatory and parenchymal cells in acute pancreatitis. J Pathol. 2007;213:239–48. doi: 10.1002/path.2231. [DOI] [PubMed] [Google Scholar]
- 13.Mews P, Phillips P, Fahmy R, Korsten M, Pirola R, Wilson J, et al. Pancreatic stellate cells respond to inflammatory cytokines: potential role in chronic pancreatitis. Gut. 2002;50:535–41. doi: 10.1136/gut.50.4.535. [DOI] [PMC free article] [PubMed] [Google Scholar]
- 14.Apte MV, Haber PS, Darby SJ, Rodgers SC, McCaughan GW, Korsten MA, et al. Pancreatic stellate cells are activated by proinflammatory cytokines: implications for pancreatic fibrogenesis. Gut. 1999;44:534–41. doi: 10.1136/gut.44.4.534. [DOI] [PMC free article] [PubMed] [Google Scholar]
- 15.Deng X, Liang J, Lin ZX, Wu FS, Zhang YP, Zhang ZW. Natural taurine promotes apoptosis of human hepatic stellate cells in proteomics analysis. World J Gastroenterol. 2010;16:1916–23. doi: 10.3748/wjg.v16.i15.1916. [DOI] [PMC free article] [PubMed] [Google Scholar]
- 16.Bosselut N, Housset C, Marcelo P, Rey C, Burmester T, Vinh J, et al. Distinct proteomic features of two fibrogenic liver cell populations: hepatic stellate cells and portal myofibroblasts. Proteomics. 2010;10:1017–28. doi: 10.1002/pmic.200900257. [DOI] [PubMed] [Google Scholar]
- 17.Molleken C, Sitek B, Henkel C, Poschmann G, Sipos B, Wiese S, et al. Detection of novel biomarkers of liver cirrhosis by proteomic analysis. Hepatology. 2009;49:1257–66. doi: 10.1002/hep.22764. [DOI] [PMC free article] [PubMed] [Google Scholar]
- 18.Kim PK, Kim MR, Kim HJ, Yoo HS, Kim JS, Cho EH, et al. Proteome analysis of the rat hepatic stellate cells under high concentrations of glucose. Proteomics. 2007;7:2184–8. doi: 10.1002/pmic.200700051. [DOI] [PubMed] [Google Scholar]
- 19.Gressner OA, Weiskirchen R, Gressner AM. Biomarkers of liver fibrosis: clinical translation of molecular pathogenesis or based on liver-dependent malfunction tests. Clin Chim Acta. 2007;381:107–13. doi: 10.1016/j.cca.2007.02.038. [DOI] [PubMed] [Google Scholar]
- 20.Kawada N. Analysis of proteins dominantly expressed in hepatic stellate cells of activated phenotype. Methods Mol Med. 2005;117:371–9. doi: 10.1385/1-59259-940-0:371. [DOI] [PubMed] [Google Scholar]
- 21.Mathison A, Liebl A, Bharucha J, Mukhopadhyay D, Lomberk G, Shah V, et al. Pancreatic stellate cell models for transcriptional studies of desmoplasia-associated genes. Pancreatology. 2010;10:505–16. doi: 10.1159/000320540. [DOI] [PMC free article] [PubMed] [Google Scholar]
- 22.Choi H, Fermin D, Nesvizhskii AI. Significance analysis of spectral count data in label-free shotgun proteomics. Mol Cell Proteomics. 2008;7:2373–85. doi: 10.1074/mcp.M800203-MCP200. [DOI] [PMC free article] [PubMed] [Google Scholar]
- 23.Neubauer G, Mann M. Mapping of phosphorylation sites of gel-isolated proteins by nanoelectrospray tandem mass spectrometry: potentials and limitations. Analytical chemistry. 1999;71:235–42. doi: 10.1021/ac9804902. [DOI] [PubMed] [Google Scholar]
- 24.Steen H, Kuster B, Fernandez M, Pandey A, Mann M. Detection of tyrosine phosphorylated peptides by precursor ion scanning quadrupole TOF mass spectrometry in positive ion mode. Analytical chemistry. 2001;73:1440–8. doi: 10.1021/ac001318c. [DOI] [PubMed] [Google Scholar]
- 25.Shilov IV, Seymour SL, Patel AA, Loboda A, Tang WH, Keating SP, et al. The Paragon Algorithm, a next generation search engine that uses sequence temperature values and feature probabilities to identify peptides from tandem mass spectra. Mol Cell Proteomics. 2007;6:1638–55. doi: 10.1074/mcp.T600050-MCP200. [DOI] [PubMed] [Google Scholar]
- 26.Dong MQ, Venable JD, Au N, Xu T, Park SK, Cociorva D, et al. Quantitative mass spectrometry identifies insulin signaling targets in C. elegans. Science (New York, NY) 2007;317:660–3. doi: 10.1126/science.1139952. [DOI] [PubMed] [Google Scholar]
- 27.Choi H, Nesvizhskii AI. False discovery rates and related statistical concepts in mass spectrometry-based proteomics. Journal of proteome research. 2008;7:47–50. doi: 10.1021/pr700747q. [DOI] [PubMed] [Google Scholar]
- 28.Goodman SN. Toward evidence-based medical statistics. 1: The P value fallacy. Ann Intern Med. 1999;130:995–1004. doi: 10.7326/0003-4819-130-12-199906150-00008. [DOI] [PubMed] [Google Scholar]
- 29.Goodman SN. Toward evidence-based medical statistics. 2: The Bayes factor. Ann Intern Med. 1999;130:1005–13. doi: 10.7326/0003-4819-130-12-199906150-00019. [DOI] [PubMed] [Google Scholar]
- 30.Jeffreys H. Theory of probability. 3. Oxford: Clarendon Press; 1961. [Google Scholar]
- 31.Ashburner M, Ball CA, Blake JA, Botstein D, Butler H, Cherry JM, et al. Gene ontology: tool for the unification of biology. The Gene Ontology Consortium. Nat Genet. 2000;25:25–9. doi: 10.1038/75556. [DOI] [PMC free article] [PubMed] [Google Scholar]
- 32.Li D, Li JQ, Ouyang SG, Wu SF, Wang J, Xu XJ, et al. An integrated strategy for functional analysis in large-scale proteomic research by gene ontology. Progress in Biochemistry and Biophysics. 2005;32:1026–9. [Google Scholar]
- 33.Dong L, Jianqi L, Shuguang O, Songfeng W, Jian W, Yunping Z, et al. An integrated strategy for functional analysis in large scale proteomic research by gene ontology. Molecular & Cellular Proteomics. 2005;4:S34–S. [Google Scholar]
- 34.Bairoch A, Apweiler R, Wu CH, Barker WC, Boeckmann B, Ferro S, et al. The Universal Protein Resource (UniProt) Nucl Acids Res. 2005;33:D154–9. doi: 10.1093/nar/gki070. [DOI] [PMC free article] [PubMed] [Google Scholar]
- 35.Dennis G, Jr, Sherman BT, Hosack DA, Yang J, Gao W, Lane HC, et al. DAVID: Database for Annotation, Visualization, and Integrated Discovery. Genome biology. 2003;4:P3. [PubMed] [Google Scholar]
- 36.Huang da W, Sherman BT, Lempicki RA. Systematic and integrative analysis of large gene lists using DAVID bioinformatics resources. Nat Protoc. 2009;4:44–57. doi: 10.1038/nprot.2008.211. [DOI] [PubMed] [Google Scholar]
- 37.Kanehisa M, Goto S. KEGG: kyoto encyclopedia of genes and genomes. Nucleic acids research. 2000;28:27–30. doi: 10.1093/nar/28.1.27. [DOI] [PMC free article] [PubMed] [Google Scholar]
- 38.Ogata H, Goto S, Sato K, Fujibuchi W, Bono H, Kanehisa M. KEGG: Kyoto Encyclopedia of Genes and Genomes. Nucleic acids research. 1999;27:29–34. doi: 10.1093/nar/27.1.29. [DOI] [PMC free article] [PubMed] [Google Scholar]
- 39.Wixon J, Kell D. The Kyoto encyclopedia of genes and genomes--KEGG. Yeast. 2000;17:48–55. doi: 10.1002/(SICI)1097-0061(200004)17:1<48::AID-YEA2>3.0.CO;2-H. [DOI] [PMC free article] [PubMed] [Google Scholar]
- 40.Wehr AY, Furth EE, Sangar V, Blair IA, Yu KH. Analysis of the human pancreatic stellate cell secreted proteome. Pancreas. 2011;40:557–66. doi: 10.1097/MPA.0b013e318214efaf. [DOI] [PMC free article] [PubMed] [Google Scholar]
- 41.Masamune A, Suzuki N, Kikuta K, Satoh M, Satoh K, Shimosegawa T. Curcumin blocks activation of pancreatic stellate cells. J Cell Biochem. 2006;97:1080–93. doi: 10.1002/jcb.20698. [DOI] [PubMed] [Google Scholar]
- 42.Vonlaufen A, Phillips PA, Yang L, Xu Z, Fiala-Beer E, Zhang X, et al. Isolation of quiescent human pancreatic stellate cells: a promising in vitro tool for studies of human pancreatic stellate cell biology. Pancreatology. 2010;10:434–43. doi: 10.1159/000260900. [DOI] [PubMed] [Google Scholar]
- 43.Liu H, Sadygov RG, Yates JR., 3rd A model for random sampling and estimation of relative protein abundance in shotgun proteomics. Analytical chemistry. 2004;76:4193–201. doi: 10.1021/ac0498563. [DOI] [PubMed] [Google Scholar]
- 44.Zybailov B, Mosley AL, Sardiu ME, Coleman MK, Florens L, Washburn MP. Statistical analysis of membrane proteome expression changes in Saccharomyces cerevisiae. Journal of proteome research. 2006;5:2339–47. doi: 10.1021/pr060161n. [DOI] [PubMed] [Google Scholar]
- 45.Zieske LR. A perspective on the use of iTRAQ reagent technology for protein complex and profiling studies. Journal of experimental botany. 2006;57:1501–8. doi: 10.1093/jxb/erj168. [DOI] [PubMed] [Google Scholar]
- 46.Shadforth IP, Dunkley TP, Lilley KS, Bessant C. i-Tracker: for quantitative proteomics using iTRAQ. BMC genomics. 2005;6:145. doi: 10.1186/1471-2164-6-145. [DOI] [PMC free article] [PubMed] [Google Scholar]
- 47.Ong S-E, Blagoev B, Kratchmarova I, Kristensen DB, Steen H, Pandey A, et al. Stable Isotope Labeling by Amino Acids in Cell Culture, SILAC, as a Simple and Accurate Approach to Expression Proteomics. Mol Cell Proteomics. 2002;1:376–86. doi: 10.1074/mcp.m200025-mcp200. [DOI] [PubMed] [Google Scholar]
- 48.Molina H, Yang Y, Ruch T, Kim JW, Mortensen P, Otto T, et al. Temporal profiling of the adipocyte proteome during differentiation using a five-plex SILAC based strategy. Journal of proteome research. 2009;8:48–58. doi: 10.1021/pr800650r. [DOI] [PMC free article] [PubMed] [Google Scholar]
- 49.Bachem MG, Schneider E, Gross H, Weidenbach H, Schmid RM, Menke A, et al. Identification, culture, and characterization of pancreatic stellate cells in rats and humans. Gastroenterology. 1998;115:421–32. doi: 10.1016/s0016-5085(98)70209-4. [DOI] [PubMed] [Google Scholar]
- 50.Dolgin E. The knockout rat pack. Nat Med. 2010;16:254–7. doi: 10.1038/nm0310-254. [DOI] [PubMed] [Google Scholar]
- 51.Birnbaum DJ, Adelaide J, Mamessier E, Finetti P, Lagarde A, Monges G, et al. Genome profiling of pancreatic adenocarcinoma. Genes Chromosomes Cancer. 2011;50:456–65. doi: 10.1002/gcc.20870. [DOI] [PubMed] [Google Scholar]
- 52.Dusetti NJ, Tomasini R, Azizi A, Barthet M, Vaccaro MI, Fiedler F, et al. Expression profiling in pancreas during the acute phase of pancreatitis using cDNA microarrays. Biochem Biophys Res Commun. 2000;277:660–7. doi: 10.1006/bbrc.2000.3734. [DOI] [PubMed] [Google Scholar]
- 53.Friess H, Ding J, Kleeff J, Liao Q, Berberat PO, Hammer J, et al. Identification of disease-specific genes in chronic pancreatitis using DNA array technology. Ann Surg. 2001;234:769–78. doi: 10.1097/00000658-200112000-00008. discussion 78-9. [DOI] [PMC free article] [PubMed] [Google Scholar]
Associated Data
This section collects any data citations, data availability statements, or supplementary materials included in this article.
Supplementary Materials
Proteins identified exclusively in activated PaSC, and that were not identified in non-proliferating PaSC (ordered alphabetically).
Proteins identified exclusively in non-proliferating PaSC, and that were not identified in activated PaSC (ordered alphabetically).
Proteins determined to be of higher abundance (via QSPEC analysis) in activated PaSC compared to non-proliferating PaSC (ordered by decreasing Bayes factor).
Proteins determined to be of higher abundance (via QSPEC analysis) in non-proliferating PaSC compared to activated PaSC (ordered by decreasing Bayes factor).
Proteins determined to be common between the cell states and for which abundance differences are not statistically significant in activated and non-proliferating PaSC (ordered alphabetically).
Peptides identified by mass spectrometry analysis. The table lists the cell state (activated or non-proliferating), replicate number, protein % coverage, accession numbers, protein name, peptide confidence, peptide sequence, peptide post-translational modifications, missed cleavages, mass error, measured molecular weight (Da), measured mass-to-charge ratio (m/z: Th), theoretical molecular weight (Da), theoretical mass-to-charge ratio (Th), charge (z), and Paragon Score.