Abstract
Cholesterol is an essential constituent of all mammalian cell membranes and its availability is therefore a prerequisite for cellular growth and other functions. Several lines of evidence are now indicating an association between alterations of cholesterol homeostasis and cell cycle progression. However, the role of cholesterol in cell differentiation is still largely unknown. To begin to address this issue, in this study we examined changes in cholesterol metabolism and in the mRNA levels of proteins involved in cholesterol import and esterification (multi-drug resistance, MDR-3) and acylCoA: cholesterol acyltransferase (ACAT) and cholesterol export (caveolin-1) in Friend virus-induced erythroleukemia cells (MELC), in the absence or in the presence of the chemical inducer of differentiation, hexamethylene bisacetamide (HMBA). FBS-stimulated growth of MELC was accompanied by an immediate elevation of cholesterol synthesis and cholesterol esterification, and by an increase in the levels of MDR-3 and ACAT mRNAs. A decrease in caveolin-1 expression was also observed. However, when MELC were treated with HMBA, the inhibition of DNA synthesis caused by HMBA treatment, was associated with a decrease in cholesterol esterification and in ACAT and MDR-3 mRNA levels and an increase in caveolin-1 mRNA. Detection of cytoplasmic neutral lipids by staining MELC with oil red O, a dye able to evidence CE but not FC, revealed that HMBA-treatment also reduced growth-stimulated accumulation of cholesterol ester to approximately the same extent as the ACAT inhibitor, SaH. Overall, these results indicate for the first time a role of cholesterol esterification and of some related genes in differentiation of erythroid cells.
Key words: cholesterol, cholesterol esterification, erythroleukemia, differentiation.
Introduction
Cholesterol balance in cells is a function of the amount taken up from extracellular sources, the amount newly made by the cell, the amount stored as cholesterol esters (CE) and the amount removed by cholesterol acceptors like high density lipoprotein (HDL). Based on the notion that activation of cell growth imposes additional need for cellular cholesterol to support membrane synthesis, a potential mechanism contributing to abnormal growth might involve altered cellular sterol balance and/or metabolism. A relationship between cholesterol metabolism and tumoral growth has been previously shown in our laboratories in different animal models of tumors1,2 as well as in various types of human neoplasms,3–5 including leukemias.6 A constant finding of these studies was that tumors are characterized by specific pattern of cholesterol metabolism, namely an increase of cholesterol synthesis and an accumulation of CE in tumoral cells, and a corresponding decrease of HDL cholesterol in the plasma compartment. More recently, in vitro studies7–8 have provided a plausible association between cholesterol esterification and the control of cell cycle progression, indicating that cholesterol esterification may act by accelerating signal transduction pathways involved in cell cycle control.9 Several in vitro studies have shown that proliferation and differentiation are inversely correlated processes.10,11 Many cancers exhibit both loss of normal proliferation controls and a block in completing differentiation.12 In this context, Friend virus-induced erythroleukemia of mice give rise to permanent cell lines of transformed erythroid/megakaryocyte precursor cells that are blocked at about the proerythroblast/megaerythroblast stage of differentiation.13–17 Treatment of these murine erythroleukemia cell (MELC) lines with chemical inducers of differentiation such as hexamethylene bisacetamide (HMBA), causes them to reinitiate erythroid differentiation culminating in the synthesis of hemoglobin, terminal cell division, and loss of tumorigenicity.18–21 Such cell system offer an attractive opportunity to better explore the coordination of rate of cell proliferation and differentiation and cholesterol esterification. Therefore, we assayed the levels of newly synthesized cholesterol (free and ester), cholesterol esterification and the rate of growth during differentiation induced in MELC by HMBA. Cholesterol esterification is one of the mechanisms that cells use to control the amount of toxic free cholesterol (FC); under conditions of excess cholesterol, this is transported from the plasma membrane to the endoplasmic reticulum (ER) where is esterified.22,23
Several lines of evidence are now indicating that caveolin-1, the key structural protein of caveolae (cholesterol-rich membrane microdomains) and P-glycoprotein (P-gp), the product of the multidrug resistance (MDR-1 in humans and the MDR-3 in rodents) gene have inverse implications in the cholesterol metabolism of normal cells. The MDR gene is involved in the process of cholesterol esterification, being required for transport of FC from the plasma membrane to ER, the site of cholesterol esterification by acyl-CoA:cholesterol acyltransferase (ACAT).24,25 In contrast, caveolin-1 is required for translocation of cholesterol from the ER to the plasma membrane and is involved in cholesterol efflux.26–28
However, in spite of the fact that MDR and caveolin-1 are recognized as playing a major role in intracellular cholesterol ester metabolism, it is still unclear why during tumor growth, membrane cholesterol is preferentially shifted to the ER, leading to an accumulation of CE, rather than being released to the appropriate extra cellular HDL acceptor. These observations prompted us to investigate levels of ACAT-1, MDR-3, and caveolin-1 mRNAs during differentiation of MELC induced by HMBA.
Materials and Methods
Cell cultures, conditions for induction, and reagents
MELCs (derived from the 745/A strain) were grown in suspension using RPMI 1640 medium (Bio-Whittaker Europe, Verviers, Belgium) containing 2 mM glutamine and supplemented with 5% fetal bovine serum (FBS) Boehringer-Mannheim, Mannheim, Germany) at 37°C in a 5% CO2-humidified atmosphere. Cells were usually seeded at a density of 105 cells/mL and passaged every 4–5 days. Induction of MELC differentiation was carried out by supplementing cultures with 5 mM HMBA (Sigma, St. Louis, MO, USA).
At the start of the experiments, cells from the stock cultures were diluted and seeded at a density of l×105 cells/mL in 10% FBS. Unless otherwise indicated, cells were harvested at 0, 24, 48, 72, and 96 h after seeding.
Analysis of cellular growth
At the times indicated, cells supplemented with 10% FBS were washed with PBS, harvested with trypsin/EDTA (0.05%/0.02%) and cell number was counted using a Coulter counter. For the thymidine incorporation studies, cells were labelled with 3H-thymidine at 5 µCi/mL during the last 3 hours of incubation, and radioactivity incorporated into the DNA was determined by trichloroacetic acid precipitation of the cell lysate. Protein content was determined by Lowry et al.29
Cholesterol biosynthesis and esterification
To assess cholesterol biosynthesis, cells were incubated in medium containing 10% of FBS with (14C)acetate (final radioactivity of 7.4 MBq/mL) for 4 hours at 37°C in a CO2 incubator. To assess cholesterol esterification, cells were incubated for 4 h at 37°C with (14C)oleic acid (specific activity of 2.22 GBq/mmol, final radioactivity of 0.185 MBq/mL; Amersham Biosciences) complex with BSA (essentially fatty acid-free; Sigma). Cells were washed, and lipids were extracted and analyzed by thin layer chromatography (TLC) as described previously.9 Spots of cholesterol and cholesteryl oleate were identified by standards (Sigma), scraped, and counted in a β-counter.
RNA extraction, reverse transcription -PCR analysis
Total RNA was isolated from cells using the guanidine isothiocyanate phenol-chloroform extraction method.30 RNA yield was quantified spectrophotometrically and A260/A280 ratios determined. The integrity and accuracy of the spectrophotometric measurement of each RNA sample was assessed by electrophoresis of 1 µg on an ethidium bromide-stained, agarose minigel. Equal amounts of total RNA (0.5 µg) were reverse transcribed into cDNA using oligo dT. cDNA was subsequently amplified by the polymerase chain reaction (PCR) in the presence of specific primers according to the instructions provided by the manufacturer (GeneAmp RNA PCR Kit, Perkin-Elmer Cetus). The PCR was performed using the following primers and conditions: for MDR-3, 5′CATCAGCCCTGTTCTTGGACT3′, 5′GAGAT-GTTGGCCGTGATAGCT3 ′ (234-bp fragment); 94°C for 30 s, 58°C for 60 s, and 72°C for 60 s for 30 cycles. For ACAT-1, 5'TGCCTGAGC-TACTTCTACCCA3′, 5'CACGTAACGACAAGTCCA GGT3′ (266-bp fragment); 95°C for 30 s, 60°C for 30 s, and 72°C for 40 s, for 30 cycles. For caveolin-1, 5′CTACAAGCCCAACAACAAGGC 3′, 5′AGGAAGCTCTTGATGCACGGT 3′ (340 bp fragment); 965°C for 25 s, 58°C for 30 s, and 73°C for 50 s, for 30 cycles. For β-actin, 5′GCCTCTG-GTCGTACCACTGGC3′, 5′AGGGAGGAAGAGGAT-GCGGCA3′ (278 bp fragment); 95°C for 30 seconds, 59°C for 30 seconds, and 72°C for 45 seconds, for 30 cycles. Preliminary experiments demonstrated that using these PCR conditions the amount of product amplification to RNA relationship was linear for the cycle number used over the range 500–1500 ng of total RNA. Working in these conditions PCR products separated on agarose and stained with ethidium bromide were characterized by a major band of the predicted size (data not shown).
Blotting analysis
During PCR reaction the nonradioactive label Digoxigenin-11-dUTP (DIG; Boheringer Mannheim) was incorporated and immunode-tected with anti-digoxigenin Fab fragments conjugated to alkaline phosphatase and visualized with the chemiluminescence substrate CSPD®. Enzymatic dephosphorylation of CSPD® by alkaline phosphatase led to a light emission at a maximum wavelength of 477 nm which was recorded on X-ray films. The DNA fragments were separated by electrophoresis on agarose and then blotted onto a nylon membrane for 16 h in 10XSSC. The blot was exposed to X-ray film for 2–10 minutes. A Kodak Digital Science Band Scanner Image Analysis System containing HP ScanJet, ID Image Analysis Software assessed the intensity of the bands in the autoradiograms. The overall procedure was standardized by expressing the amount of PCR product for each target mRNA relative to the amount of product formed for β-actin. Since a low yield of PCR products is often obtained when cDNA segments are coamplified with an internal standard gene in the same tube, the relative levels of gene expression were determined by comparing the PCR products of the target cDNA and β-actin gene processed in separate tubes.
Microscopic analysis
For microscopic analysis, MELC, grown in suspension as described above, were treated with 5 mM HMBA or with 4 µM of the acyl amide ACAT inhibitor SaH 58-035 (SaH) kindly provided by Novartis Pharma AG, Basel, Switzerland and harvested after 72 h. To visualize the degree of cytoplasmic neutral lipid (NL) accumulation, MELC were washed three times with PBS, and fixed by soaking in 10% formalin. Cells were then treated with isopropyl alcohol (60%), washed, and stained with oil red O (ORO) (a lipid-soluble dye which stains NL, including CE, but not FC) and then counter-stained with Mayer's hematoxylin NL appear as bright red spots in the cytoplasm. Cells were imaged using a Leitz inverted-phase microscope fitted with a digital camera.
Statistical analysis
Data were reported as the average values±standard error (SE). Student's t-test, suitably computed by means of the grouped data method, was used, and a probability value of P<0.05 was regarded as statistically significant.
Results
Inhibition of cell growth of MELC by HMBA
When the rate of cell proliferation was analyzed, about 65% fewer cells were found in HMBA-induced cultures compared to uninduced after 3 days of culturing, when the cultures were approaching confluence (P<0.05) (Figure 1A). Similarly, the rate of 3H-thymidine incorporation was consistently higher in MELC than in HMBA-treated cells (Figure 1B). The increased ability to growth in MELC compared with HMBA-cells was also reflected in a higher content of proteins in the former compared with the latter (Figure 1C).
Figure 1.
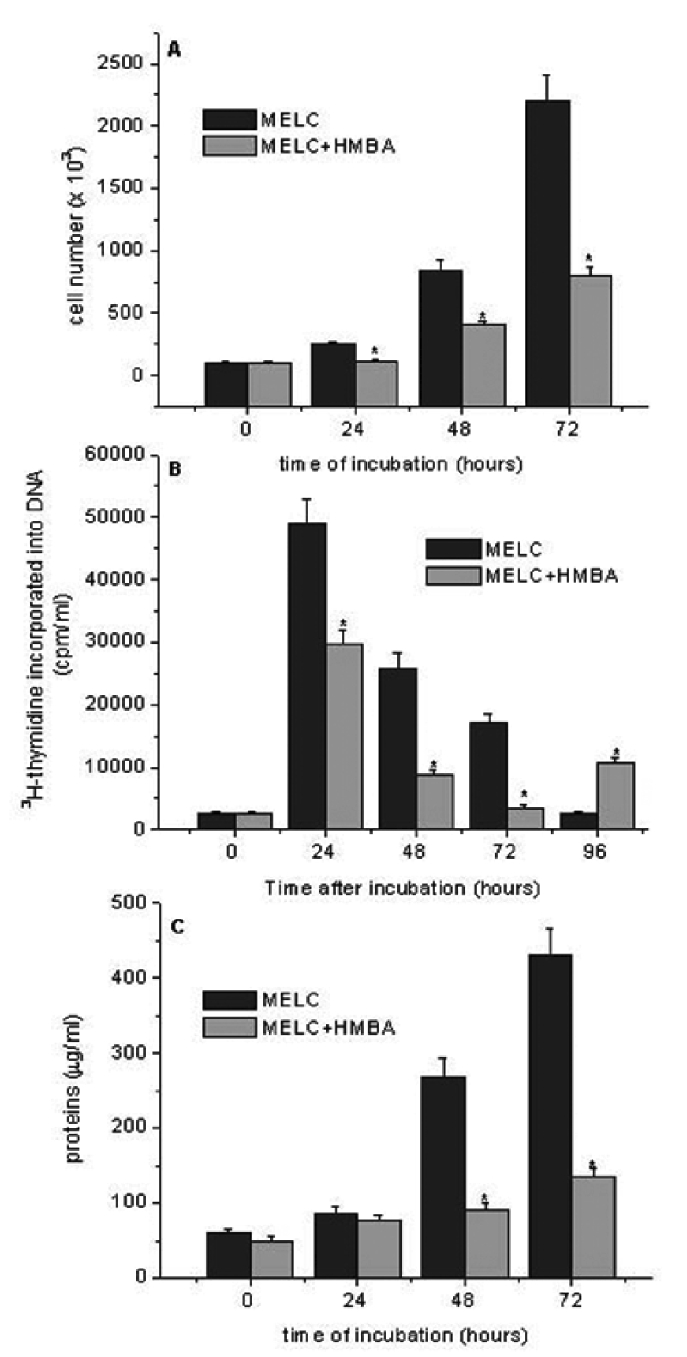
Time course of cell growth, 3H-thymidine incorporation and protein content in murine erythroleukemia cells (MELC) in presence or absence of hexamethylene bisacetamide (HMBA). MELC cells were seeded at a density of 1×10⁵ cells/mL and stimulated to growth by adding 10% FCS. At the indicated times A) cell number, B) 3H-thymidine incorporation and C) protein content were determined as described in Materials and Methods. Data are mean±Standard Error of three independent experiments, each performed in triplicate. *Indicates statistically significant (P<0.05) compared with MELC.
Inhibition of cholesterol esterification in MELC by HMBA
Cholesterol biosynthesis and esterification in MELC and HMBA-MELC were assessed as an indirect measure of changes in intracellular cholesterol content. The rate of (14C)acetate incorporation into FC in control cells was almost twice that in HMBA cells (P<0.05) (Figure 2A). When the rate of (14C)acetate incorporation into CE was assessed (Figure 2B), a 2-to 10-fold lower CE synthesis was observed in HMBA cells. Accordingly, the rate of (14C)oleic acid incorporation into CE in HMBA cells was at least 60% lower compared with that in uninduced MELC cells (P<0.05) (Figure 2C).
Figure 2.
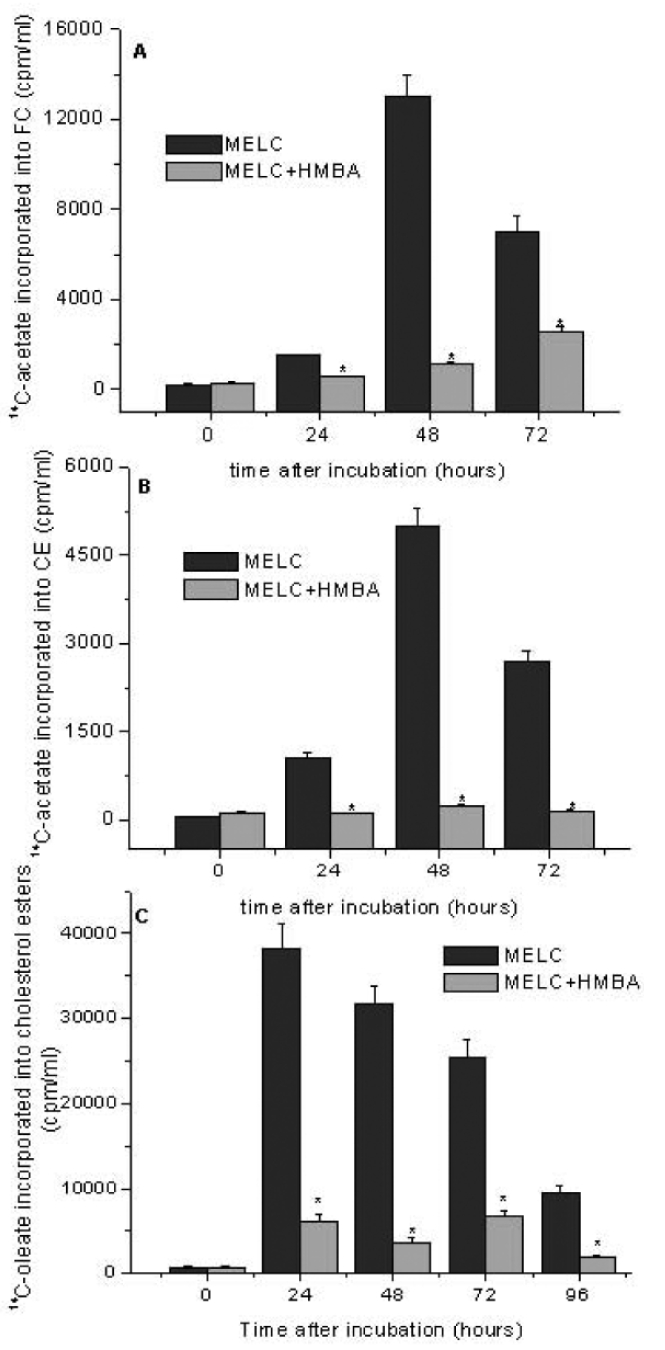
Time course of 14C-acetate incorporated into A) free cholesterol, B) colesterol esters and C) 14C-oleate incorporation into Colesterol Esters of murine erythroleukemia cells (MELC) in presence or absence of hexamethylene bisacetamide (HMBA). MELC cells were seeded at a density of 1×10⁵ cells/mL and stimulated to growth by adding 10% FCS 14C-acetate and 14C-oleate were added 3 h before each time point. MELC were harvested every 24 h for a total period of 96 h. Data are mean±Standard Error of three independent experiments, each performed in triplicate. *Indicates statistically significant (P<0.05) compared with MELC.
PCR analysis in MELC and HMBA-cells
To further evaluate the possibility that cholesterol esterification per se may be a limiting factor in determining cell growth and differentiation, we next evaluated in MELC and HMBA-cells, the expression of some genes implicated in the regulation of intracellular cholesterol trafficking: ACAT-1 and MDR-3, involved in the import of cholesterol, and caveolin-1, in the export. The detection of ACAT-1, MDR-3 and caveolin-1 mRNAs has been carried out by PCR on reverse transcripts, and analyses have revealed the occurrence of PCR products migrating at positions consistent with the expected size of 266 bp, 234-bp, 340 bp, respectively (data not shown). Growing MELCs were found to express relatively high levels of ACAT-1 and MDR-3 mRNAs, which significantly decreased during MELC induction to terminal division by 5 mM HMBA, (Figures 3 and 4 A and B). By contrast, caveolin-1 gene expression, powerfully suppressed in growing MELC, augmented in HMBA-induced cells (Figures 3 and Figure 4C).
Figure 3. Multidrug Resistance (MDR-1), Acyl-coenzyme A: Cholesterol Acyl Transferase (ACAT-1) and Caveolin-1 mRNA levels in murine erythroleukemia cells (MELC) and hexamethylene bisacetamide (HMBA)-induced MELC. The figure shows representative autoradiograms of MDR-1, ACAT-1, caveolin-1 (Cav-1) and β-actin mRNA in MELC and in HMBA treated MELC. Reverse transcription-polymerase chain reaction analysis was performed as described in Materials and Methods.
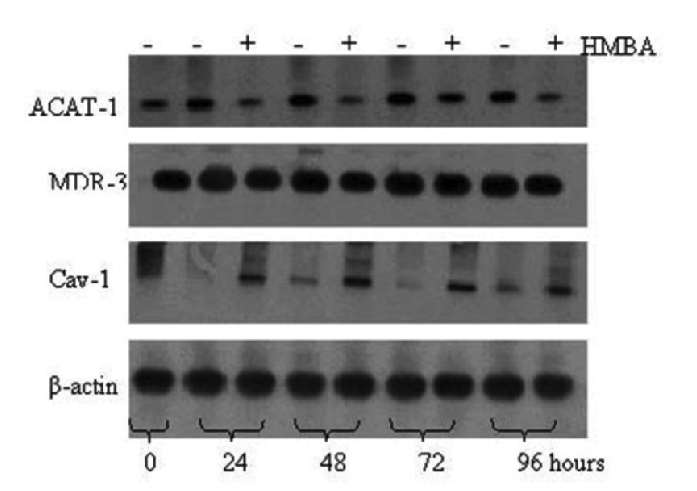
Figure 4.
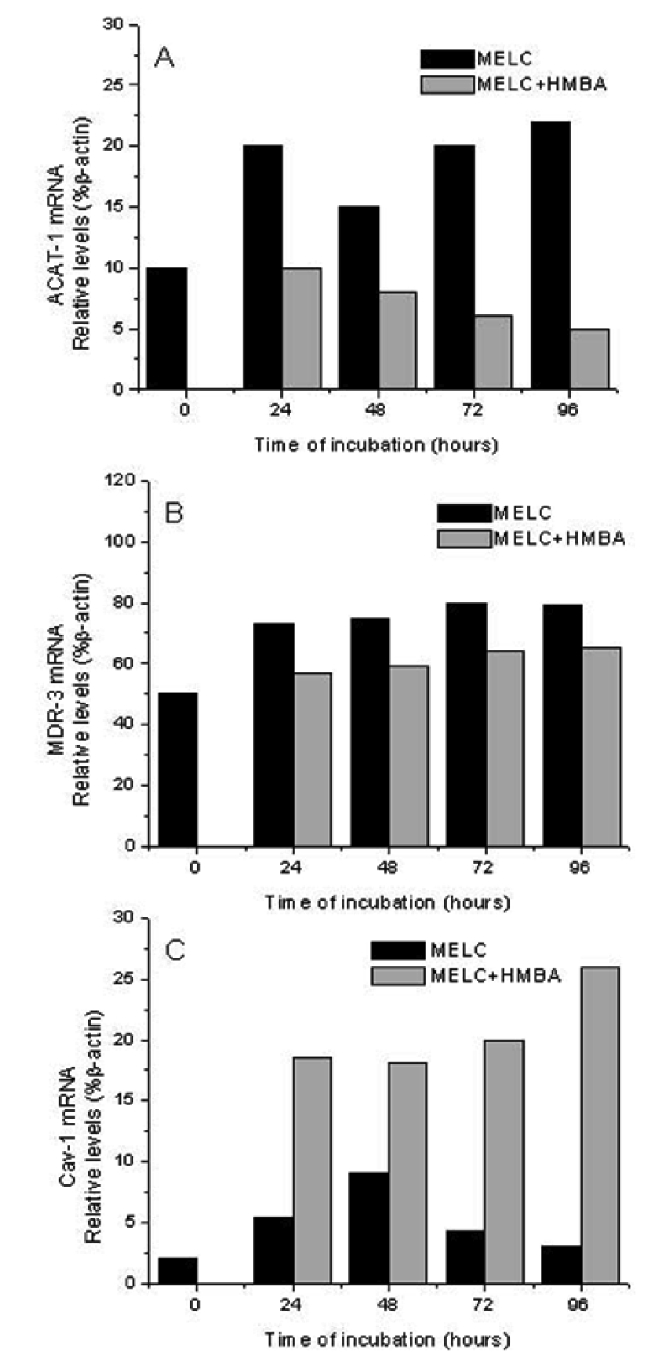
Relative levels of Acyl-coenzyme A: Cholesterol AcylTransferase (ACAT-1), Multidrug Resistance (MDR-3) and Caveolin-1 (C) mRNA in murine erythroleukemia cells (MELC). Reverse transcription-polymerase chain reaction analysis was performed for three independent experiments. Relative levels of A) ACAT-1, B) MDR-3 and C) Caveolin-1 (Cav-1) mRNA were normalized to the corresponding β-actin levels and expressed as percentage.
Microscopic analysis
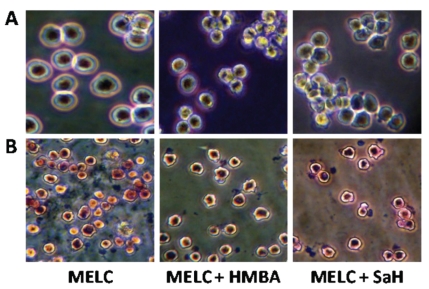
Finally, to examine the effects of pharmacological inhibition of cholesterol esterification on cell growth and differentiation, we compared the effects of HMBA with those of SaH 58-035 (SaH), a specific inhibitor of ACAT, especially with regard to morphologic and neutral lipid changes on MELC cultures. The results showed that, MELC, 72 h after SaH-treatment, are smaller and have smaller nuclei compared to untreated cells, in that resembling the 72 h HMBA-treated cells (Figure 5A). On the other hand, detection of cytoplasmic neutral lipids by staining MELC with ORO, a dye able to evidence CE but not FC, revealed that HMBA-treatment inhibits cholesterol ester accumulation in MELC to approximately the same extent as the ACAT inhibitor, SaH (Figure 5B).
Figure 5.
Photographs of murine erythroleukemia cells (MELC) cultures with or without treatment with hexamethylene bisacetamide (HMBA) and acyl amide ACAT inhibitor (SaH). A) Microphotographs taken by using an inverted microscopy of untreated or HMBA and SaH treated- MELC 72 h after culture. B) Microphotograpfs of the above cell cultures examined by inverted microscopy stained with ORO for neutral lipids and counter-stained with hematoxylin for nuclei.
Discussion
This study attempts to evaluate a possible role of cholesterol esterification in the regulation of cell growth and differentiation. To do this, we utilized MELC as a model of cell differentiation by using either uninduced or HMBA-induced cultures as actively proliferating or differentiating cell populations, respectively. It was found that cholesterol esterification is i) enhanced during active DNA synthesis and ii) inhibited concomitantly with pharmacologically-induced cell differentiation and growth arrest. Particularly, the rate of cholesterol esterification seems to parallel cellular replication and, actually, precedes the onset of DNA synthesis. Intracellular cholesterol transport are now receiving increasing attention as devices that cholesterol in specialized membrane platform called rafts could have a role in the regulation of a number of signal transduction pathways, including those involved in cell division and differentiation.31 Studies with cholesterol-depleted cells demonstrated that a reduced level of cholesterol in the rafts is by itself a signal to activate pathway leading to cell division.32,33 ACAT-1, MDR-3 and caveolin-1 are a part of the lipid transport system that counterbalances excessive intracellular cholesterol. It has been suggested that MDR-3 transports excess cholesterol from the plasma membrane to ER where it is esterified by ACAT.24,25 On the contrary, caveolin-1 transports cholesterol from ER to plasma membrane where it become the preferential source of cholesterol for efflux.27,28 As an essential component of caveolae, caveolin-1 is also involved in numerous signalling pathways.32–34 Involvement of these proteins in cholesterol trafficking makes them potential targets to improve our knowledge on the possible role of cholesterol esterification in stimulation of growth and differentiation. In this work, we demonstrate that down-regulation of ACAT-1 and MDR-3 and up-regulation of caveolin-1 in MELC are strictly correlated with cell differentiation induced by HMBA. These findings raise the possibility that MDR-3 and caveolin-1, might specifically influence raft-dependent signal transduction, at least in part, so reinforcing the possibility that cholesterol esterification, MDR-1, caveolin-1 and signal transduction may be closely linked. The view is consistent with the induction of MDR-3- and ACAT-1 and with the reduction of caveolin-1 mRNA in MELC cell growing, and with the opposite pattern observed in differentiating cells. Further studies are necessary to provide a complete mechanistic understanding of exactly how cholesterol esterification regulates cell differentiation, however, we could reach a tentative hypothesis: when cells are stimulated to divide, such as during tumorigenesis, the intracellular cholesterol increases, however it beside to be transported and distributed within the plasma membranes in lipid rafts, accumulate in the cytoplasm as CE. The consequent lower levels of FC into the rafts, by actively enhancing the integrated interchange of signaling molecules involved in cell division, such as Ras-MAPK cascade, may contribute to accelerate tumor progression.35 Conversely, when cells are stimulated to differentiation, the inhibition of cholesterol esterification, by increasing the expression of caveolin-1 and possibly FC content into the rafts, may lead to a reduction of signal transduction activation.32,33,35 Proliferating tumor cells, could be then reprogrammed to terminal division toward the mature phenotype with consequent loss of tumorigenicity.
Conclusions
The results of this study, other than to add new insights on the possible role of cholesterol metabolism during tumor growth, for the first time indicate a role of cholesterol esterification and of some related genes in differentiation of erythroid cells. These findings raise the possibility that cholesterol esterification and related genes may emerge as a successful therapeutic targets for disease characterized by a block in differentiation, i. e. leukemias.
Acknowledgements:
the authors gratefully acknowledge expert technical assistance by Anna Saba and Martina Ciuffo.
References
- 1.Rao KN, Kottapally S, Eskander ED, et al. Acinar cell carcinoma of rat pancreas: regulation of cholesterol esterification. Br J Cancer. 1986;54:305–10. doi: 10.1038/bjc.1986.177. [DOI] [PMC free article] [PubMed] [Google Scholar]
- 2.Dessí S, Batetta B, Anchisi C, et al. Cholesterol metabolism during the growth of a rat ascites hepatoma (Yoshida AH-130) Br J Cancer. 1992;66:787–93. doi: 10.1038/bjc.1992.361. [DOI] [PMC free article] [PubMed] [Google Scholar]
- 3.Dessi S, Batetta B, Pulisci D, et al. Altered pattern of lipid metabolism in patients with lung cancer. Oncology. 1992;49:436–44. doi: 10.1159/000227088. [DOI] [PubMed] [Google Scholar]
- 4.Dessì S, Batetta B, Pulisci D, et al. Cholesterol content in tumor tissues is inversely associated with high-density lipoprotein cholesterol in serum in patients with gastrointestinal cancer. Cancer. 1994;73:253–8. doi: 10.1002/1097-0142(19940115)73:2<253::aid-cncr2820730204>3.0.co;2-f. [DOI] [PubMed] [Google Scholar]
- 5.Dessì S, Batetta B, Pulisci D, et al. Total and HDL cholesterol in human hematologic neoplasms. Int J Hematol. 1991;54:483–6. [PubMed] [Google Scholar]
- 6.Batetta B, Bonatesta RR, Sanna F, et al. Cell growth and cholesterol metabolism in human glucose-6-phosphate dehydrogenase deficient lymphomononuclear cells. Cell Prolif. 2002;35:143–54. doi: 10.1046/j.1365-2184.2002.00231.x. [DOI] [PMC free article] [PubMed] [Google Scholar]
- 7.Batetta B, Mulas MF, Petruzzo P, et al. Opposite pattern of MDR-1 and caveolin-1 gene expression in human atherosclerotic lesions and proliferating human smooth muscle cells. Cell Mol Life Sci. 2001;58:1113–20. doi: 10.1007/PL00000925. [DOI] [PMC free article] [PubMed] [Google Scholar]
- 8.Pani A, Batetta B, Putzolu M, et al. MDR1, cholesterol certification and cell growth: a comparative study in normal and multidrug-resistant KB cell lines. Cell Mol Life Sci. 2000;57:1094–102. doi: 10.1007/PL00000745. [DOI] [PMC free article] [PubMed] [Google Scholar]
- 9.Batetta B, Mulas MF, Sanna F, et al. Role of cholesterol ester pathway in the control of cell cycle in human aortic smooth muscle cells. Faseb J. 2003;17:746–8. doi: 10.1096/fj.02-0396fje. [DOI] [PubMed] [Google Scholar]
- 10.Goto M, Masuda S, Saito H, Inui K. Decreased expression of P-glycoprotein during differentiation in the human intestinal cell line Caco-2. Biochem Pharmacol. 2003;66:163–70. doi: 10.1016/s0006-2952(03)00242-9. [DOI] [PubMed] [Google Scholar]
- 11.Martirosyan AR, Rahim-Bata R, Freeman AB, et al. Differentiation-inducing quinolines as experimental breast cancer agents in the MCF-7 human breast cancer cell model. Biochem Pharmacol. 2004;68:1729–38. doi: 10.1016/j.bcp.2004.05.003. [DOI] [PubMed] [Google Scholar]
- 12.Leow CC, Romero MS, Ross S, et al. Hath1, down-regulated in colon adenocarcinomas, inhibits proliferation and tumorigenesis of colon cancer cells. Cancer Res. 2004;64:6050–7. doi: 10.1158/0008-5472.CAN-04-0290. [DOI] [PubMed] [Google Scholar]
- 13.Cellai C, Laurenzana A, Vannucchi AM, et al. Specific PAF antagonist WEB-2086 induces terminal differentiation of murine and human leukemia cells. Faseb J. 2002;16:733–5. doi: 10.1096/fj.01-0602fje. [DOI] [PubMed] [Google Scholar]
- 14.Friend C. The phenomenon of differentiation in murine erythroleukemic cells. The Harvey Lect. 1976;72:253–81. [PubMed] [Google Scholar]
- 15.Friend C, Scher W, Holland JG, Sato T. Hemoglobin synthesis in murine erythroleukemia cells in vitro: stimulation of erythroid differentiation by dimethyl-sulfoxide. Proc Natl Acad Sci USA. 1971;68:378–82. doi: 10.1073/pnas.68.2.378. [DOI] [PMC free article] [PubMed] [Google Scholar]
- 16.Reuben RC, Wife RL, Breslow R, et al. A new group of potent inducers of differentiation in murine erythroleukemia cells. Proc Natl Acad Sci USA. 1976;73:862–6. doi: 10.1073/pnas.73.3.862. [DOI] [PMC free article] [PubMed] [Google Scholar]
- 17.Harrison PR. Analysis of erythropoiesis at molecular level. Nature. 1976;262:353–63. doi: 10.1038/262353a0. [DOI] [PubMed] [Google Scholar]
- 18.Marks PA, Rifkind RA. Erythroleukemic differentiation. Ann Rev Biochem. 1978;47:419–48. doi: 10.1146/annurev.bi.47.070178.002223. [DOI] [PubMed] [Google Scholar]
- 19.Marks PA, Rifkind RA. Differentiation modifiers. Cancer. 1984;54:2766–9. doi: 10.1002/1097-0142(19841201)54:2+<2766::aid-cncr2820541424>3.0.co;2-n. [DOI] [PubMed] [Google Scholar]
- 20.Waxman S, Cher W, Scher BM. Basic principles for utilizing combination differentiation agents. Cancer Detect Prev. 1986;9:395–407. [PubMed] [Google Scholar]
- 21.Marks PA, Richon VM, Kiyokawa H, Rifkind RA. Inducing differentiation of transformed cells with hybrid polar compounds: a cycle-dependent process. Proc Natl Acad Sci USA. 1994;91:10251–4. doi: 10.1073/pnas.91.22.10251. [DOI] [PMC free article] [PubMed] [Google Scholar]
- 22.Brown MS, Goldstein JL. A receptor-mediated pathway for cholesterol homeostasis. Science. 1986;232:34–47. doi: 10.1126/science.3513311. [DOI] [PubMed] [Google Scholar]
- 23.Brown MS, Ho YK, Goldstein JL. The cholesteryl ester cycle in macrophage foam cells. J Biol Chem. 1980;225:9344–52. [PubMed] [Google Scholar]
- 24.Metherall JE, Li H, Waugh K. Role of multidrug resistance p-glycoproteins in cholesterol biosynthesis. J Biol Chem. 1996;271:2634–40. doi: 10.1074/jbc.271.5.2634. [DOI] [PubMed] [Google Scholar]
- 25.Debry P, Nash EA, Neklason DW, Metherall JE. Role of multidrug resistance p-glycoproteins in cholesterol esterification. J Biol Chem. 1997;272:1026–31. doi: 10.1074/jbc.272.2.1026. [DOI] [PubMed] [Google Scholar]
- 26.Field FJ, Born E, Murthy S, Mathur SN. Caveolin is present in intestinal cells: role in cholesterol trafficking? J Lipid Res. 1998;39:1938–50. [PubMed] [Google Scholar]
- 27.Smart EJ, Ying Y, Donzell WC, Anderson RG. A role for caveolin in transport of cholesterol from endoplasmic reticulum to plasmamembrane. J Biol Chem. 1996;271:29427–35. doi: 10.1074/jbc.271.46.29427. [DOI] [PubMed] [Google Scholar]
- 28.Kurzchalia TV, Parton RG. Membrane microdomains and caveolae. Curr Op Cell Biol. 1999;11:424–31. doi: 10.1016/s0955-0674(99)80061-1. [DOI] [PubMed] [Google Scholar]
- 29.Lowry OH, Rosebrough NJ, Farr AL, Randall RJ. Protein measurement with the Folin-Phenol reagents. J Biol Chem. 1951;193:265–75. [PubMed] [Google Scholar]
- 30.Chromczynsky P, Sacchi N. Single-step method of RNA isolation by acid guanidium thiocianate-phenol-chlorophorm extraction. Ann Biochimi. 1987;162:156–9. doi: 10.1006/abio.1987.9999. [DOI] [PubMed] [Google Scholar]
- 31.Patra S K. Dissecting lipid raft facilitated cell signaling pathways in cancer. Biochim. Biophys. Acta. 2008;1785:182–206. doi: 10.1016/j.bbcan.2007.11.002. [DOI] [PubMed] [Google Scholar]
- 32.Fielding PE, Fielding CJ. Plasma membrane caveolae mediate the efflux of cellular free cholesterol. Biochemistry. 1995;34:14288–92. doi: 10.1021/bi00044a004. [DOI] [PubMed] [Google Scholar]
- 33.Roy S, Luetterforst R, Harding A, et al. Dominant-negative caveolin inhibits H-RAS function by disrupting cholesterolrich plasma membrane domain. Nat Cell Biol. 1999;1:98–105. doi: 10.1038/10067. [DOI] [PubMed] [Google Scholar]
- 34.Incardona JP, Eaton S. Cholesterol in signal transduction. Curr Op Cell Biol. 2000;12:193–203. doi: 10.1016/s0955-0674(99)00076-9. [DOI] [PubMed] [Google Scholar]
- 35.Bethani I, Skånland SS, Dikic I, Acker-Palmer A. Spatial organization of transmembrane receptor signalling. EMBO J. 2010;29:2677–88. doi: 10.1038/emboj.2010.175. [DOI] [PMC free article] [PubMed] [Google Scholar]


