

Abstract
2′,3′-O-(2,4,6-Trinitrophenyl) adenosine 5′-triphosphate (TNP-ATP) is a fluorescent analogue of ATP. MgTNP-ATP was found to be an allosteric activator of pyruvate carboxylase that exhibits competition with acetyl CoA in activating the enzyme. There is no evidence that MgTNP-ATP binds to the MgATP substrate binding site of the enzyme. At concentrations above saturating, MgATP activates bicarbonate-dependent ATP cleavage, but inhibits the overall reaction. The fluorescence of MgTNP-ATP increases by about 2.5 fold upon binding to the enzyme and decreases on addition of saturating acetyl CoA. However, not all the MgTNP-ATP is displaced by acetyl CoA, or with a combination of saturating concentrations of MgATP and acetyl CoA. The kinetics of the binding of MgTNP-ATP to pyruvate carboxylase have been measured and shown to be triphasic, with the two fastest phases having pseudo first-order rate constants that are dependent on the concentration of MgTNP-ATP. The kinetics of displacement from the enzyme by acetyl CoA have been measured and also shown to be triphasic. A model of the binding process is proposed that links the kinetics of MgTNP-ATP binding to the allosteric activation of the enzyme.
Keywords: pyruvate carboxylase; allosteric activation; 2′,3′-O-(2,4,6-trinitrophenyl) adenosine 5′-triphosphate; fluorescence stopped-flow
Introduction
1Pyruvate carboxylase is a biotin-dependent enzyme that catalyses the formation of oxaloacetate for the purposes of gluconeogenesis in the liver and replenishment of tricarboxylic acid cycle intermediates in certain tissues (for reviews see [1, 2]). The overall reaction occurs in two partial reactions (see Fig. 1). In reaction (1), which occurs in the biotin carboxylation (BC) domain, bicarbonate is activated by phosphorylation to form a putative carboxyphosphate intermediate with concomitant cleavage of MgATP. The 1′N of biotin is then carboxylated, presumably in a reaction with carbon dioxide formed from the reversible decarboxylation of the carboxyphosphate. Carboxybiotin then moves to the carboxyl transfer (CT) domain where reaction (2) occurs, in which there is carboxyl transfer from carboxybiotin to pyruvate and proton transfer from pyruvate to biotin (for reviews on the mechanism of pyruvate carboxylase see [2-4]).
Figure 1.
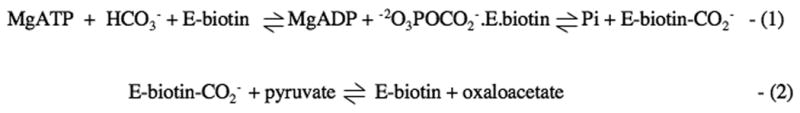
In pyruvate carboxylase, reaction (1) occurs at the biotin carboxylation (BC) domain and involves the ATP-dependent activation of bicarbonate to form a putative carboxyphosphate intermediate, from which the enzymic biotin is then carboxylated to form the enzyme-carboxybiotin complex. The carboxybiotin on the biotin carboxyl carrier protein (BCCP) domain then moves to the carboxyl transfer (CT) domain of its partner subunit where the carboxy group is transferred to pyruvate to form oxaloacetate in reaction (2).
The activity of pyruvate carboxylases from many organisms, including vertebrates, some fungi and some bacteria is allosterically regulated by acyl CoAs, principally acetyl CoA. Many pyruvate carboxylases from these organisms show only low levels of activity in the absence of acetyl CoA. Acetyl CoA has been shown to stabilise the tetrameric structure of the enzyme (α4 in the majority of cases) [5-9]. The locus of the effects of acetyl CoA on the mechanism of the reaction appears to be primarily on reaction (1) [10-15].
Until the recent publication of the structures of pyruvate carboxylases from Rhizobium etli [16] (RePC) and Staphylococcus aureus [17], it had been assumed that the subunits comprising the enzymic tetramer operated independently. However, it is apparent that the subunits operate in pairs, with inter-subunit catalysis occurring within these pairs [16, 17]. The CT domain of one subunit catalyses the transfer of the carboxyl group to pyruvate from the carboxybiotin of its partner subunit [16, 17]. The structure of RePC was determined in the presence of the stable analogue of acetyl CoA, ethyl CoA, with only two of the four subunits having ethyl CoA bound in the allosteric effector site. More importantly, only the pair of subunits with ethyl CoA bound were in a conformation that appeared more conducive for inter-subunit catalysis [16], raising the possibility that pyruvate carboxylase exhibits half-of-the-sites reactivity. There is evidence that another biotin–dependent carboxylase, E. coli acetyl CoA carboxylase, operates in this way. The homodimeric biotin carboxylase subunits of this enzyme appear to show half-of-the-sites reactivity, with obligatory switching of activity between the two subunits [18-20]. However, a recent structure of the Staphylococcus aureus enzyme complexed with a single CoA molecule in each of the allosteric sites was determined [21].
The original aim of this work was to investigate nucleotide binding to RePC by using a fluorescent analogue of ATP, viz 2′,3′-O-(2,4,6-trinitrophenyl) adenosine 5′-triphosphate (TNP-ATP) (see Fig. 2). However, we found that MgTNP-ATP activates the enzyme in a similar way to acetyl CoA and by measuring the increase in fluorescence associated with MgTNP-ATP binding to the enzyme, we have been able to probe the connection between activator binding and this activation. In this paper we also report the characteristics of the activation of the bicarbonate-dependent ATP cleavage catalysed by RePC at concentrations above those required to saturate the enzyme with MgATP as a substrate, or, more simply super-catalytic concentrations of MgATP.
Figure 2.
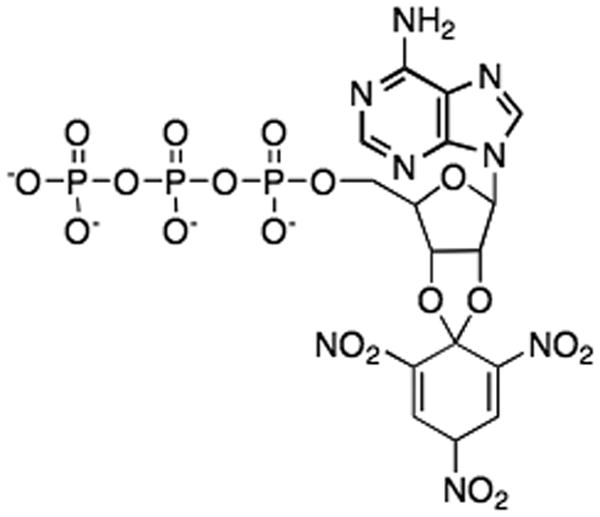
Structure of 2′,3′-O-(2,4,6-Trinitrophenyl) adenosine 5′-triphosphate (TNP-ATP)
Experimental Procedures
Expression and purification of RePC in E. coli
BL21(DE3) were transformed with the pET-17b (His)9 RePC plasmid [16] or R472S mutant and the pCY216 plasmid containing E. coli biotin protein ligase (BirA) [22] for expression. R472S mutant was constructed by site-directed mutagenesis using RePC WT sequence as the template as previously described (15). The mutagenic primers used were K472S-F (5′-aagcgccaggactctgcgacgaagctt -3′, bold indicates the codon changed for serine) and K472S-R (5′-aagcttcgtcgcagagtcctggcgctt-3′). The nucleotide sequence of the mutant was verified by DNA sequencing. Wild-type and R472S RePC were overexpressed in 8 L batch cultures of LB media (containing 200 μg ml-1 ampicillin, 30 μg ml-1 chloramphenicol, 1 mg L-1 biotin and 25% w/v arabinose) which were inoculated with an overnight culture of the freshly transformed E. coli BL21(DE3)cells. Large-scale fermentations were carried out in a 10 L carboy equipped with an air inlet hose, which was connected to the house air line and fitted with a gas diffusion stone to ensure proper aeration and agitation of the media throughout growth and induction. Batch cultures were grown at 37° C to an OD600 = 0.9-1.2. They were then chilled on ice for 20 min before IPTG was added to a final concentration of 0.1 mM in the carboy, prior to transferring to a 16° C water bath for approximately 48 h. Cells were harvested by centrifugation, yielding about 80 g of cell paste. RePC was purified using Co2+-affinity chromatography [16]. The purified enzyme was stored in 0.1 M Tris-Cl, pH7.8 containing 30% glycerol at -80°C after being flash frozen in liquid nitrogen.
Estimation of biotin concentration in pyruvate carboxylase
Biotin concentrations of the enzyme solutions were determined by subjecting the enzyme to proteolysis as described previously [23]. The biotin content of the hydrolysates was then assayed according to the method described by Rylatt et al. [24]. Enzyme concentrations used are expressed in terms of the biotin concentration.
Pyruvate carboxylation assays
Assays were performed at 30°C in 0.1 M Tris-Cl, pH7.8 in the presence of 20 mM NaHCO3, 6 mM MgCl2, 1 mM ATP and 10 mM pyruvate. Oxaloacetate formation was measured by coupling with malate dehydrogenase (11 units mL-1) and 0.24 mM NADH. Assays were performed in the presence or absence of varying concentrations of acetyl CoA at different fixed concentrations of MgTNP-ATP (Jena Bioscience). To assess the effect of super-catalytic concentrations of MgATP on the reaction, MgATP was the varied substrate and reactions were performed with no acetyl CoA present. Apparent kcat values were calculated by dividing the measured reaction velocity by the biotin concentration of the RePC used in the assay.
Bicarbonate-dependent ATP-cleavage assays
Assays were performed as described previously [25]. Briefly, the reactions contained 0.1 M Tris-HCl, pH 7.8, 2.5 mM MgATP, 2.5 mM MgCl2, 20 mM NaHCO3, 0.33 mM NADP, 0.25 mM acetyl-CoA, 5 μM α-glucose-1-phosphate, 1 mg mL-1 glycogen, 2 units mL-1 phosphorylase a, 3 units mL-1 phosphoglucomutase and 3 units mL-1 glucose-6-phosphate dehydrogenase. Production of NADPH was determined by measuring the increase in absorbance at 340 nm. Apparent kcat values were calculated by dividing the measured reaction velocity by the biotin concentration of the RePC used in the assay.
Fluorescence emission spectra
Fluorescence emission spectra of MgTNP-ATP were recorded on a Cary spectrofluorometer with an excitation wavelength of 408 nm and emissions recorded between 500 and 600 nm. Experiments were performed at 30°C in 0.1 M Tris-Cl, pH7.8 and 20 mM NaHCO3, with 5 μM MgTNP-ATP. Spectra were recorded in the presence of 10 μM enzyme in the presence and absence of 0.25 mM acetyl CoA, with and without 2.5 mM MgATP.
Stopped-flow measurements of fluorescence changes associated with MgTNP-ATP binding to pyruvate carboxylase and displacement of bound MgTNP-ATP by acetyl CoA
All measurements were performed on a KinTek SF-2400 instrument with an excitation wavelength of 408 nm and emission was measured at wavelengths greater than 500 nm, using a cut-on filter that passes light of wavelengths greater than 500 nm. The dead-time of the instrument is 0.9 ± 0.04 ms, determined as described by KinTek (http://www.kintek-corp.com/misc/deaddata.html). Measurements were recorded at 30°C and reactions contained 0.1 M Tris-Cl, pH7.8, 20 mM NaHCO3, with 0.5 μM pyruvate carboxylase and at least a 20-fold molar excess of MgTNP-ATP over the concentration of RePC in the binding experiments. In the experiments where the kinetics of MgTNP-ATP displacement by acetyl CoA were measured, 0.5 μM enzyme was used with 10 μM MgTNP-ATP and 0.1-0.5 mM acetyl CoA. The linearity of the fluorescence signal with MgTNP-ATP concentration was determined experimentally on the SF-2400 instrument. The signal was linear up to 20 μM and correction factors of 1.07, 1.15 and 1.2 were calculated at 25, 30 and 35 μM MgTNP-ATP respectively (see Fig. S1 in supplementary material).
Measurement of stoichiometry of MgTNP-ATP binding to pyruvate carboxylase
Measurement of the binding stoichiometry was attempted by two methods, the first was equilibrium dialysis in which a dialysis apparatus was used that had two-compartments, separated by a semi-permeable membrane that prevented movement of the enzyme between the compartments but allowed the free movement of MgTNP-ATP. Both compartments initially contained the same concentration of MgTNP-ATP but only one compartment contained pyruvate carboxylase at concentrations up to 18 μM. The solutions in both compartments contained 0.1 M Tris-Cl,, pH 7.8 and 20 mM NaHCO3 and were stirred with magnetic stirrer bars for 30 min at 30°C (sufficient to equilibrate from a situation where MgTNP-ATP was only present in one compartment, with buffer in the other). The absorbance of the solution in the compartment without enzyme was then measured at 408 nm and compared to the initial absorbance to calciulate the change in concentration of MgTNP-ATP. We were unable to obtain sufficiently high concentrations of pyruvate carboxylase to give large enough changes in absobance to produce reliable stoichiometric data.
Analysis of kinetic data
Activation of pyruvate carboxylation by either acetyl CoA or MgTNP-ATP was analysed by nonlinear least-squares regression fitting of the data to equation (i), which was derived for the reaction scheme shown in Fig. 3a.
Figure 3.
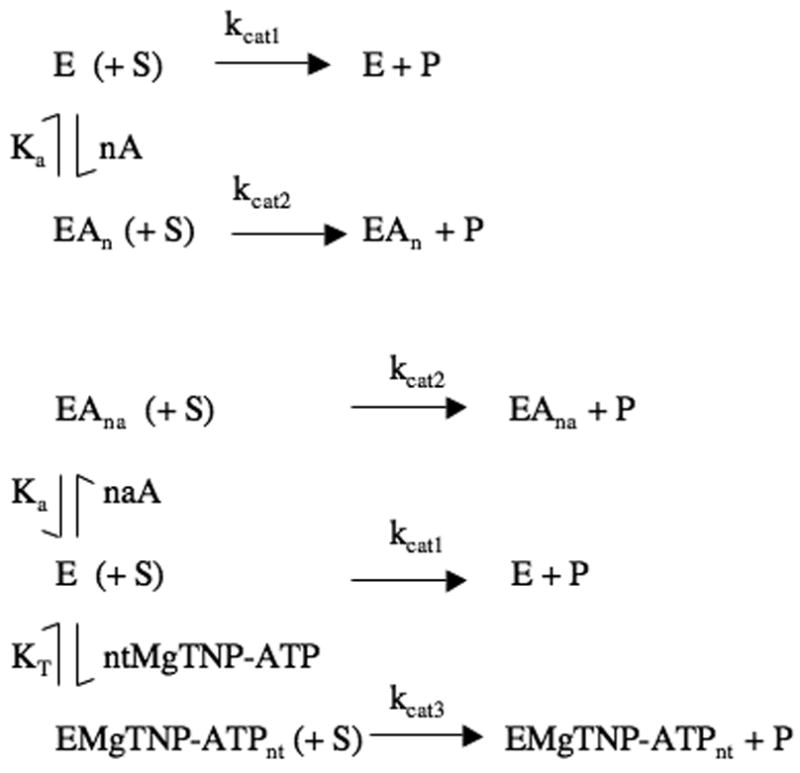
(a) Reaction scheme for the pyruvate carboxylation reaction in the presence of saturating substrates, accounting for the activation by acetyl CoA (A), where kcat1 and kcat2 are the catalytic rate constants for the reaction by the enzyme (E) and the enzyme-acetyl CoA complex (EAn) respectively. Ka is the apparent dissociation constant of the EAn complex and n is the Hill coefficient for the activation process. (b) Reaction scheme for the pyruvate carboxylation reaction in the presence of saturating substrates and both acetyl CoA and MgTNP-ATP, where kcat1, kcat2 and kcat3 are the catalytic rate constants for the reaction catalysed by the enzyme (E), the enzyme-acetyl CoA complex (EAna) and the enzyme-MgTNP-ATP complex (EMgTNP-ATPnt) respectively. Ka is the apparent dissociation constant of the EAn complex and na is the Hill coefficient for the activation by acetyl CoA. KT is the apparent dissociation constant of the EMgTNP-ATPnt complex and nt is the Hill coefficient for the activation by MgTNP-ATP.
| (i) |
where: kcat1 is the catalytic rate constant of the reaction in the absence of either acetyl CoA or MgTNP-ATP; kcat2 is the catalytic rate constant of the reaction in the presence of saturating concentrations of acetyl CoA or MgTNP-ATP; Ka is the activation constant for acetyl CoA or MgTNP-ATP; n is the Hill coefficient of cooperativity; [A] is the concentration of either acetyl CoA or MgTNP-ATP.
The activation of pyruvate carboxylation activity in the presence of varying concentrations of acetyl CoA at different fixed concentrations of MgTNP-ATP was analysed by non-linear least-squares regression fitting of the data to equation (ii) derived from the reaction scheme shown in Fig. 3b.
| (ii) |
where: kcat1 is the catalytic rate constant of the reaction in the absence of both acetyl CoA and MgTNP-ATP; kcat 2 is the catalytic rate constant of the reaction at saturating concentrations of acetyl CoA; kcat3 is the catalytic rate constant of the reaction in the presence of saturating concentrations of MgTNP-ATP; Ka is the activation constant for acetyl CoA; KT is the activation constant for MgTNP-ATP; na is the Hill coefficient for acetyl CoA activation; nt is the hill coefficient for MgTNP-ATP activation; [AcCoA] is the concentration of acetyl CoA.
Data for determining the effects of super-catalytic MgATP concentrations on the pyruvate carboxylation reaction in the absence of acetyl CoA were analysed by non-linear least-squares regression fitting of the data to equation (iii) which describes substrate inhibition.
| (iii) |
Data which examined the effects of super-catalytic MgATP concentrations on the bicarbonate-dependent ATP cleavage reaction in the absence of acetyl CoA was analysed by non-linear least-squares regression fitting of the data to equation (iv):
| (iv) |
where kcat0 is the catalytic rate constant of the reaction at catalytically saturating [MgATP], kcat1 is the catalytic rate constant of the reaction induced following maximal activation by MgATP of the enzyme, Ka is the activation constant for this process and n is the Hill coefficient for activation of the reaction by MgATP.
Stopped-flow data were analysed by non-linear least squares regression fits of the data to single or double exponential equations. The plot of kobs vs [MgTNP-ATP] for the fast phase of binding was analysed by linear least-squares regression to equation (v) or by non-linear least squares regression to equation (vi).
| (v) |
| (vi) |
whilst that for the intermediate phase was analysed by non-linear least squares regression, fitting to the equations (vii-xii).
| (vii) |
| (viii) |
| (ix) |
| (x) |
| (xi) |
| (xii) |
where K1 is the dissociation constant of the enzyme.(MgTNP-ATP)n complex formed in the fast phase of the reaction, where n=1 or 2 and is equal to k-1/k1 where k1 is the second- or third-order binding rate constant for the formation of the complex and k-1 is the first order dissociation rate constant of the complex. In (vii and viii), k2 is a first-order rate constant describing a conformational change leading to an increase in fluorescence of the enzyme.MgTNP-ATP complex whilst k-2 is the reverse first-order rate constant. In (ix and x), k2 is the second-order rate constant for further binding of MgTNP-ATP and k-2 is the dissociation constant of this complex, whilst in (xi and xii) k2 is a third-order rate constant for the further binding of two molecules of MgTNP-ATP. Thus equations (vii, ix and xi) describe reactions in which a single MgTNP-ATP molecule binds in the fast phase, followed by either a conformational change, binding of a further MgTNP-ATP or binding of a further two MgTNP-ATP molecules respectively, This also applies to equations (viii, x and xii) except that in the fast phase two molecules of MgTNP-ATP bind. All equations were derived with the assumption that the reaction represented by the fast phase remains essentially at equilibrium throughout the intermediate phase, which is not unreasonable given the large difference in the magnitudes of the observed rate constants for the two phases.
Where values of kinetic parameters are quoted in the text they are the values derived from the non-linear regression analyses ± the standard error of these estimates, unless otherwise indicated.
Results
MgTNP-ATP as substrate of pyruvate carboxylase or inhibitor with respect to MgATP
MgTNP-ATP was not found to be a substrate in the overall pyruvate carboxylation reaction at concentrations up to 0.25 mM. In addition, no inhibition of enzymic activity by 1 mM MgTNP-ATP was observed over a wide range of MgATP concentrations in the presence of saturating concentrations of the other substrates and of acetyl CoA.
Activation of the pyruvate carboxylation reaction by acetyl CoA and MgTNP-ATP
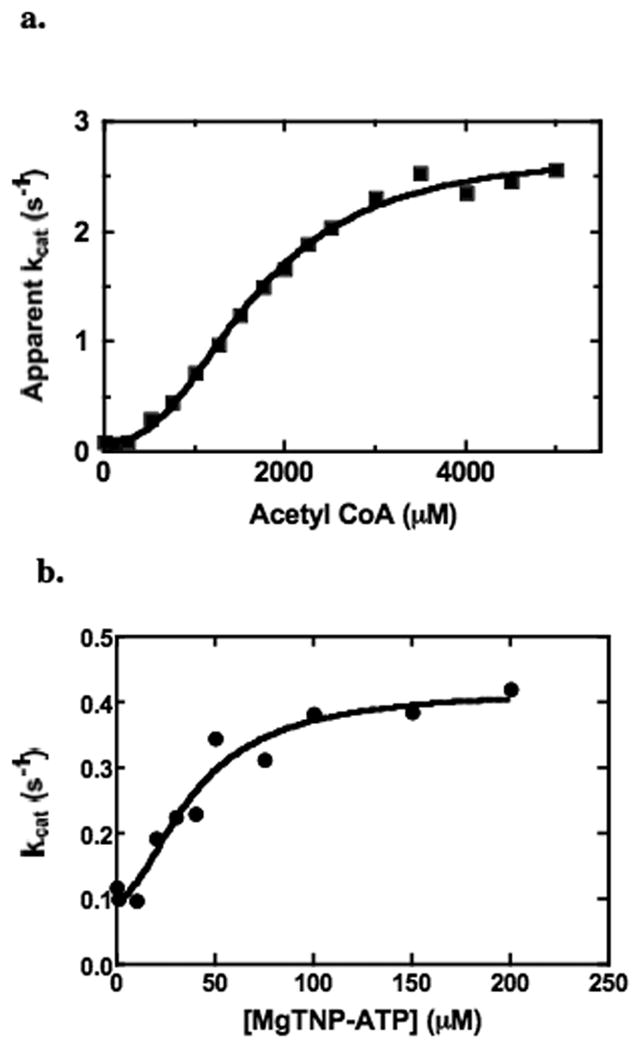
Fig. 4a shows the dependence of enzyme activity on the concentration of the allosteric activator, acetyl CoA. The solid line represents a fit of the data to equation (i) and the Ka derived from this fit is 6.9 ± 0.2 μM, the kcat2 is 20.2 ± 0.1 s-1 and n is 2.6 ± 0.2. Fig. 4b shows the effect of the presence of different concentrations of MgTNP-ATP on the activation of the enzyme by acetyl CoA. The values of KT, nt and kcat2 for the reaction activated by MgTNP-ATP derived from a global-fit of the data to equation (ii) (solid lines) are 32 ± 5 μM, 2.5 ± 0.4 and 2.0 ± 0.5 s-1 respectively. A replot of the velocities from Fig. 4b obtained in the absence of acetyl CoA, but in the presence of different concentrations of MgTNP-ATP, is shown in Fig. 4c. The solid line represents a fit of the data to equation (i) and the values of KT, nt and kcat2 for the activation by MgTNP-ATP are similar to those obtained from the fit of the data in Fig. 4b, i.e. 21 ± 3 μM, 2.3 ± 0.6 and 1.9 ± 0.1 s-1.
Figure 4.
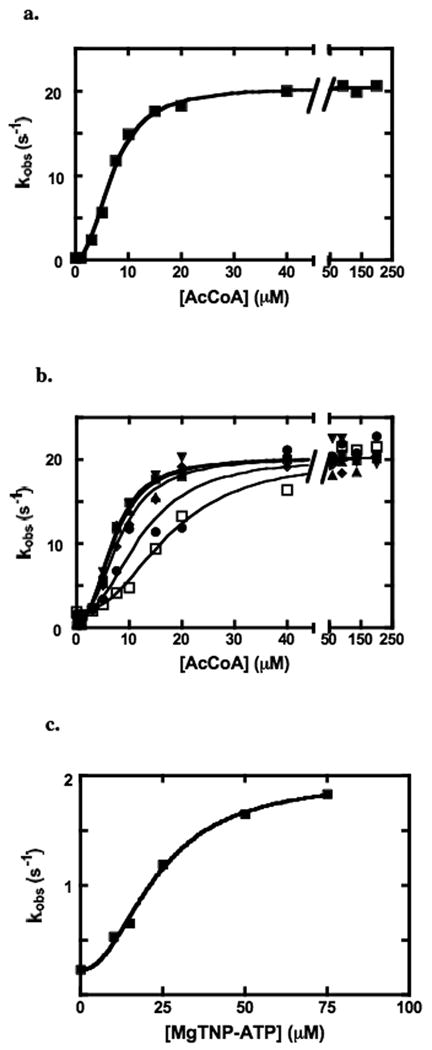
(a) Activation of the pyruvate carboxylation reaction by acetyl CoA (see Materials and Methods for reaction conditions). The solid line represents the non-linear least squares regression fit of the data to equation (i) (see Materials and Methods). (b) Activation of pyruvate carboxylase by acetyl CoA at different fixed concentrations of MgTNP-ATP: (■) 0 μM; (▲) 10 μM; (▼) 15 μM; (◆) 25 μM; (●) 50 μM; (□) 75 μM. Solid lines represent a global non-linear least squares regression fit of the data to equation (ii) (R2 =0.98) (see Materials and Methods). (c) Replot of the data in the absence of acetyl CoA from (b), showing the activation of the enzyme by MgTNP-ATP in the absence of acetyl CoA The solid line represents a fit of the data to equation (i), with nt and KT replacing n and Ka.
Fig. 5a shows the dependence of enzymic activity on acetyl CoA concentration for a mutant enzyme in which an R472S mutation has been made. R472 is located in the acetyl CoA allosteric binding site (Fig. 11B) and interacts with the [5′] α-phosphate of acetyl CoA [16]. The Ka determined from a fit of the data to equation (i) to (solid line) is 1.65 ± 0.05 mM, which is approximately 240 times greater than that for the wild-type enzyme, indicating that this mutation has severely decreased the affinity of the enzyme for acetyl CoA. Fig. 5b shows the dependence of enzymic activity on of the R472S mutant on the concentration of MgTNP-ATP. The KT determined from the fit of the data to equation (i) is 39 ± 8 μM, which is only 1.2-1.8 times greater than for the wild-type enzyme (based on the values for KT. for the wild-type enzyme described above).
Figure 5.
Activation of the pyruvate carboxylation reaction by acetyl CoA (a) and by MgTNP-ATP (b) for the mutant R472S (see Materials and Methods for other reaction conditions). The solid lines represents the non-linear least squares regression fits of the data to equation (i) (see Materials and Methods).
Figure 11.
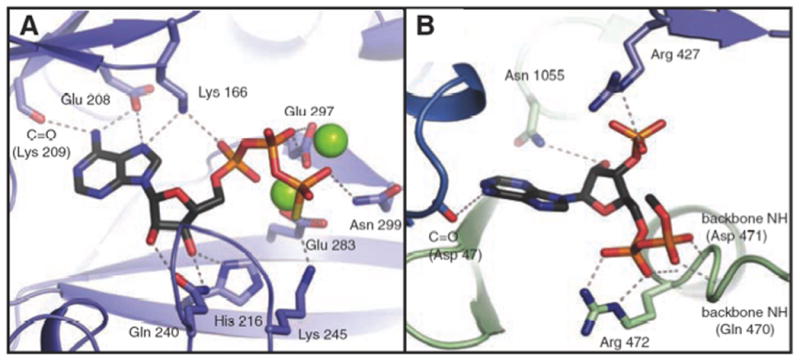
Structural representation of (A) the ATP-binding (B) the allosteric binding sites of RePC with ATP-γ-S and ethyl CoA bound respectively. The figure is reproduced from [16]. Only the nucleotide moiety of ethyl CoA was evident in the crystal structure.
Effects of super-catalytic concentrations of MgATP on the reactions catalysed by pyruvate carboxylase
Since the MgATP analogue MgTNP-ATP appears to act as to mimic some of the activation effects of acetyl CoA, it was decided to examine whether MgATP itself could also behave as an activator. Fig. 6a shows the effects of high concentrations of MgATP on the pyruvate carboxylation reaction in the absence of acetyl CoA. It is clear that above 2-3 mM, MgATP is inhibitory, with kcat = 21 ± 1 s-1, Km = 0.15 ± 0.02 mM and Ki of 8.9 ± 1.2 mM. However, when the steady state bicarbonate-dependent cleavage of MgATP reaction is measured in the absence of acetyl CoA, above about 2 mM MgATP, there is an unmistakeable, sigmoidal activation of the enzyme at concentrations of MgATP above approximately 2 mM, with an apparent Ka of 5.0 ± 0.4 mM and a Hill coefficient of 3.1 ± 0.5 (see Fig. 6b). The increase in activity between 2 mM and saturating MgATP is approximately 16 fold compared to a 7 fold increase in the turnover number for ATP cleavage induced by acetyl CoA when MgATP is present up to1 mM. (data not shown).
Figure 6.
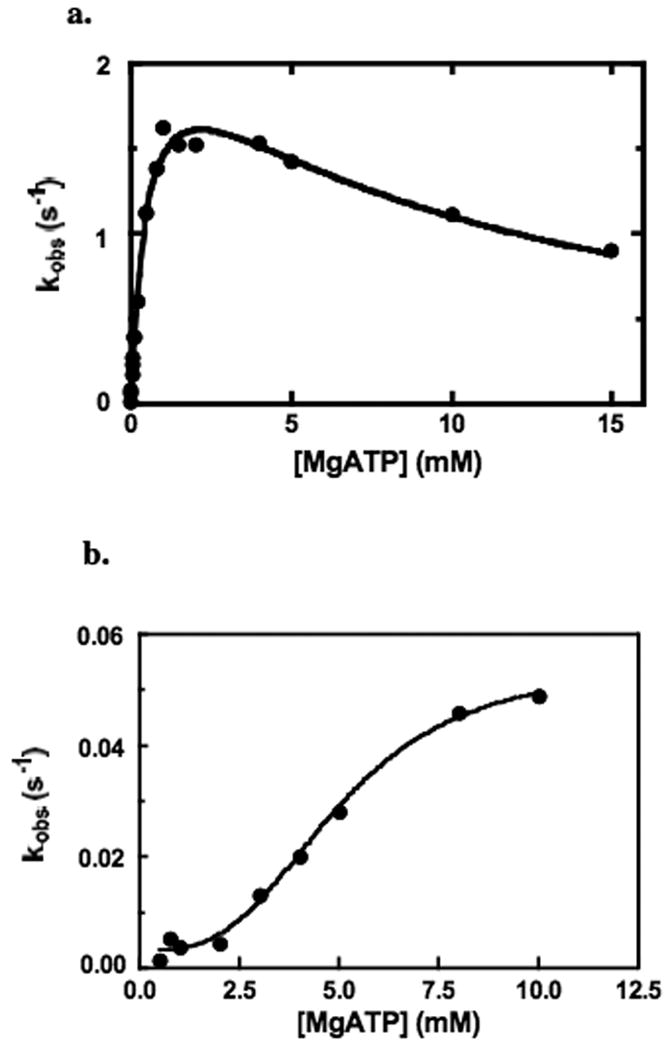
(a) Effect of [MgATP] on the pyruvate carboxylation reaction in the absence of acetyl CoA (see Materials and Methods for reaction conditions). The solid line represents a non-linear least squares regression fit of the data to equation (iii). (b) Effect of [MgATP] on the bicarbonate-dependent ATP cleavage reaction in the absence of acetyl CoA (see Materials and Methods for reaction conditions). The line represents a non-linear least squares regression fit of the data to equation (iv).
Enhanced TNP-ATP fluorescence on binding to pyruvate carboxylase
Fig. 7 shows the emission spectra of 5 μM MgTNP-ATP (spectrum (i)). There is a 2.5 fold increase in the maximum fluorescence intensity when pyruvate carboxylase is present and a blue-shift in the fluorescence spectrum from a maximum at 552 nm to a maximum at 543 nm (spectrum (ii)). This suggests that MgTNP-ATP binds to the enzyme and the resulting movement from the polar environment of the solution to the less polar environment of the enzyme active or allosteric site is responsible for the enhanced fluorescence. On addition of 0.25 mM acetyl CoA, the maximum fluorescence intensity decreased by approximately 32% and was accompanied by a red-shift in the fluorescence spectrum to 548 nm (spectrum (iii)). Given that MgTNP-ATP activates the enzyme and competes with acetyl CoA, this suggests that acetyl CoA displaces some of the enzyme-bound MgTNP-ATP. However, since the fluorescence is still higher (188%) than that observed in the solution of MgTNP-ATP alone, it is reasonable to assume that some of the MgTNP-ATP remains bound to the enzyme, even in the presence of saturating acetyl CoA. Addition of 2.5 mM MgATP resulted in a further decrease in fluorescence of approximately 13%, with a smaller red-shift to 550 nm (spectrum (iv)). Again the residual fluorescence is higher (164%) than that of the solution of MgTNP-ATP alone, suggesting that even in the presence of both saturating acetyl CoA and MgATP, some of the MgTNP-ATP still remains bound to the enzyme.
Figure 7.
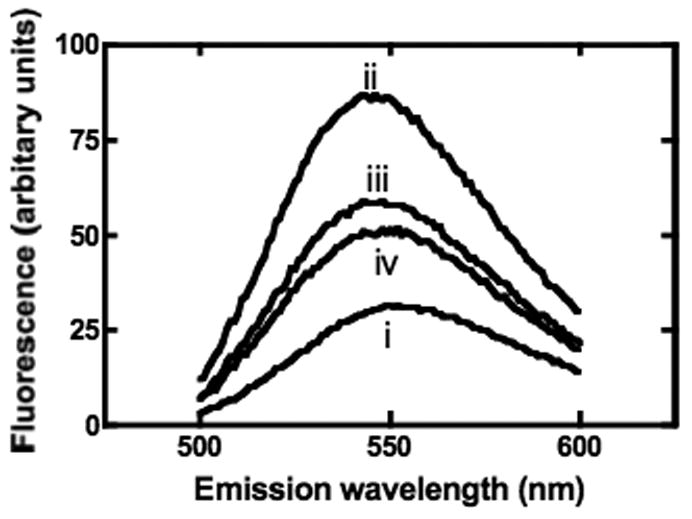
Fluorescence emission spectra of 5 μM MgTNP-ATP in 0.1M Tris-Cl, pH7.8, 20 mM NaHCO3 (i) alone and in the presence of: (ii) 10 μM pyruvate carboxylase; (iii) 10 μM pyruvate carboxylase + 0.25 mM acetyl CoA; (iv) 10 μM pyruvate carboxylase and 0.25 mM acetyl CoA and 2.5 mM MgATP. Excitation wavelength = 408 nm, temperature = 30°C.
Kinetics of MgTNP-ATP binding to the enzyme
Fluorescence stopped-flow experiments were used to measure the kinetics of MgTNP-ATP binding to the wild-type enzyme. Fig 8 shows stopped-flow traces of the time-courses of MgTNP-ATP binding to the enzyme. Figs. 8a and b show a fast phase and an intermediate phase of the reaction of approximately equal amplitudes that are essentially complete in about 30 msec and 1 sec respectively. A much slower phase (Fig. 8c) that is complete within approximately 2 min was also observed. Reactions were performed over a range of MgTNP-ATP concentrations that were at least twenty times that of RePC. It was not possible to use saturating concentrations of MgTNP-ATP because of the increasingly large inner filter effect beyond 35 μM. The apparent first order rate constants for the fast and intermediate phases increased with increasing [MgTNP-ATP] and had phases of approximately equal amplitudes. The slow phase had an amplitude of approximately one-quarter to one-third of that of the fast and intermediate phases and its observed first order rate constant showed no strong dependence on [MgTNP-ATP], having an average value across all concentrations of MgTNP-ATP of 0.035 ± 0.008 s-1. An experiment was performed where 1 mM MgATP was present in both the enzyme syringe and the MgTNP-ATP (10 μM) syringe. The kinetics of binding were essentially identical to those measured in the absence of MgATP.
Figure 8.
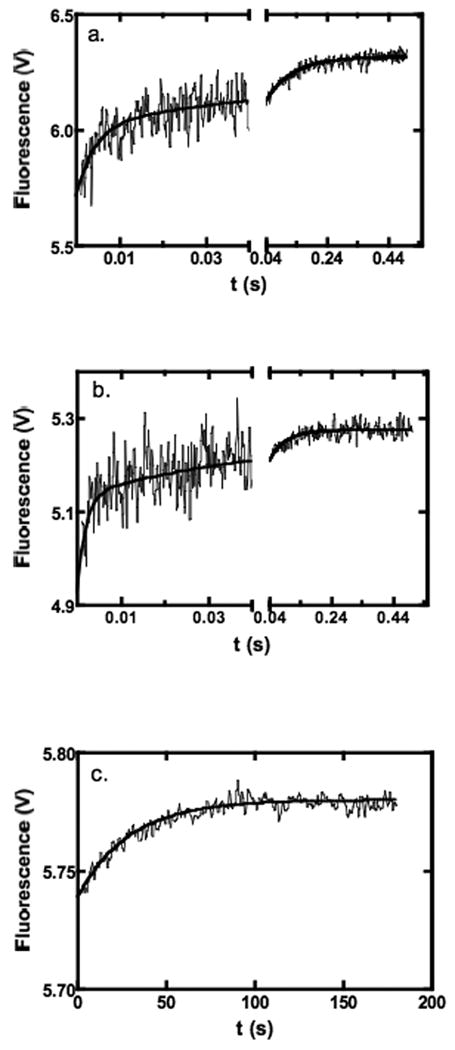
Examples of fluorescence stopped-flow traces showing the kinetics of MgTNP-ATP binding to pyruvate carboxylase at 30°C with 0.5 μM pyruvate carboxylase in 0.1M Tris-Cl, pH7.8 containing 20 mM NaHCO3. (a) Fast and intermediate phases of the reaction with 10 μM MgTNP-ATP (500 data points collected in the range 0-0.04 s and 500 data points collected in the range 0.04-1 s, average of 10 traces). Lines represent a fit to a double exponential equation, where data points up to 1 ms have been excluded from the fit (kobs1 = 234 ± 26 s-1, kobs2 = 11 ± 1 s-1). (b) Fast and intermediate phases of the reaction with 35 μM MgTNP-ATP (500 data points collected in the range 0-0.04 s and 500 data points collected in the range 0.04-0.5 s, average of 7 traces). Lines represent a fit to a double exponential equation, where data points up to 1 ms have been excluded from the fit (kobs1 = 475 ± 90 s-1, kobs2 = 19 ± 2 s-1). (c) Slow phase of the reaction with 20 μM MgTNP-ATP showing the 500 data points collected in the range 1-180s (average of 2 traces). The solid line represents a fit to a single exponential equation, where data points up to 3 s have been excluded from the fit (k = 0.035 ± 0.001 s-1).
Plots of the observed pseudo-first order rate constants (kobs) versus [MgTNP-ATP] for the fast and intermediate phases of the reactions are shown in Figs. 9a and b respectively. In Fig. 9a, the positive relationship indicates that this phase represents a specific binding reaction that is dependent on the concentration of MgTNP-ATP. The equally good fits to equations (v) and (vi) mean that it is not clear from this analysis alone whether the relationship between kobs is linearly dependent on MgTNP-ATP concentration, which would indicate the binding of a single molecule of MgTNP-ATP, or the square of the MgTNP-ATP concentration, indicating the binding of two molecules. The kinetics of the intermediate phase were analysed by fitting the data to equations (vii – xii). Table 1 shows the values of the rate constants for the fast and intermediate phase and the equilibrium constants derived from analyses of the data in Fig. 9. The fits to equations (viii) and (ix) are shown in Fig. 9b. The fits to equations (viii) and (ix) are clearly better than those from fits to equations that describe models with only one molecule of MgTNP-ATP binding in the fast phase, followed by a conformational change (vii) or the binding of two molecules of MgTNP-ATP in the fast phase and/or two molecules of MgTNP-ATP in the intermediate phase (x-xii). Equation (viii) describes the dependence of the observed first-order rate constant for the intermediate phase on [MgTNP-ATP] in a reaction scheme where the initial binding of two molecules of MgTNP-ATP in the fast phase is followed by a first-order conformational change in the enzyme.(MgTNP-ATP)2 complex in the intermediate phase, leading to an increase in fluorescence. Equation (ix) describes the dependence of the observed first-order rate constant for the intermediate phase on [MgTNP-ATP] in a reaction scheme where the initial binding of one molecule of MgTNP-ATP in the fast phase is followed by a further second-order binding reaction of MgTNP-ATP. The fit of the intermediate phase data to equation (ix) gave values of k2 and k-2 that are 5.9 and 6.6 % of those of the corresponding rate constants for the fast phase (k1 and k-1 respectively), leading to similar values of the dissociation constants for the enzyme.MgTNP-ATP complex formed in each phase, K1 (fast phase) and K2 (intermediate phase), which are also similar to the Ka described above for the activation of the enzyme by MgTNP-ATP.
Figure 9.
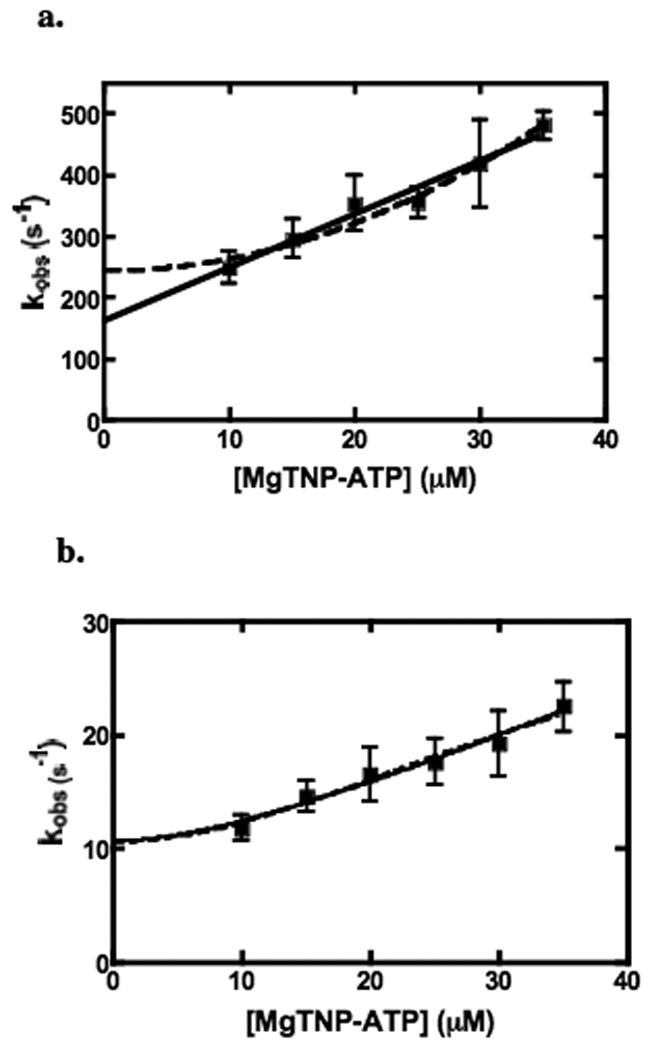
Plots of kobs for the fast (a) and intermediate (b) phases of MgTNP-ATP binding vs [MgTNP-ATP], as determined by stopped-flow fluorescence measurements. In (a), the solid line represents a fit to the equation (v) and the dashed line to equation (vi) (see Materials and Methods). In (b), the dashed line represents a fit to equation (viii) and the solid line represents a fit to equation (ix) (see Materials and Methods). Error bars indicate the standard deviations of the means n determinations of the rate constant, where n ≥ 4 and where at least 5 stopped-flow traces were averaged for each determination.
Table 1.
Kinetic parameters for the fast and intermediate of phases binding of MgTNP-ATP to pyruvate carboxylase.
| Fast Phase | k1 | k-1 | K1 | R2 |
|---|---|---|---|---|
| Fit to eq (v) | 8.7 ± 0.8 μM-1s-1 | 162 ± 19 s-1 | 18 ± 1 μM | 0.967 |
| Fit to eq (vi) | 0.20 ± 0.01 μM-2s-1 | 244 ± 5 s-1 | 1252 ± 65 μM2 | 0.967 |
| Intermediate Phase | k2 | k-2 | K2 | |
| Fit to eq (vii) | 31 ± 1 s-1 | 0.6 ± 0.6 s-1 | 0.02 ± 0.02 | 0.935 |
| Fit to eq (viii) | 22.6 ± 0.7 s-1 | 10.5 ± 0.2 s-1 | 0.47 ± 0.05 | 0.969 |
| Fit to eq (ix) | 0.50 ± 0.02 μM-1s-1 | 10.6 ± 0.2 s-1 | 21 ± 1 μM | 0.977 |
| Fit to eq (x) | 0.58 ± 0.03 μM-1 s-1 | 12.6 ± 0.2 s-1 | 24 ± 12 μM | 0.937 |
| Fit to eq (xi) | 0.013 ± 0.001μM-2s-1 | 12.7 ± 0.2 s-1 | 1015 ± 67 μM2 | 0.928 |
| Fit to eq (xii) | 0.016 ± 0.001 μM-2 s-1 | 13.5 ± 0.3 s-1 | 863 ± 71 μM2 | 0.880 |
Values of parameters given ± standard errors derived from the least squares regression analysis of the data in Fig 8. K1 is the dissociation constant of the of the enzyme.MgTNP-ATP complex formed in the fast phase whilst K2 is either an equilibrium constant that describes the equilibrium between two conformational states of the enzyme.MgTNP-ATP complex formed in the fast phase (eqs vii and viii) or the dissociation constant of the enzyme.MgTNP-ATP complex formed in the intermediate phase, involving the binding of one or two more MgTNP-ATP molecules. Both K1 and K2 were calculated from the ratios k-1/k1 and k-2/k2 respectively.
Kinetics of displacement of enzyme-bound MgTNP-ATP by acetyl CoA
Fig. 10 shows a typical stopped-flow time course of the displacement of enzyme-bound MgTNP-ATP by 0.1 mM acetyl CoA. As with the binding of MgTNP-ATP, there are three phases evident in the dissociation kinetics, each being a first-order exponential decay. Increasing the concentration of acetyl CoA to 0.3 mM did not result in an increase in any of the apparent first-order rate constants. The rate constants for the fast, intermediate and slow phases are 171 ± 46 s-1, 5.0 ± 0.7 s-1 and 0.03 ± 0.01 s-1 (values are means ± S.D., n ≥ 3). The values of the rate constants of the fast and intermediate phases are similar to values of koff obtained from the kinetics of the binding of MgTNP-ATP (see Table 1 – Fit to equation (v) and to equations (viii and ix) respectively) and that of the slow phase is similar to that of the slow phase of MgTNP-ATP binding. The amplitudes of the fast, intermediate and slow phases, expressed as a percentage of the fluorescence at t= ∞, were: 2.6 ± 0.2; 5 ± 2 and 1.7 ± 0.6 respectively (values are means ± S.D., n ≥ 3). Thus, the amplitude of the fast phase of the displacement kinetics is somewhat smaller as a proportion of that of the intermediate and slow phases than is the case in the binding kinetics.
Figure 10.
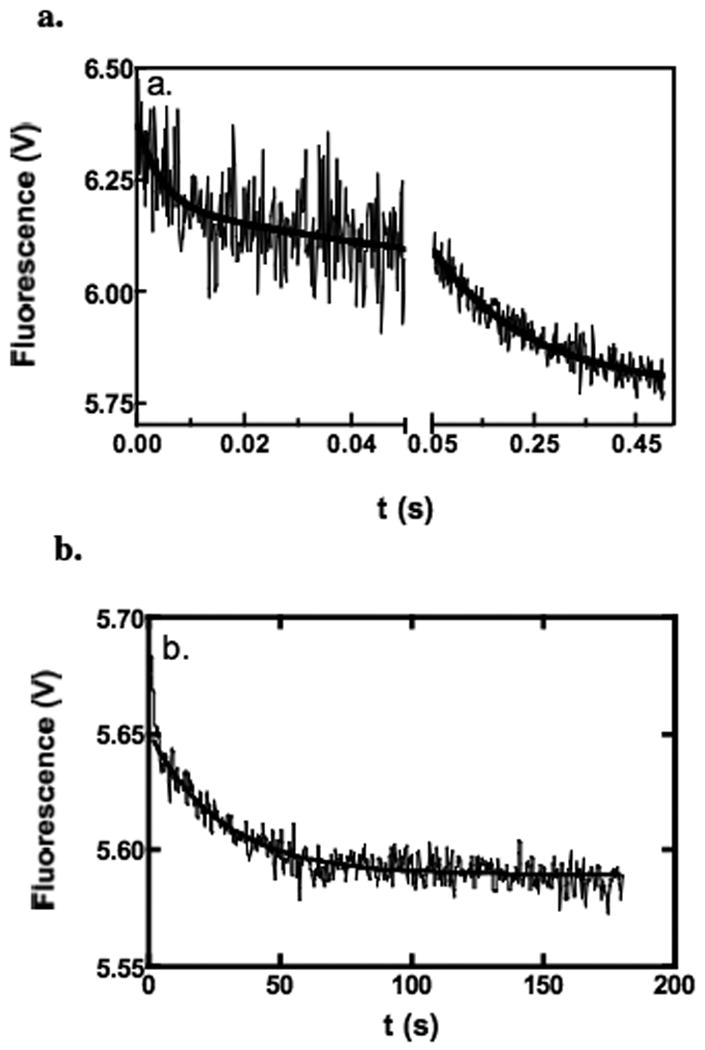
Examples of fluorescence stopped-flow traces showing the kinetics of MgTNP-ATP displacement from pyruvate carboxylase by acetyl CoA. Reactions were performed at 30°C in 0.1M Tris-Cl, pH 7.8 containing 20 mM NaHCO3, with 0.5 μM pyruvate carboxylase and 10 μM MgTNP-ATP in one syringe and 0.1 mM acetyl CoA in the other. (a) Fast and intermediate phases (500 data points collected in the range 0-0.04 s and 500 data points collected in the range 0.04-0.5 s, average of 23 traces). Lines represent a fit to a double exponential equation, where data points up to 1 ms have been excluded from the fit (k1 = 220 ± 69 s-1, k2 = 5.4 ± 0.6 s-1). (b) Slow phase of the displacement of MgTNP-ATP from the enzyme-MgTNP-ATP complex by 0.1 mM acetyl CoA. (1000 data points collected in the range 0-180 s). Line represents non-linear least squares regression fit of the data to a single exponential functions (k = 0.036 ± 0.001 s-1), where data points up to 3 s have been excluded from the fit.
Discussion
The fact that MgTNP-ATP is not a substrate for RePC and is not a competitive inhibitor with respect to MgATP indicates that it is unable to bind to the nucleotide binding site of the BC domain of the enzyme where catalysis is occurring. This may be because of the trinitrophenyl group attached to 2′ and 3′ hydroxyl groups of the ribose ring (see Fig. 2), would not fit well into the nucleotide binding pocket when the BC domain it is in a catalytically active conformation. When MgATP is bound, Gln240 and His216 form key hydrogen bonding interactions with the 2′and 3′-hydroxyl groups of the ribose moiety, which are located within 3 Å (see Fig. 11A) so that this may be somewhat restrictive [16]. Steady-state kinetics show that MgTNP-ATP appears to compete with acetyl CoA in activating the enzyme, although not as effectively as activator as acetyl CoA in that the activation constant KT, is about three times greater than the Ka for acetyl CoA and the value of kcat at saturating MgTNP-ATP is about one-tenth of that with acetyl CoA. Even so, the Hill coefficients determined for the activation by both acetyl CoA and MgTNP-ATP are very similar, suggesting a similar mode of binding of the two molecules. One possibility is that MgTNP-ATP and acetyl CoA are competing for the same allosteric binding sites on the enzyme. Based on the structure determined in the presence of the ethyl CoA analogue of acetyl CoA, the allosteric site of RePC there appears to be capable of accommodating the trinitrophenyl group of MgTNP-ATP since there is only one major hydrogen bonding interaction between Asn1055 and the 3′-ribosyl oxygen of acetyl CoA, located 3.8 Å away (see Fig. 11B) [16]. Another possibility that cannot be ruled out based on the results of the current study, is that MgTNP-ATP can binds at sites other than in the acetyl CoA binding site, but that there are allosteric interactions between the sites such that the binding of acetyl CoA decreases the binding affinity of MgTNP-ATP to its site and vice versa. In order to try and determine which of these two possibilities is more likely we mutated a residue (R472) in the binding site for acetyl CoA that interacts with the 5′,α-phosphate, a group that is also present in TNP-ATP. This mutation greatly disrupts the binding of acetyl CoA, raising its Ka by more than 200 fold. However, the mutation has a relatively small effect on the KT for MgTNP-ATP. If MgTNP-ATP was binding in the acetyl CoA binding site in the same orientation as acetyl CoA, one would expect MgTNP-ATP binding to be also severely disrupted by the R472S mutation. Although we cannot definitely rule out the possibility that MgTNP-ATP binds at the acetyl CoA binding site, but in a different orientation to acetyl CoA, a more likely explanation is that MgTNP-ATP is binding to a different site, with there being allosteric interactions between these two sites.
Given that MgTNP-ATP is primarily regarded as an MgATP analogue and has the capability of activating the enzyme, we sought evidence that MgATP itself could activate the enzyme. In the pyruvate carboxylation reaction in the absence of acetyl CoA substrate inhibition is evident at concentrations of MgATP above about 4 mM. Substrate inhibition by MgATP has been reported previously [26], but at low pyruvate concentrations and in reactions performed in the presence of acetyl CoA. When the effects of high MgATP concentrations on the bicarbonate-dependent ATP-cleavage reaction in the absence of pyruvate and acetyl CoA were examined, enzyme activation was clearly evident at MgATP concentrations above 2.5 mM. The Hill coefficient of activation by MgATP of the ATP-cleavage reaction is not significantly different (t-test; p>0.1) to the Hill coefficient for the acetyl CoA and MgTNP-ATP activation of the overall reaction. In the absence of pyruvate, there are two simultaneous ATP-cleavage reaction pathways, one in which the formation and subsequent abortive decarboxylation of the carboxyphosphate intermediate is not coupled to biotin carboxylation and the second where the decarboxylation of carboxyphosphate results in the formation of carboxybiotin, which can then undergo decarboxylation, mainly in the CT domain [13, 14]. Acetyl CoA affects both the rate of the ATP-cleavage and the balance between the flux through the two reaction pathways. In the yeast enzyme Pyc1, acetyl CoA enhances the rate of the ATP-cleavage step two-fold but also enhances the abortive decarboxylation of carboxyphosphate relative to biotin carboxylation, which is the most important contribution to the increased steady state turnover number [14]. Thus, the stimulatory effects of high concentrations of MgATP on the bicarbonate-dependent ATP-cleavage reaction in the absence of pyruvate could be attributed, in part, to MgATP producing a similar effect to acetyl CoA on the ATP-cleavage reaction. If this were still to occur with super-catalytic concentrations of MgATP in the presence of pyruvate, this would result in reduced oxaloacetate production and hence inhibition of the overall reaction. In other words, super-catalytic concentrations of MgATP are not able to induce the efficient coupling of ATP cleavage and pyruvate carboxylation that is apparent in the presence of acetyl CoA. Microbial ATP concentrations of between 1.3 and 2.6 mM have been reported [27, 28] which would suggest that the effects of super-catalytic concentrations of MgATP may not be physiologically relevant to R. etli.
The increased fluorescence of MgTNP-ATP and the blue-shift in fluorescence maximum on binding to pyruvate carboxylase indicates the sequestering of the fluorophore in a less polar environment. The reduction in fluorescence when saturating concentrations of acetyl CoA were added to the enzyme-MgTNP-ATP mixture indicates that the MgTNP-ATP bound at the acetyl CoA binding site was displaced. This is in full agreement with the competitive interactions between acetyl CoA and MgTNP-ATP for the activation of the enzyme. However, the failure of saturating concentrations of acetyl CoA to fully reduce the observed fluorescence back to that of the MgTNP-ATP alone in solution, further supports the suggestion that the fluorophore binds to a site or sites on the enzyme separate from the allosteric effector sites. While the addition of 2.5 mM MgATP induced a small reduction in the fluorescence, the signal still remained considerably higher than that of a solution of MgTNP-ATP alone, with a wavelength maximum that was slightly blue-shifted. The lack of kinetic evidence supporting the binding of MgTNP-ATP to the MgATP substrate binding binding sites in the catalytically active subunits indicates that the small decrease in fluorescence observed on the addition of 2.5 mM MgATP is most likely due to conformational changes leading to either a change in the environment of the remaining bound MgTNP-ATP or to a small degree of displacement of the fluorophore. Further, the fact that some MgTNP-ATP remained bound to the enzyme in the presence of saturating concentrations of both acetyl CoA and MgATP strongly suggests that there is another binding site on the enzyme from which MgTNP-ATP cannot be displaced by these ligands.
The kinetics of binding of MgTNP-ATP to pyruvate carboxylase were determined by monitoring the associated increase in fluorescence with time. The process is triphasic, where the data for the dependence of kobs of the fast phase on [MgTNP-ATP] gave equally good fits to equations describing the binding of one or two molecules of MgTNP-ATP. The data for dependence of kobs of the intermediate phase on [MgTNP-ATP] gave the better fits to equations describing two different models. In the first model, two molecules of MgTNP-ATP bind in the fast phase, followed by a rate-limiting first-order conformational change in the intermediate phase that leads to an increase in fluorescence, either directly or by the rapid association of more MgTNP-ATP (eq viii). In the second model, the binding of one molecule of MgTNP-ATP in the fast phase is followed by another in the intermediate phase (eq ix).
The fact that MgTNP-ATP activates the enzyme in a similar way to acetyl CoA and that it is competitive with acetyl CoA indicates that at least part of the decrease in fluorescence observed on mixing enzyme and MgTNP-ATP with saturating acetyl CoA is due to the displacement of MgTNP-ATP from the allosteric sites in the enzyme.MgTNP-ATP complex. The similar triphasic nature of the displacement reaction in which fluorescence decreases when enzyme and MgTNP-ATP are mixed with acetyl CoA suggests that the phases of the MgTNP-ATP binding reaction can also describe the binding of acetyl CoA itself. The lower amplitude of the fast phase of the displacement reaction in comparison with those of other phases, coupled with the failure of acetyl CoA to displace all of the enzyme-bound MgTNP-ATP in the static fluorescence experiments, indicate that at least part of the fast phase of the binding reaction constitutes the binding of MgTNP-ATP to a site outside the acetyl CoA binding site from which it cannot be displaced by acetyl CoA (or MgATP).
The slowest phase of the binding kinetics, with a half time of about 20 sec is too slow to be directly linked to the activation of the enzyme. The apparently first-order process may result from a slow conformational change that is rate-limiting in the further binding of MgTNP-ATP, or results from a change in the environment of bound MgTNP-ATP that enhances its fluorescence. It has been noted that relatively slow processes of tetramer dissociation and subunit aggregation can occur upon enzyme dilution on this sort of time scale [7, 9] and that these can be reversed in the presence of acetyl CoA. These slow process may result in further MgTNP-ATP binding or changes in the environment of bound MgTNP-ATP.
If we accept the likelihood that MgTNP-ATP is not binding at the acetyl CoA binding sites, where then does it bind? Unless the MgTNP-ATP is binding at some unpredictable sites in the enzymic tetramer, the only other nucleotide binding sites are the MgATP binding sites contained in the BC domains. However, since MgTNP-ATP is not a competitive inhibitor with respect to MgAT, binding of MgTNP-ATP in the catalytically active nucleotide binding site is highly unlikely. The X-ray structure of the enzyme [16] clearly suggests that only two of the four subunits are in a catalytically competent conformation at any one time to allow the pyruvate carboxylation reaction to proceed, with acetyl CoA bound to each of these subunits. This leaves two subunits in a catalytically incompetent conformation, that can still bind MgATP, but presumably not hydrolyse it at a rate that is significant compared to the overall pyruvate carboxylation reaction occurring in the other two subunits. It is possible that MgTNP-ATP is able to compete very effectively with MgATP to bind to these sites (i.e. these sites have a low affinity for MgATP), but not to the catalytically competent MgATP substrate binding sites on the other two subunits. The apparent competitive nature of the interaction between MgTNP-ATP binding and acetyl CoA binding would then indicate some kind of allosteric interactions between these binding sites, but since MgTNP-ATP is an activator, there must also be allosteric interactions with the catalytically active BC domain active sites. If this model is correct, the rapid phase of the MgTNP-ATP binding kinetics could represent binding of MgTNP-ATP to either one both of these sites, in the former case, the intermediate phase would then correspond to binding of MgTNP-ATP to the second site. Where both sites were occupied in the fast phase, the intermediate phase could reflect conformational changes that produce the allosteric effects induced by MgTNP-ATP binding. These effects producing changes in the environments of the bound MgTNP-ATP molecules, resulting in enhanced fluorescence. Mixing this complex with acetyl CoA would result in the allosteric interactions with these sites, changing their conformation so as to lower their affinity for MgTNP-ATP, resulting in displacement of some, but not all of the MgTNP-ATP.
If this model is correct, then it is possible that the effects produced by super-catalytic concentrations of MgATP are also mediated through binding to these catalytically incompetent sites, with the high concentrations of MgATP overcoming the low affinity of these sites for the nucleotide. However the allosteric affects of MgATP binding at these sites are qualitatively different to those induced by MgTNP-ATP.
Conclusions
In summary, we have shown that MgTNP-ATP although not a substrate, was expected to be a competitive inhibitor with respect to MgATP, but this was not the case. Upon binding to the enzyme MgTNP-ATP acted as an activator, although to a lesser extent than acetyl CoA. MgTNP-ATP binding kinetics and displacement kinetics were measured by fluorescence stopped-flow and the fast and intermediate phases of these processes are associated with the binding to the enzyme that induces activation. We have proposed a model for these binding processes and suggest that MgTNP-ATP Binds to the pair of subunits in the enzyme that are not configured for pyruvate carboxylation and that stimulation of enzyme activity and competition with the activation of the enzyme by acetyl CoA illustrate some of the allosteric interactions between the pair of catalytically active subunits in the enzymic tetramer and the inactive pair.
Supplementary Material
Acknowledgments
This work was supported by the National Institute of Health grant GM070455 to WWC, JCW, PVA and MSt.M, an Australian Research Council Discovery Grant DP0988153 to JCW and PVA, support from the Thailand Research Fund and the Faculty of Science, Mahidol University to SJ and an NIH award F32DK083898 from the National Institute Of Diabetes And Digestive And Kidney Diseases to TNZ.
Footnotes
Abbreviations: PC, pyruvate carboxylase; RePC, Rhizobium etli pyruvate carboxylase; BC, biotin carboxylase; CT, carboxyl transferase; TNP-ATP, 2′,3′-O-(2,4,6-Trinitrophenyl) adenosine 5′-triphosphate.
Publisher's Disclaimer: This is a PDF file of an unedited manuscript that has been accepted for publication. As a service to our customers we are providing this early version of the manuscript. The manuscript will undergo copyediting, typesetting, and review of the resulting proof before it is published in its final citable form. Please note that during the production process errors may be discovered which could affect the content, and all legal disclaimers that apply to the journal pertain.
References
- 1.Jitrapakdee S, Wallace JC. Structure, function and regulation of pyruvate carboxylase. Biochem J. 1999;340:1–16. doi: 10.1042/bj3400001. [DOI] [PMC free article] [PubMed] [Google Scholar]
- 2.Jitrapakdee S, St Maurice M, Rayment I, Cleland WW, Wallace JC, Attwood PV. Structure, mechanism and regulation of pyruvate carboxylase. Biochem J. 2008;413:369–387. doi: 10.1042/BJ20080709. [DOI] [PMC free article] [PubMed] [Google Scholar]
- 3.Attwood PV. The structure and the mechanism of action of pyruvate carboxylase. Int J Biochem Cell Biol. 1995;27:231–249. doi: 10.1016/1357-2725(94)00087-r. [DOI] [PubMed] [Google Scholar]
- 4.Attwood PV, Wallace JC. Chemical and catalytic mechanisms of carboxyl transfer reactions in biotin-dependent enzymes. Acc Chem Res. 2002;35:113–120. doi: 10.1021/ar000049+. [DOI] [PubMed] [Google Scholar]
- 5.Johannssen W, Attwood PV, Wallace JC, Keech DB. Localisation of the active site of pyruvate carboxylase by electron microscopic examination of avidin-enzyme complexes. Eur J Biochem. 1983;133:201–206. doi: 10.1111/j.1432-1033.1983.tb07448.x. [DOI] [PubMed] [Google Scholar]
- 6.Attwood PV, Mayer F, Wallace JC. Avidin as a probe of the conformational changes induced in pyruvate carboxylase by acetyl-CoA and pyruvate. FEBS Lett. 1986;203:191–196. doi: 10.1016/0014-5793(86)80740-2. [DOI] [PubMed] [Google Scholar]
- 7.Khew-Goodall YS, Johannssen W, Attwood PV, Wallace JC, Keech DB. Studies on dilution inactivation of sheep liver pyruvate carboxylase. Arch Biochem Biophys. 1991;284:98–105. doi: 10.1016/0003-9861(91)90269-o. [DOI] [PubMed] [Google Scholar]
- 8.Attwood PV, Johannssen W, Chapman-Smith A, Wallace JC. The existence of multiple tetrameric conformers of chicken liver pyruvate carboxylase and their roles in dilution inactivation. Biochem J. 1993;290:583–590. doi: 10.1042/bj2900583. [DOI] [PMC free article] [PubMed] [Google Scholar]
- 9.Attwood PV, Geeves MA. Changes in catalytic activity and association state of pyruvate carboxylase which are dependent on enzyme concentration. Arch Biochem Biophys. 2002;401:63–72. doi: 10.1016/S0003-9861(02)00039-5. [DOI] [PubMed] [Google Scholar]
- 10.Wallace JC, Phillips NB, Snoswell MA, Goodall GJ, Attwood PV, Keech DB. Pyruvate carboxylase: mechanisms of the partial reactions. Annal of the N Y Acad Sci. 1985;447:169–188. doi: 10.1111/j.1749-6632.1985.tb18436.x. [DOI] [PubMed] [Google Scholar]
- 11.Attwood PV, Graneri BDLA. Pyruvate carboxylase catalysis of phosphate transfer between carbamoyl phosphate and ADP. Biochem J. 1991;273:443–448. doi: 10.1042/bj2730443. [DOI] [PMC free article] [PubMed] [Google Scholar]
- 12.Attwood PV, Graneri BDLA. Bicarbonate-dependent ATP cleavage catalysed by pyruvate carboxylase in the absence of pyruvate. Biochem J. 1992;287:1011–1017. doi: 10.1042/bj2871011. [DOI] [PMC free article] [PubMed] [Google Scholar]
- 13.Legge GB, Branson JP, Attwood PV. Effects of acetyl CoA on the pre-steady-state kinetics of the biotin carboxylation reaction of pyruvate carboxylase. Biochemistry. 1996;35:3849–3856. doi: 10.1021/bi952797q. [DOI] [PubMed] [Google Scholar]
- 14.Branson JP, Nezic M, Wallace JC, Attwood PV. Kinetic characterization of yeast pyruvate carboxylase isozyme pyc1. Biochemistry. 2002;41:4459–4466. doi: 10.1021/bi011888m. [DOI] [PubMed] [Google Scholar]
- 15.Adina-Zada A, Jitrapakdee S, Surinya KH, McIldowie MJ, Piggott MJ, Cleland WW, Wallace JC, Attwood PV. Insights into the mechanism and regulation of pyruvate carboxylase by characterisation of a biotin-deficient mutant of the Bacillus thermodenitrificans enzyme. Int J Biochem Cell Biol. 2008;40:1743–1752. doi: 10.1016/j.biocel.2008.01.001. [DOI] [PubMed] [Google Scholar]
- 16.St Maurice M, Reinhardt L, Surinya KH, Attwood PV, Wallace JC, Cleland WW, Rayment I. Domain architecture of pyruvate carboxylase, a biotin-dependent multifunctional enzyme. Science. 2007;317:1076–1079. doi: 10.1126/science.1144504. [DOI] [PubMed] [Google Scholar]
- 17.Xiang S, Tong L. Crystal structures of human and Staphylococcus aureus pyruvate carboxylase and molecular insights into the carboxyltransfer reaction. Nat Struct Mol Biol. 2008;15:295–302. doi: 10.1038/nsmb.1393. [DOI] [PubMed] [Google Scholar]
- 18.de Queiroz MS, Waldrop GL. Modeling and numerical simulation of biotin carboxylase kinetics: implications for half-sites reactivity. J Theor Biol. 2007;246:167–175. doi: 10.1016/j.jtbi.2006.12.025. [DOI] [PubMed] [Google Scholar]
- 19.Janiyani K, Bordelon T, Waldrop GL, Cronan JE., Jr Function of Escherichia coli biotin carboxylase requires catalytic activity of both subunits of the homodimer. J Biol Chem. 2001;276:29864–29870. doi: 10.1074/jbc.M104102200. [DOI] [PubMed] [Google Scholar]
- 20.Mochalkin I, Miller JR, Evdokimov A, Lightle S, Yan C, Stover CK, Waldrop GL. Structural evidence for substrate-induced synergism and half-sites reactivity in biotin carboxylase. Protein Sci. 2008;17:1706–1718. doi: 10.1110/ps.035584.108. [DOI] [PMC free article] [PubMed] [Google Scholar]
- 21.Yu LP, Xiang S, Lasso G, Gil D, Valle M, Tong L. A symmetrical tetramer for S. aureus pyruvate carboxylase in complex with coenzyme A. Structure. 2009;17:823–832. doi: 10.1016/j.str.2009.04.008. [DOI] [PMC free article] [PubMed] [Google Scholar]
- 22.Chapmansmith A, Turner DL, Cronan JE, Morris TW, Wallace JC. Expression, biotinylation and purification of a biotin-domain peptide from the biotin carboxy carrier protein of Escherichia coli acetyl-CoA carboxylase. Biochem J. 1994;302:881–887. doi: 10.1042/bj3020881. [DOI] [PMC free article] [PubMed] [Google Scholar]
- 23.Branson JP, Attwood PV. Effects of Mg2+ on the pre-steady-state kinetics of the biotin carboxylation reaction of pyruvate carboxylase. Biochemistry. 2000;39:7480–7491. doi: 10.1021/bi992825v. [DOI] [PubMed] [Google Scholar]
- 24.Rylatt DB, Keech DB, Wallace JC. Pyruvate carboxylase: isolation of the biotin-containing tryptic peptide and the determination of its primary sequency. Arch Biochem Biophys. 1977;183:113–122. doi: 10.1016/0003-9861(77)90425-8. [DOI] [PubMed] [Google Scholar]
- 25.Duangpan S, Jitrapakdee S, Adina-Zada A, Byrne L, Zeczycki TN, St Maurice M, Cleland WW, Wallace JC, Attwood PV. Probing the catalytic roles of Arg548 and Gln552 in the carboxyl transferase domain of the Rhizobium etli pyruvate carboxylase by site-directed mutagenesis. Biochemistry. 2010;49:3296–3304. doi: 10.1021/bi901894t. [DOI] [PMC free article] [PubMed] [Google Scholar]
- 26.McClure WR, Lardy HA, Wagner M, Cleland WW. Rat liver pyruvate carboxylase. II. Kinetic studies of the forward reaction. J Biol Chem. 1971;246:3579–3583. [PubMed] [Google Scholar]
- 27.Biteau B, Labarre J, Toledano MB. ATP-dependent reduction of cysteine-sulphinic acid by S. cerevisiae sulphiredoxin. Nature. 2003;425:980–984. doi: 10.1038/nature02075. [DOI] [PubMed] [Google Scholar]
- 28.Di Tomaso G, Borghese R, Zannoni D. Assay of ATP in intact cells of the facultative phototroph Rhodobacter capsulatus expressing recombinant firefly luciferase. Arch Microbiol. 2001;177:11–19. doi: 10.1007/s00203-001-0352-8. [DOI] [PubMed] [Google Scholar]
Associated Data
This section collects any data citations, data availability statements, or supplementary materials included in this article.