

Abstract
We investigated the cognitive and neural bases of impaired speech fluency, a central feature of primary progressive aphasia. Speech fluency was assessed in 35 patients with frontotemporal lobar degeneration (FTLD) who presented with progressive non-fluent aphasia (PNFA, n=11), semantic dementia (SemD, n=12), or a social and executive disorder without aphasia (SOC/EXEC, n=12). Fluency was quantified as the number of words per minute in an extended, semi-structured speech sample. This was related to language characteristics of the speech sample and to neuropsychological measures. PNFA patients were significantly less fluent than controls and other FTLD patients. Fluency correlated with grammatical expression but not with speech errors or executive difficulty. SemD and SOC/EXEC patients were also less fluent than controls. In SemD, fluency was associated with semantically limited content. In SOC/EXEC, fluency was associated with executive limitations. Voxel-based morphometry analyses of high-resolution MRI related fluency to gray matter volume in left inferior frontal, insula, and superior temporal regions for the entire cohort of FTLD patients. This region overlapped partially distinct atrophic areas in each FTLD subgroup. It thus appears to play a crucial role in speech fluency, which can be interrupted in different ways in different FTLD subgroups.
Keywords: frontotemporal dementia, progressive aphasia, MRI, speech fluency
1. INTRODUCTION
Fluency in spoken language is the ability to produce conversational speech in a continuous, flowing, effortless stream. It relies on a complex process composed of several elements, such as rapidly retrieving words from the mental lexicon, structuring these words into a grammatical sentence, and implementing a motor speech program that allows smooth articulation. It is readily observed that patients with neurodegenerative diseases most often speak with a reduced speech rate compared to healthy adults. Indeed, impaired fluency is so prominent that it is used to distinguish major phenotypic variants of frontotemporal lobar degeneration (FTLD) (Grossman & Ash, 2004; Snowden, Neary, & Mann, 1996). However, the cognitive and neuroanatomic bases for the symptom of non-fluent speech are not known. Linguistic features that are associated with impaired speech production include agrammatism, phonetic and phonological speech production errors, and word-finding difficulty that produces hesitations, pauses, and multiple attempts at production. Cognitive factors may include executive and semantic limitations. The neuroanatomic substrate of fluency is attributed to various frontal lobe structures, including inferior frontal cortex (IFC) (Alexander, Naeser, & Palumbo, 1990), insula and frontal operculum (INS) (Dronkers, 1996), dorsal anterior cingulate and medial frontal cortex (ACC) (Alexander, Benson, & Stuss, 1989), dorsolateral prefrontal cortex (dlPFC) (Stuss & Benson, 1984), and the basal ganglia (BG) (Lieberman et al., 1992). Yet contrasting hypotheses about the linguistic, cognitive and neuroanatomic correlates of non-fluent speech have not been evaluated empirically in patients with FTLD. The purpose of this investigation is to assess the clinical and neuroanatomic features that contribute to impaired speech fluency in FTLD.
We investigated speech fluency in three phenotypic subgroups of FTLD. One group consists of patients with progressive non-fluent aphasia (PNFA) (Grossman et al., 1996; Thompson, Ballard, Tait, Weintraub, & Mesulam, 1997). This syndrome is characterized by grammatical simplification (Grossman et al., 1996; Grossman, Rhee, & Antiquena, 2005); dysarthria and speech production errors known as apraxia of speech (AOS), which is defined as an impairment of articulatory planning (Josephs et al., 2006; Ogar, Dronkers, Brambati, Miller, & Gorno-Tempini, 2007); and a limitation of executive resources (Libon et al., 2007; Weintraub, Rubin, & Mesulam, 1990). However, empirical studies directly relating these characteristics to the core PNFA feature of non-fluent speech have not been performed. The PNFA syndrome is associated with PET hypometabolism (Grossman et al., 1996; Nestor et al., 2003) and MRI structural atrophy (Gorno-Tempini et al., 2004; Grossman & Ash, 2004; Peelle, Troiani et al., 2008) in the frontal lobe. Agrammatic speech (Grossman et al., 1996; Turner, Kenyon, Trojanowski, Gonatas, & Grossman, 1996) and mutism and AOS (Gorno-Tempini et al., 2006; Ogar et al., 2007) occur in patients with disease in left IFC, INS, and BG, but we are not aware of studies directly correlating quantified speech rate with a neuroanatomic substrate in PNFA.
A second progressive aphasic syndrome known as semantic dementia (SemD) entails impairments of naming, word comprehension, and object knowledge, despite preserved grammatical speech (Hodges & Patterson, 2007; Snowden, Goulding, & Neary, 1989). Word-finding difficulty, caused by these patients’ lexical semantic impairment, may slow speech in SemD, although this hypothesis remains to be tested. Many studies identify atrophy in anterior portions of the left temporal lobe in SemD (Gorno-Tempini et al., 2004; Grossman et al., 2004; Lambon Ralph, Graham, Ellis, & Hodges, 1998), but the role of this area in reduced speech fluency has not been assessed empirically.
A third clinical FTLD syndrome involves a deficit of social comportment and personality, characterized by loss of insight, social disinhibition, and apathy (Rosen et al., 2005; Snowden et al., 1996). This often co-occurs with a disorder of attention, planning, and inhibitory control (Kramer, Jurik, & Sha, 2003; Libon et al., 2007), so we refer to these patients as having a social/executive (SOC/EXEC) disorder. Although these patients are not obviously aphasic, their discourse is poorly organized (Ash et al., 2006), which is related in part to their executive limitations. Frontal and temporal atrophy is seen in these patients (Grossman et al., 2004; Rosen et al., 2005). However, empirical assessments have not directly examined the contribution of executive limitations or of gray matter atrophy to their reduced speech fluency.
In the present study, we quantified speech fluency in an extended, semi-structured speech sample and related this to other aspects of speech and cognitive functioning such as simplified grammar, lexical retrieval deficits, speech errors, and executive limitations. We used voxel-based morphometry (VBM) to relate reduced speech fluency directly to gray matter volume in FTLD. This is meaningful only in areas that are significantly diseased in patient groups, reflected by cortical atrophy. Thus, direct evidence for the neuroanatomic basis of slowed speech in FTLD would come from an area of significant cortical atrophy in an FTLD subgroup that overlaps with the cortical association of non-fluent speech.
2. METHODS
2.1. Subjects
We studied 35 patients with FTLD, diagnosed by an experienced neurologist (MG) in the cognitive neurology clinic of the Department of Neurology at the University of Pennsylvania according to published criteria (McKhann et al., 2001; The Lund and Manchester Group, 1994). This included 11 patients with PNFA, 12 patients with SemD, and 12 patients with SOC/EXEC. We also assessed 10 healthy seniors. Patients were assigned to FTLD subgroups using a consensus evaluation based on a modification of published criteria (Grossman & Ash, 2004; Neary et al., 1998) that entailed two independent raters reviewing a semi-structured neurologic history, a complete neurologic exam, and a detailed mental status exam. Patients with a logopenic form of progressive aphasia were excluded because their small number precluded statistical analysis and because of the hypothesized association with different underlying pathology (Josephs et al., 2008). Exclusionary criteria included other causes of dementia, such as metabolic, endocrine, vascular, structural, nutritional, and infectious etiologies, and primary psychiatric disorders. We also excluded patients who had visual-perceptual difficulty that could limit their ability to perceive the pictures of the story. Demographic features are summarized in Table 1. The patients were mildly impaired according to the Mini Mental State Exam (MMSE) (Folstein, Folstein, & McHugh, 1975). One-way ANOVAs indicated that the four subject groups were matched for age and education, and all patient groups had a significantly lower MMSE than controls (each contrast significant at least at the p<0.05 level, according to t-tests). All subjects completed an informed consent procedure in accordance with the Declaration of Helsinki and approved by the Institutional Review Board of the University of Pennsylvania.
Table 1.
Mean ± standard deviation demographic and clinical characteristics of patients with frontotemporal lobar degeneration and controls
| PNFA | SemD | SOC/EXEC | Controls | |
|---|---|---|---|---|
| N (male/female) | 4/7 | 8/4 | 7/5 | 8/2 |
| Age (yrs) | 70.7 ± 9.3 | 66.8 ± 7.3 | 64.8 ± 13.2 | 69.5 ± 5.1 |
| Education (yrs) | 14.5 ± 2.8 | 15.8 ± 2.8 | 16.0 ± 3.0 | 16.7 ± 2.6 |
| MMSE (max=30) | 23.9 ± 5.5 | 22.5 ± 8.2 | 25.3 ± 6.5 | 30.0 ± 0.0 |
| Disease duration (yrs) | 2.9 ± 1.4 | 5.2 ± 2.3 | 4.1 ± 1.6 | -- |
All of the PNFA patients exhibited hesitant, effortful speech. Nine of the 11 made numerous phonetic (apraxic) and phonological (paraphasic) errors (Canter, Trost, & Burns, 1985). Two patients did not make such errors, but their speech was slow and effortful, with many utterance-internal pauses of 2 seconds or more, editing breaks, incomplete words, and incomplete utterances. The SemD patients exhibited very few phonetic errors and a small number of phonological errors but produced fewer nouns. The SOC/EXEC patients produced very few phonetic or phonological errors and had no noticeable word-finding difficulty.
2.2. Materials
The subjects’ task was to tell the story of the wordless children’s picture book, Frog, Where Are You (Mayer, 1969). An outline of the story is given elsewhere (Ash et al., 2006). We elected to study speech production in this manner to minimize the interruptions of turn-taking that occur in free conversation. We used the book’s sequence of 24 drawings to elicit an extended speech sample with a known target that was comparable in content across subjects in order to give patients an opportunity to demonstrate the full breadth of their language production capability.
2.3. Narrative Procedure
Each subject was asked to look through the book to become familiar with the story. When ready, the subject was asked to start at the beginning and narrate the story as if telling it to a child. Due to the nature of the task, there was no influence of the examiner on the time taken by the subjects to tell the story. The subjects’ narrations were digitally recorded. Thirty-one narrations were recorded on a Macintosh Powerbook G3 laptop computer using the Macintosh external microphone (part #590-0670) and the computer program SoundEdit 16, v. 2, with 16-bit recording at a sampling frequency of 44.1 kHz. Eight were recorded on a Dell Inspiron 2200 PC using the signal processing software Praat (Boersma and Weenink, v. 4.2, 1992–2004, http://www.praat.org ) with 16-bit recording at a sampling rate of 22.05 kHz, using a Radio Shack omnidirectional lavaliere electret condenser microphone. Six were recorded on a Marantz PMD 670 digital recorder with 16-bit recording at a sampling frequency of 32 kHz, using a Sennheiser MKE2 omnidirectional lavaliere condenser microphone.
The recordings of the narratives were transcribed in detail by trained transcribers using the signal processing software Praat (Boersma & Weenink, 1992–2000). The transcription conventions used to capture the irregularities in patients’ speech are defined elsewhere (Ash et al., 2006). All transcriptions were checked by two independent reviewers. Samples of the speech of the three patient groups are given in Appendix A. The narratives were scored from the transcripts by two independent, trained judges, referring to the original speech files as needed. All coding was checked by a linguist (SA) with expertise in grammatical and phonetic analysis. The narratives were analyzed for fluency, quantified as complete words per minute; speech errors per utterance; grammatical structure; and content features such as mean length (words) per utterance, complex grammatical structures per utterance, semantically limited (existential) sentences, and verbs and nouns per utterance. The detailed coding for these variables is described in Appendix B.
2.4. Neuropsychological evaluation
Most patients underwent neuropsychological testing within an average of 155 (± 99) days of the date of recording. We calculated Pearson correlation coefficients of subjects’ speech fluency with their ability to comprehend a range of syntactic constructions in a test of complex sentence comprehension. In the comprehension task, a sentence was presented orally, followed by a query targeting the subject or object of the matrix sentence or the embedded relative clause. There were 6 sentences in each of 8 categories defined by 3 oppositions: it-clefted or not; subject relative vs. object relative subordinate clause; and active vs. passive probe sentence. The dependent measure was the number of correct responses. We also correlated speech rate with tests of executive function. These included the following: Reverse digit span, a measure of working memory involving repetition of a sequence of numbers in an order reversing the order of presentation, where the dependent measure was the longest sequence repeated correctly in the reverse order (Wechsler, 1987); Stroop, a measure of inhibitory control, in which subjects were asked to name the color of ink in which a word was printed, rather than read the word, which spelled a different color, where the dependent measure was the number of seconds required to complete the 80 items, up to 300 sec (Spreen & Strauss, 1991); and Category naming fluency, for which subjects named as many different animals as possible in 60 seconds (Lezak, 1983).
2.5. Imaging Methods
High resolution structural MRI scans were available for a subset of 22 FTLD patients (6 PNFA, 7 SemD, 9 SOC/EXEC) to establish cortical atrophy using a modulated version of optimized voxel-based morphometry (VBM). Images were acquired by a GE Horizon Echospeed 1.5T MRI scanner in 5 patients and by a SIEMENS Trio 3T MRI scanner in 18 patients. A novel symmetric diffeomorphism procedure was used to normalize high-resolution T1-weighted MR images for shape and intensity (Avants & Gee, 2004) using a large local template consisting of 25 healthy seniors and 75 focal neurodegenerative disease patients. We used high dimensional normalization and template-based cortical segmentation to quantify gray matter changes. The brain image was modeled as a dense continuum, sampled at individual voxels, that was accompanied by a transformation model that preserved neighborhood relationships among voxels even under very large deformations. This strategy provided a high resolution, smoothly flowing deformation of these voxels into the corresponding voxels of the template and was able to capture both large-scale atrophy and subtle focal disease effects. A bidirectional algorithm was used to build maps from the set of experimental brains into a template and simultaneously from the template into the population of experimental brains. We also used these methods to estimate an unbiased local template. This approach allowed us to perform statistical contrasts between groups at a high spatial resolution and with less smoothing because both neighboring voxels and large-scale features are maintained, while at the same time there is reduced variance in the estimated location of the neuroanatomy. The resulting images were skull-stripped using BET2 (Smith, 2002) then segmented using FMRIB’s Automated Segmentation Tool (FAST) (Zhang, Brady, & Smith, 2000), which labeled the brain volumes as gray matter, white matter, CSF, and “other” with inhomogeneity correction. Gray matter images were then multiplied by the logarithm of their corresponding jacobian registrations to template space, which resulted in normalized, spatially varying estimates of gray matter volume for each subject (Avants & Gee, 2004). Gray matter images were subsampled to 2mm × 2mm voxel sizes and then warped into MNI space using the log-jacobians of the MNI space-warped template. Images were smoothed with an 8mm FWHM Gaussian filter and contrasted with a cohort of 31 age-matched controls using a two-sample t-test in SPM5, as described elsewhere (Grossman et al., 2007). The analysis included all voxels containing any gray matter in the volume, thus resulting in a true whole brain analysis. Explicit masking was accomplished by generating a mean grey matter image from all subjects’ modulated grey matter images in order to limit the analysis to voxelwise comparisons within regions of grey matter. Global calculation was omitted. Cortical regions were identified as significantly atrophic using a p<0.001 height threshold and a 100 voxel extent criterion, and which survived a cluster level criterion of p<0.05 (corrected for multiple comparisons). The regression module in SPM5 was used to relate fluency to cortical volume. For this analysis we used a statistical height threshold of p<.025, a 100 voxel extent, and only accepted clusters which survived a peak voxel level of p<0.0001 (z > 3.72).
3. RESULTS
3.1. Progressive Non-fluent Aphasia
Table 2 presents the measures of language production and cognitive functioning in patients and controls. PNFA patients had the most impaired speech fluency, with a speech rate one-third that of controls. PNFA were also significantly less fluent than SemD and SOC/EXEC (p<0.05). PNFA also produced significantly more speech errors than SemD, SOC/EXEC, and controls. They were significantly impaired on measures of grammar and sentence structure, with reduced mean length of utterance (MLU) and reduced frequency of grammatically complex utterances, and they produced significantly fewer verbs and nouns per utterance. PNFA patients were also impaired relative to controls on measures of sentence comprehension and executive functioning.
Table 2.
Mean ± standard deviation of performance on measures of speech production and cognition in patients with frontotemporal lobar degeneration and controls1,2
| PNFA | SemD | SOC/EXEC | Controls | |
|---|---|---|---|---|
| SPEECH OUTPUT | ||||
| Fluency (words/minute) | 46.9 ± 21.7 *+ | 88.0 ± 32.3 * | 89.2 ± 48.2 * | 142.1 ± 23.8 |
| Speech errors/utterance | 0.35 ± 0.34 *+ ° | 0.04 ± 0.05 | 0.02 ± 0.04 | 0.002 ± 0.005 |
| Total words | 329 ± 223 * | 612 ± 414 | 544 ± 209 | 585 ± 109 |
| Duration (seconds) | 436 ± 210 | 434 ± 223 | 442 ± 254 | 255 ± 76 |
|
| ||||
| GRAMMAR, STRUCTURE, CONTENT PER UTTERANCE | ||||
| Mean length of utterance (words) | 7.3 ± 2.5 * | 8.3 ± 2.3 | 9.4 ± 2.3 | 10.4 ± 1.8 |
| Complex structures | 0.16 ± 0.11 * | 0.23 ± 0.13 | 0.23 ± 0.13 | 0.36 ± 0.11 |
| Verbs | 1.11 ± 0.43 * | 1.41 ± 0.33 | 1.43 ± 0.29 | 1.69 ± 0.22 |
| Nouns | 1.46 ± 0.48 * | 1.25 ± 0.54 * ° | 1.93 ± 0.43 | 2.09 ± 0.41 |
| Existential subjects | .044 ± .037 + | .128 ± .081 * | .116 ± .125 | .046 ± .024 |
|
| ||||
| NEUROPSYCHOLOGICAL MEASURES: COMPREHENSION, EXECUTIVE, SEMANTIC | ||||
| Sentence comprehension (max = 48) | 32.6 ± 8.3 * (7) | 26.3 ± 4.8 * (6) | 35.9 ± 8.7 (7) | 46.0 ± 1.2 (5) |
| Reverse digit span | 3.0 ± 1.7 * (11) | 2.9 ± 1.9 (10) | 3.8 ± 1.4 (8) | 5.6 ± 1.3 (5) |
| Stroop time (max = 300 s) | 252 ± 47 * (10) | 285 ± 37 * (6) | 189 ± 96 (6) | 84 ± 14 (5) |
| Animal fluency (#/min) | 10.3 ± 4.9 * (11) | 9.8 ± 6.6 * (10) | 13.4 ± 6.7 * (8) | 25.3 ± 5.4 (6) |
NOTES
differs from Controls, p<.01
differs from SemD, p<.01
differs from SOC/EXEC, p<.01.
Numbers in parentheses for the neuropsychological tests indicate the numbers of participants who performed these tests.
Table 3 shows the correlations of speech fluency with language and cognitive measures that were significantly impaired. Non-fluent speech in PNFA correlated significantly with several measures of structure, including shorter MLU and fewer grammatically complex sentences. Reduced fluency also correlated significantly with fewer verbs per utterance but not with nouns per utterance. While speech errors were a prominent feature of PNFA patients, we did not find a correlation between fluency (words per minute) and the frequency of speech errors. Likewise, there was no significant correlation between fluency and sentence comprehension or executive measures in PNFA.
Table 3.
Correlations of speech fluency (words per minute) with significantly impaired measures of language and cognition in frontotemporal lobar degeneration1
| PNFA | SemD | SOC/EXEC | |
|---|---|---|---|
| SPEECH OUTPUT | |||
| Speech errors | −.53 | - | - |
| Total words | .74 * | - | - |
|
| |||
| GRAMMAR, STRUCTURE, CONTENT PER UTTERANCE | |||
| Mean length of utterance | .66 * | - | - |
| Complex structures | .61 * | - | - |
| Verbs | .69 * | - | - |
| Nouns | −.25 | .26 | - |
| Existential subjects | - | −.80 * | - |
|
| |||
| NEUROPSYCHOLOGICAL MEASURES: COMPREHENSION, EXECUTIVE, SEMANTIC | |||
| Sentence comprehension | .46 | .67 | - |
| Reverse digit span (working memory) | −.28 | - | - |
| Stroop time (inhibitory control) | −.10 | −.21 | - |
| Animal fluency (semantic mental search) | −.05 | .33 | .85 * |
NOTES
Correlations are provided for all measures that were significantly impaired relative to controls.
p<.05; for all other correlations, p>.10.
Figure 1 Panel A illustrates the anatomic distribution of gray matter atrophy in PNFA, and the anatomic loci of the peaks of these clusters are summarized in Table 4. Statistically significant gray matter atrophy was seen in inferior frontal, insula, and superior occipital regions of the left hemisphere. Figure 1 Panel A and Table 4 also indicate the area of cortical volume related to non-fluent speech across the cohort of all FTLD patients. This included left inferior frontal and superior temporal cortex. This area overlaps a region of cortical atrophy in PNFA involving left inferior frontal cortex.
Figure 1.
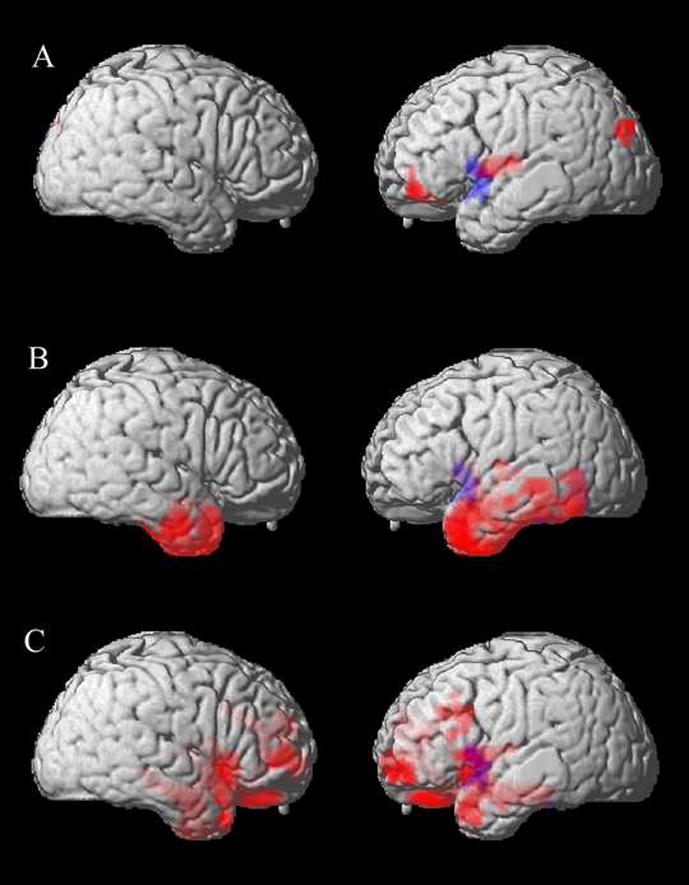
Correlations between cortical atrophy and speech fluency in progressive non-fluent aphasia, semantic dementia, and patients with a social and executive disorder. Red areas indicate the anatomic distribution of significant cortical atrophy in each subgroup. The blue area indicates the distribution of the significant association between non-fluent speech and cortical volume for all FTLD patients. Panel A: PNFA; Panel B: SemD; Panel C: SOC/EXEC.
Table 4.
Significant gray matter atrophy in patients with frontotemporal lobar degeneration and significant association of non-fluent speech (words per minute) with gray matter atrophy
| Anatomic Locus (Brodmann Area) | Coordinates | Z-Score | Cluster Size (Voxels) | ||
|---|---|---|---|---|---|
| X | Y | Z | |||
| Gray Matter Atrophy Relative to Controls | |||||
| PNFA | |||||
| L inferior frontal/insula (44) | −40 | −11 | 12 | 4.46 | 350 |
| L inferior frontal (11) | −30 | 46 | −9 | 3.87 | 269 |
| L superior occipital (19) | −34 | −80 | 32 | 3.97 | 192 |
| SemD | |||||
| L inferior temporal (38/20/21) | −28 | −7 | −22 | 5.53 | 6446 |
| L inferior frontal/insula (6) | −42 | −13 | 12 | 4.29 | 175 |
| R inferior temporal (38/20/21) | 28 | −5 | −22 | 5.01 | 2806 |
| SOC/EXEC | |||||
| L superior frontal (9) | −8 | 42 | 15 | 4.42 | 827 |
| L middle frontal (9) | −44 | 17 | 29 | 4.19 | 253 |
| L superior temporal (38) | −48 | 12 | −22 | 3.98 | 257 |
| L amygdala | −32 | −9 | −21 | 4.90 | 1677 |
| R middle frontal (10) | 34 | 55 | 3 | 4.50 | 295 |
| R superior temporal (38) | 48 | 13 | −17 | 4.09 | 222 |
| R uncus | 26 | −5 | −23 | 5.17 | 4998 |
| Gray Matter Areas Related to Reduced Speech Fluency | |||||
| All FTLD | |||||
| L inferior frontal/superior temporal (44/22) | −57 | 7 | −5 | 4.18 | 154 |
3.2. Semantic Dementia
Table 2 shows that SemD patients had significantly slowed speech relative to controls. They also showed impairments on measures of noun production, semantic content of sentences, sentence comprehension, semantically mediated executive functioning, and inhibitory control relative to controls, but they were not impaired on grammatical production measures. Table 3 shows that speech fluency correlated significantly only with frequency of semantically impoverished (existential) sentences. There was significant bilateral anterior temporal lobe atrophy, and a small region of atrophy extended into the left inferior frontal cortex and insula. The association of speech fluency with cortical volume for the entire set of FTLD patients overlaps this superior temporal and inferior frontal region of atrophy.
3.3. Social/Executive Disorder
As shown in Table 2, SOC/EXEC patients produced significantly slowed speech relative to controls, but they did not differ on any other measure of speech, including grammatical production or content. They were, however, impaired on a measure of mental search. Table 3 shows that reduced speech fluency was correlated with executive functioning only in SOC/EXEC patients. Figure 1 Panel C and Table 4 show significant gray matter atrophy in middle and inferior frontal as well as anterior temporal regions bilaterally. The region of reduced speech fluency associated with cortical volume overlaps left inferior frontal and superior temporal regions of atrophy in SOC/EXEC.
4. DISCUSSION
Patients with PNFA have significantly less fluent speech than controls and other patients with FTLD. We find that non-fluent speech in PNFA correlates with measures of syntax, but not with speech errors or executive limitations. Speech fluency is also significantly reduced in SemD. While these patients are impaired on measures of speech production, comprehension, and executive functioning, none of these variables correlates significantly with fluency of speech. In SOC/EXEC patients, the executive measure of category naming fluency correlates with speech rate. Thus, there appear to be distinct sources of non-fluent speech in subgroups of patients with FTLD. Furthermore, non-fluent speech appears to have partially distinct neuroanatomic associations within the left inferior frontal and superior temporal regions of these patient subgroups. We discuss each FTLD subgroup in detail below.
4.1. Progressive Non-Fluent Aphasia
Speech in PNFA is often described clinically as effortful and agrammatic (Gorno-Tempini et al., 2004; Grossman et al., 1996; Weintraub et al., 1990). The slowing of speech and reduction of output has been noted in previous assessments of spontaneous speech in PNFA and other FTLD syndromes (Amici, Ogar et al., 2007; Graham, Patterson, & Hodges, 2004; Orange, Kertesz, & Peacock, 1998; Rogers & Alarcon, 1998; Thompson et al., 1997). Several hypotheses have been advanced to explain non-fluent speech in PNFA: an account based on a linguistic deficit; a modality-specific account related to AOS; and a hypothesis related to executive resource limitations. We are not aware of studies that compare the contributions of these factors to the non-fluent speech of PNFA.
We find that speech in PNFA is significantly non-fluent in a semi-structured sample of narrative speech. This co-occurs with a significant reduction in syntactically complex utterances relative to controls, and correspondingly, these patients’ mean MLU is significantly reduced. These measures of syntactic complexity correlate significantly with non-fluent speech in PNFA. However, we find that non-fluent speech is not related to sentence comprehension in PNFA, although this may depend in part on the specific measure used to assess grammatical comprehension (Amici, Brambati et al., 2007). Studies of Broca’s aphasia following stroke also dissociate non-fluent and agrammatic speech from a disorder of sentence comprehension (Miceli, Mazzucchi, Menn, & Goodglass, 1983). This observation of a modality-specific deficit at first appears to be consistent with a deficit that compromises word formation and articulation as a consequence of AOS (Josephs et al., 2006; Ogar et al., 2007). It is frequently remarked that PNFA patients produce many speech errors. This characteristic has been noted in previous work (Gorno-Tempini et al., 2006; Josephs et al., 2006; Ogar et al., 2007), and we find that it is statistically robust in our sample in comparison to other FTLD patients. Among the speech errors observed in PNFA are simple sound substitutions, approximations of phonemes that miss the phonetic target, and instances where the speaker’s intended target cannot be determined. However, the frequency of speech errors does not correlate with reduced rate of speech in PNFA. Thus errors in production do not account for the slowed speech of these patients.
Our observations may be most consistent with an account of non-fluent speech that invokes a syntactic deficit (Grossman et al., 1996; Grossman et al., 2005; Peelle, Cooke, Moore, Vesely, & Grossman, 2008), by which speech may be non-fluent in PNFA because the rules governing long-distance syntactic dependencies are degraded. A related observation is that PNFA patients also show reduced verb production in their speech samples. Previous work has shown that confrontation naming of action verbs is impaired in PNFA (Hillis, Oh, & Ken, 2004; Hillis, Tuffiash, & Caramazza, 2002). The present study extends the observation of limited verb use to a semi-structured sample of spontaneous speech and shows that verb production correlates with speech rate in PNFA. Reduced verb use may also contribute to the syntactic difficulty in PNFA because verbs play a crucial role in structuring sentences. Verbs appear to be more difficult to process than nouns in PNFA (Rhee, Antiquena, & Grossman, 2001), again linking language processing to a resource limitation. PNFA patients also produce fewer nouns, but this does not correlate with reduced speech fluency, possibly reflecting the lesser contribution of nouns to grammatical structure.
It is also possible that a disorder of executive functioning may interfere with planning in language as well as in other cognitive domains (Kramer et al., 2003; Libon et al., 2007; Weintraub et al., 1990). Category naming assesses a form of fluency that has little bearing on the production of connected speech; hence it is unsurprising that category naming fluency does not correlate with speech rate. However, executive resources appear to support the processing of syntactic dependencies within sentences, and it may be a limitation of these resources that compromises syntactic processing in PNFA. For example, slowed information processing speed appears to play a role in the impairment of syntactic processing mediated by working memory (Peelle, Cooke et al., 2008).
The present study found significant left inferior frontal and insula atrophy in PNFA. Left frontal disease has been reported in previous imaging (Gorno-Tempini et al., 2004; Grossman et al., 1996; Nestor et al., 2003) and clinical-pathological (Josephs et al., 2006) studies of PNFA, although these findings have not been directly related to speech rate. Additionally, there appears to be some left occipital atrophy, perhaps reflecting the presence of corticobasal degeneration that is associated with PNFA (Murray et al., 2007).
The whole-brain VBM analysis in this study was unbiased by a priori hypotheses that select a region of interest. The analysis associated non-fluent speech with left inferior frontal and superior temporal cortical volume in FTLD. This observation agrees in part with a report of cortical volume related to fluency as measured by the Western Aphasia Battery semi-quantitative assessment of spontaneous speech fluency in a large set (N=51) of patients with FTLD, Alzheimer’s disease, and corticobasal degeneration (Amici, Ogar et al., 2007). Previous work has related effortful speech in non-fluent stroke aphasics to left inferior frontal cortex (Alexander et al., 1989; Alexander et al., 1990; Mohr & Whitaker, 1976). We observed that the area that correlated with speech rate overlaps the area of left inferior frontal atrophy in PNFA. While other areas of significant atrophy are apparent in PNFA, it is likely that this left inferior frontal region is specifically implicated in the non-fluent speech of these patients because of the overlapping distributions of brain-behavior functioning and subgroup atrophy. We found left occipital atrophy in PNFA as well, but this does not overlap with the area related to non-fluent speech and is thus less likely to be involved in this aspect of PNFA behavior. Given the association of non-fluent speech with limitations in syntax and verb use in speech production, left inferior frontal cortex may be invoked in syntactic processing during fluent speech production. Recent fMRI work associates this area with the recruitment of working memory during grammatical processing (Cooke et al., 2005). Additional work is needed to establish more precisely the basis for non-fluent speech in PNFA.
4.2. Semantic Dementia
Speech fluency is reduced in SemD, although not to the same extent as in PNFA. Speech in SemD is clinically characterized by circumlocutions and word-finding pauses (Hodges & Patterson, 2007). This may be due in part to a deficit in the representation of word meaning that interferes with lexical retrieval (Grossman et al., 2004), but quantitative documentation of this association is lacking. In the present study, SemD produced significantly fewer content words per utterance than controls, and reduced speech fluency correlated with the frequency of existential subjects, which represent semantically impoverished content.
Significant bilateral anterior temporal atrophy was found in SemD (Gorno-Tempini et al., 2004; Grossman et al., 2004). The atrophy was more extensive in the left hemisphere than the right hemisphere and extended superiorly to involve a modest area of the left inferior frontal and insula region. We may have observed this superior extension because the SemD patients participating in this study had their disease on average for longer than did the patients in the other groups. Alternatively, the sensitivity of our novel imaging technique may have significantly improved our ability to ascertain the distribution of cortical atrophy in these patients.
Cortical atrophy in SemD overlapped the area of cortical volume that correlated with non-fluent speech in left superior temporal and inferior frontal cortex. The association of non-fluent speech with left anterior superior temporal regions is consistent with evidence suggesting that this region plays an important role in word-level processes (Indefrey & Levelt, 2004; Scott & Wise, 2004), in comprehension of syntax (Friederici, Meyer, & von Cramon, 2000; Friederici, Ruschemeyer, Hahne, & Fiebach, 2003), and in construction of basic phrase structures in speech production (Hickok & Poeppel, 2007; Humphries, Love, Swinney, & Hickok, 2005). The partial overlap with atrophy in left inferior frontal cortex also seen in PNFA calls into question the precise basis for this association. fMRI studies of healthy adults relate left inferior frontal cortex to resources involved in selection from semantic memory (Thompson-Schill, D’Esposito, Aguirre, & Farah, 1997; Wagner, Pare-Blagoev, Clark, & Poldrack, 2001). This suggests that left inferior frontal cortex may support executive resources that contribute to tasks such as production of syntax and lexical semantic selection, and the specific manifestation of disease in this area depends on the large-scale network that is otherwise interrupted in each of these groups. Using diffusion tensor imaging, we find that PNFA and SemD have distinct patterns of abnormal white matter projections (Asmuth, Zhang, & Grossman, 2008). PNFA appear to have abnormalities in projections posteriorly through the superior frontal-occipital fasciculus and contralaterally through the corpus callosum, while SemD have abnormal projections posteriorly through the inferior frontal-occipital fasciculus and the arcuate fasciculus. Additional work is needed to relate non-fluent speech to diffusion tensor imaging studies of PNFA and SemD.
4.3. Social/Executive Disorder
Patients with a SOC/EXEC disorder have reduced speech fluency relative to controls, although they are not aphasic, and this correlates with their impaired category naming fluency. SOC/EXEC also demonstrate impaired discourse, in which expression is poorly organized, often wandering from the main topic, and interspersed with irrelevant material (Ash et al., 2006). This is related to a limitation of executive functioning as well (Ash et al., 2006). It seems possible that features such as apathy (Rosen et al., 2005) or poor mental organization (Libon et al., 2007) may contribute to reduced fluency in these patients. Additional work is needed to determine why impaired category naming fluency correlates with reduced speech fluency only in patients with a SOC/EXEC disorder.
We found extensive bilateral frontal and temporal cortical atrophy in SOC/EXEC patients, in keeping with previous observations (Grossman et al., 2004; Rosen et al., 2005). Atrophy in these brain regions may contribute to limited planning and organization in the speech of these patients at the level of narrative (Ash et al., 2006). Even though the anatomic distribution of disease overlaps in left inferior frontal cortex in SOC/EXEC and PNFA, speech fluency in SOC/EXEC patients is not as compromised as in PNFA. This may be due in part to the different distributions of abnormal white matter projections in SOC/EXEC compared to PNFA (Asmuth et al., 2008). Additional work is needed to establish the basis for reduced fluency in these patients.
Acknowledgments
This work was supported by the National Institutes of Health (AG17586, AG15116, NS44266, NS53488) and the Charles Dana Foundation.
APPENDIX A
Speech Samples
A 79-year-old woman with a 4-year history of PNFA symptoms began her narrative as follows:
-
(1)
Here is a boy
(H)e looks /lak eed {like he’d} em an r-r-r/ all night
The vrog, i? in a bottle {rising pitch}
And they were eh- outside.
The moon uh, shaying, eh djeh, žanning I 3 window.
See you ss . see-e-u . (h)e- (h)e is using 3 off . .
and they ge? . a frog g-g-gets out of the b-barrel {Ex: m-hm} . glass barrel. (10 sec)
And the dog 3 stands on a, is quite use {voiceless} (t)o with tha?, a baz view. (4 sec)
Haaowraaanh
There your dog k-ch-ch/ow lay 3 zeey/ and is I::, is in 3 is in 3 bottle . .
A:n /k sow bam/ . his clothes (8 sec)
and he looks out of the window
Dog go- goes ..
and dth3 {the} (h)is (h)ead’s still in /ba:w:/, in the glass /ba:w:/ {bottle} (4 sec)
And 3 {eh} when he pick3s up, the dog, he licks him (16 sec)
You gonna /viygs/ {fix} m now
A sample of speech from a 69-year-old SemD patient with a 7-year history of symptoms illustrates the paucity of lexicon in spontaneous speech:
-
(2)
And he was sleeping with two animals
and one animal woke him up
and he had his shoes or something on.
Another animal, the other animal got his head in a glass and a bottle, whatever it’s called.
I’m sorry.
And then he fell outside with it and broke it
and he went out and got him.
Then they were outside taking a look at the uh weather, him and his dog
and then the animal came up out of the ground
and the dog was after the animal
and the son went up on a, uh, tree.
Fell down off the tree because there was a … bird that got him.
An 86-year-old man with a 3-year history of SOC/EXEC symptoms provides an example of these patients’ difficulty in appreciating the elements relevant to the story line in a sequence of scenes. The speaker here is talking about the first three pages of the story. In the first picture, a boy and his dog are looking at a frog in a jar in the boy’s bedroom. In the second picture, the frog climbs out of the jar while the boy and dog are sleeping, and in the third, it is morning, and the boy and dog are looking with surprise and dismay at the empty jar.
-
(3)
The boy and the dog (2 sec) looking in, {chuckling} into a jar with a frog and this is in their bedroom.
The boy is asleep in his bed.
The frog is in a jar.
And his {chuckling} .. his . . his boots are on the floor, nex- next to his uh … next to his shirt.
Boy’s in bed (2 sec) next to his dog.
His boots are on the floor . .
and so are his sandals . . and an empty jar, and his shirt.
The boy’s in his bedroom.
APPENDIX B
A. Language variables
Total words produced
Our principal measure of speech fluency is based on a word count. We counted every complete word in the narrative, including repetitions.
Speech fluency
We divided the total word output by the duration of the narrative to derive a measure of words per minute (WPM) reflecting speech fluency.
Number of utterances
An utterance was defined as a T-unit (Hunt, 1965), which consists of an independent clause and all clauses or phrases dependent on it. Thus a series of three independent clauses conjoined by and is counted as three utterances. A stretch of speech that formed an incomplete T-unit was also counted as an utterance.
Speech errors
We counted the number of occurrences per utterance of subjects’ productions of deviant speech sounds. Suprasegmental vocalizations, such as tongue clicking, creaky voice, or breathiness, were disregarded; only segmental phonemic productions (vowels and consonants) were considered in the tabulation of speech errors. For purposes of this report, we did not classify errors any further by attempting to discriminate among apraxia of speech, phonological paraphasias, and other possible types of errors. A detailed analysis of speech errors will be reported separately.
Nouns
All nouns were counted, regardless of function or position as subject, object, extraposition, etc.
Verbs
Both finite and non-finite verb forms were included. Finite verb forms are those marked for number, tense, and aspect. Non-finite verbs are infinitives and participles that are used in a verbal sense, not a nominal sense. For example, the main verb is trying and the infinitive to reach occur in “Spot is trying to reach the beehive.” In “[The deer] carries little Joe to the edge of the cliff, with Spot following, barking all the way,” there is one inflected verb, carries, and two non-finite verb forms, following and barking. But in “Joe heard the barking of a dog,” barking is a gerund, serving the function of a noun, and is not counted as a verb.
The presence of a verb in an utterance reflects both access to semantics and competence in syntax. Because of the heavy load of grammatical marking on the finite verb, including number, tense, and aspect, the core of the structure of a sentence or clause is borne by the inflected verb.
Complex sentences
These are utterances that include either or both of dependent clauses or phrasal adjuncts, as follows:
Dependent clause
A dependent clause is defined as a phrase containing a subject and a predicate that cannot stand alone by virtue of being introduced by a subordinating conjunction (while, when, because, than, etc.), a relativizer (who, which, why, that, etc.) or a complementizer (that, as in “The boy thought that the frog might be inside the log.”). Some authors consider phrases introduced by an infinitive or a participle to constitute dependent clauses, but in the present study we followed the convention of requiring that a phrase contain a subject and an inflected verb in order to be considered as constituting a clause.
Phrasal adjunct
A phrasal adjunct is a phrase that is outside the subject noun phrase and outside the verb phrase: the content applies to the sentence as a whole. Frequently, a phrasal adjunct is introduced by an infinitive verb or a gerund:
They went out in the woods to see if they could find a frog.
They went along, looking for the frog.
A phrasal adjunct may also set the stage by giving time or place:
At that point, the frog took off to go outside and go somewhere else.
It is characteristic of a phrasal adjunct that it can be moved within the sentence:
To see if they could find a frog, they went out in the woods.
Looking for the frog, they went along (the path).
The frog took off to go outside and go somewhere else at that point.
Existential subjects
These are utterances in which the subject has no semantic content but holds the place of the grammatical subject, as in “There’s a young guy,” or “And here’s a dog.”
Footnotes
Publisher's Disclaimer: This is a PDF file of an unedited manuscript that has been accepted for publication. As a service to our customers we are providing this early version of the manuscript. The manuscript will undergo copyediting, typesetting, and review of the resulting proof before it is published in its final citable form. Please note that during the production process errors may be discovered which could affect the content, and all legal disclaimers that apply to the journal pertain.
References
- Alexander MP, Benson DF, Stuss DT. Frontal lobes and language. Brain and Language. 1989;37:656–691. doi: 10.1016/0093-934x(89)90118-1. [DOI] [PubMed] [Google Scholar]
- Alexander MP, Naeser MA, Palumbo C. Broca’s area aphasia: aphasia after lesions including the frontal operculum. Neurology. 1990;40:353–362. doi: 10.1212/wnl.40.2.353. [DOI] [PubMed] [Google Scholar]
- Amici S, Brambati SM, Wilkins DP, Ogar J, Dronkers NL, Miller BL, et al. Anatomical correlates of sentence comprehension and verbal working memory in neurodegenerative disease. J Neurosci. 2007;27(23):6282–6290. doi: 10.1523/JNEUROSCI.1331-07.2007. [DOI] [PMC free article] [PubMed] [Google Scholar]
- Amici S, Ogar J, Brambati SM, Miller BL, Neuhaus J, Dronkers NL, et al. Performance in specific language tasks correlates with regional volume changes in progressive aphasia. Cogn Behav Neurol. 2007;20(4):203–211. doi: 10.1097/WNN.0b013e31815e6265. [DOI] [PubMed] [Google Scholar]
- Ash S, Moore P, Antani S, McCawley G, Work M, Grossman M. Trying to tell a tale: Discourse impairments in progressive aphasia and frontotemporal dementia. Neurology. 2006;66:1405–1413. doi: 10.1212/01.wnl.0000210435.72614.38. [DOI] [PubMed] [Google Scholar]
- Asmuth J, Zhang H, Grossman M. DTI analysis of white matter deficits in frontotemporal lobar dementia. Neurology. 2008;70:A452. [Google Scholar]
- Avants B, Gee JC. Geodesic estimation for large deformation anatomical shape and intensity averaging. Neuroimage. 2004;23:S139–S150. doi: 10.1016/j.neuroimage.2004.07.010. [DOI] [PubMed] [Google Scholar]
- Boersma P, Weenink D. Praat, v. 4.3.27. Institute of Phonetic Sciences, University of Amsterdam; 1992–2000. [Google Scholar]
- Canter GJ, Trost JE, Burns MS. Contrasting speech patterns in apraxia of speech and phonemic paraphasia. Brain Lang. 1985;24(2):204–222. doi: 10.1016/0093-934x(85)90131-2. [DOI] [PubMed] [Google Scholar]
- Cooke A, DeVita C, Gonzalez-Atavales J, Moore P, Chen W, Gee JC, et al. Large-scale neural network for sentence processing. Brain and Language. 2005;96:14–36. doi: 10.1016/j.bandl.2005.07.072. [DOI] [PubMed] [Google Scholar]
- Dronkers NF. A new brain region for coordinating speech articulation. Nature. 1996;384:159–161. doi: 10.1038/384159a0. [DOI] [PubMed] [Google Scholar]
- Folstein MF, Folstein SF, McHugh PR. “Mini Mental State.” A practical method for grading the cognitive state of patients for the clinician. Journal of Psychiatric Research. 1975;12:189–198. doi: 10.1016/0022-3956(75)90026-6. [DOI] [PubMed] [Google Scholar]
- Friederici AD, Meyer M, von Cramon DY. Auditory language comprehension: an event-related fMRI study on the processing of syntactic and lexical information. Brain Lang. 2000;74(2):289–300. doi: 10.1006/brln.2000.2313. [DOI] [PubMed] [Google Scholar]
- Friederici AD, Ruschemeyer SA, Hahne A, Fiebach CJ. The role of left inferior frontal and superior temporal cortex in sentence comprehension: Localizing syntactic and semantic processes. Cerebral Cortex. 2003;13:170–177. doi: 10.1093/cercor/13.2.170. [DOI] [PubMed] [Google Scholar]
- Gorno-Tempini, Dronkers NF, Rankin KP, Ogar JM, Phengrasamy L, Rosen HJ, et al. Cognition and anatomy in three variants of primary progressive aphasia. Ann Neurol. 2004;55(3):335–346. doi: 10.1002/ana.10825. [DOI] [PMC free article] [PubMed] [Google Scholar]
- Gorno-Tempini, Ogar JM, Brambati SM, Wang P, Jeong JH, Rankin K, et al. Anatomical correlates of early mutism in progressive nonfluent aphasia. Neurology. 2006;67:1849–1851. doi: 10.1212/01.wnl.0000237038.55627.5b. [DOI] [PubMed] [Google Scholar]
- Graham NL, Patterson K, Hodges JR. When more yields less: speaking and writing deficits in nonfluent progressive aphasia. Neurocase. 2004;10(2):141–155. doi: 10.1080/13554790409609945. [DOI] [PubMed] [Google Scholar]
- Grossman M, Ash S. Primary progressive aphasia: A review. Neurocase. 2004;10:3–18. doi: 10.1080/13554790490960440. [DOI] [PubMed] [Google Scholar]
- Grossman M, Libon DJ, Forman MS, Massimo L, Wood E, Moore P, et al. Distinct antemortem profiles in pathologically defined patients with frontotemporal dementia. Archives of Neurology. 2007;64:1601–1609. doi: 10.1001/archneur.64.11.1601. [DOI] [PubMed] [Google Scholar]
- Grossman M, McMillan C, Moore P, Ding L, Glosser G, Work M, et al. What’s in a name: Voxel-based morphometric analyses of MRI and naming difficulty in Alzheimer’s disease, frontotemporal dementia, and corticobasal degeneration. Brain. 2004;127:628–649. doi: 10.1093/brain/awh075. [DOI] [PubMed] [Google Scholar]
- Grossman M, Mickanin J, Onishi K, Hughes E, D’Esposito M, Ding XS, et al. Progressive nonfluent aphasia: Language, cognitive and PET measures contrasted with probable Alzheimer’s disease. Journal of Cognitive Neuroscience. 1996;8(2):135–154. doi: 10.1162/jocn.1996.8.2.135. [DOI] [PubMed] [Google Scholar]
- Grossman M, Rhee J, Antiquena P. Sentence processing in frontotemporal dementia. Cortex. 2005;41:764–777. doi: 10.1016/s0010-9452(08)70295-8. [DOI] [PubMed] [Google Scholar]
- Hickok G, Poeppel D. The cortical organization of speech processing. Nature Rev Neurosci. 2007;8:393–402. doi: 10.1038/nrn2113. [DOI] [PubMed] [Google Scholar]
- Hillis AE, Oh S, Ken L. Deterioration of naming nouns versus verbs in primary progressive aphasia. Annals of Neurology. 2004;55:268–275. doi: 10.1002/ana.10812. [DOI] [PubMed] [Google Scholar]
- Hillis AE, Tuffiash E, Caramazza A. Modality-Specific Deterioration in Naming Verbs in Nonfluent Primary Progressive Aphasia. The Journal of Cognitive Neuroscience. 2002;14:1099–1108. doi: 10.1162/089892902320474544. [DOI] [PubMed] [Google Scholar]
- Hodges JR, Patterson K. Semantic dementia: A unique clinicopathological syndrome. Lancet Neurology. 2007;6:1004–1014. doi: 10.1016/S1474-4422(07)70266-1. [DOI] [PubMed] [Google Scholar]
- Humphries C, Love T, Swinney D, Hickok G. Response of anterior temporal cortex to syntactic and prosodic manipulations during sentence processing. Hum Brain Mapp. 2005;26(2):128–138. doi: 10.1002/hbm.20148. [DOI] [PMC free article] [PubMed] [Google Scholar]
- Hunt KW. Grammatical structures written at three grade levels. Champaign, IL: National Council of Teachers of English; 1965. [Google Scholar]
- Indefrey P, Levelt WJM. The spatial and temporal signatures of word production components. Cognition. 2004;92:101–144. doi: 10.1016/j.cognition.2002.06.001. [DOI] [PubMed] [Google Scholar]
- Josephs KA, Duffy JR, Strand EA, Whitwell JL, Layton KF, Parisi JE, et al. Clinicopathological and imaging correlates of progressive aphasia and apraxia of speech. Brain. 2006;129:1385–1398. doi: 10.1093/brain/awl078. [DOI] [PMC free article] [PubMed] [Google Scholar]
- Josephs KA, Whitwell JL, Duffy JR, Vanvoorst WA, Strand EA, Hu WT, et al. Progressive aphasia secondary to Alzheimer disease vs FTLD pathology. Neurology. 2008;70(1):25–34. doi: 10.1212/01.wnl.0000287073.12737.35. [DOI] [PMC free article] [PubMed] [Google Scholar]
- Kramer JH, Jurik J, Sha SJ. Distinctive neuropsychological patterns of frontotemporal dementia, semantic dementia, and Alzheimer’s Disease. Cognitive and Behavioral Neurology. 2003;16:211–218. doi: 10.1097/00146965-200312000-00002. [DOI] [PubMed] [Google Scholar]
- Lambon Ralph MA, Graham KS, Ellis AW, Hodges JR. Naming in semantic dementia - what matters? Neuropsychologia. 1998;36:775–784. doi: 10.1016/s0028-3932(97)00169-3. [DOI] [PubMed] [Google Scholar]
- Lezak M. Neuropsychological assessment. Oxford: Oxford University Press; 1983. [Google Scholar]
- Libon DJ, Xie SX, Moore P, Farmer J, Antani S, McCawley G, et al. Patterns of neuropsychological impairment in frontotemporal dementia. Neurology. 2007;68:369–375. doi: 10.1212/01.wnl.0000252820.81313.9b. [DOI] [PubMed] [Google Scholar]
- Lieberman P, Kako E, Friedman J, Tajchman G, Feldman LS, Jiminez EB. Speech production, syntax comprehension, and cognitive deficits in Parkinson’s disease. Brain and Language. 1992;43:169–189. doi: 10.1016/0093-934x(92)90127-z. [DOI] [PubMed] [Google Scholar]
- Mayer M. Frog, Where Are You? New York: Penguin Books; 1969. [Google Scholar]
- McKhann G, Trojanowski JQ, Grossman M, Miller BL, Dickson D, Albert M. Clinical and pathological diagnosis of frontotemporal dementia: Report of a work group on frontotemporal dementia and Pick’s disease. Archives of Neurology. 2001;58:1803–1809. doi: 10.1001/archneur.58.11.1803. [DOI] [PubMed] [Google Scholar]
- Miceli G, Mazzucchi A, Menn L, Goodglass H. Contrasting cases of Italian agrammatic aphasia without comprehension disorder. Brain and Language. 1983;19:65–97. doi: 10.1016/0093-934x(83)90056-1. [DOI] [PubMed] [Google Scholar]
- Mohr JP, Whitaker H. Studies in neurolinguistics. Vol. 1. New York: Academic Press; 1976. Broca’s area and Broca’s aphasia. [Google Scholar]
- Murray R, Neumann M, Forman MS, Farmer J, Massimo L, Rice A, et al. Cognitive and motor assessment in autopsy-proven corticobasal degeneration. Neurology. 2007;68:1274–1283. doi: 10.1212/01.wnl.0000259519.78480.c3. [DOI] [PubMed] [Google Scholar]
- Neary D, Snowden JS, Gustafson L, Passant U, Stuss D, Black S, et al. Frontotemporal lobar degeneration: A consensus on clinical diagnostic criteria. Neurology. 1998;51:1546–1554. doi: 10.1212/wnl.51.6.1546. [DOI] [PubMed] [Google Scholar]
- Nestor PJ, Graham NL, Fryer TD, Williams GB, Patterson K, Hodges JR. Progressive non-fluent aphasia is associated with hypometabolism centred on the left anterior insula. Brain. 2003;126:2406–2418. doi: 10.1093/brain/awg240. [DOI] [PubMed] [Google Scholar]
- Ogar JM, Dronkers N, Brambati SM, Miller B, Gorno-Tempini M. Progressive nonfluent aphasia and its characteristic motor deficits. Alzheimer’s Disease and Associated Disorders. 2007;21:S23–S30. doi: 10.1097/WAD.0b013e31815d19fe. [DOI] [PubMed] [Google Scholar]
- Orange JB, Kertesz A, Peacock J. Pragmatics in frontal lobe dementia and primary progressive aphasia. Journal of Neurolinguistics. 1998;11(1–2):25. [Google Scholar]
- Peelle J, Cooke A, Moore P, Vesely L, Grossman M. Syntactic and thematic components of sentence processing in progressive nonfluent aphasia and nonaphasic frontotemporal dementia. Journal of Neurolinguistics. 2008;20:482–494. doi: 10.1016/j.jneuroling.2007.04.002. [DOI] [PMC free article] [PubMed] [Google Scholar]
- Peelle J, Troiani V, Gee J, Moore P, McMillan C, Vesely L, et al. Sentence comprehension and voxel-based morphometry in progressive nonfluent aphasia, semantic dementia, and nonaphasic frontotemporal dementia. Journal of Neurolinguistics. 2008;21:418–432. doi: 10.1016/j.jneuroling.2008.01.004. [DOI] [PMC free article] [PubMed] [Google Scholar]
- Rhee J, Antiquena P, Grossman M. Verb comprehension in frontotemporal degeneration: the role of grammatical, semantic and executive components. Neurocase. 2001;7(2):173–184. doi: 10.1093/neucas/7.2.173. [DOI] [PubMed] [Google Scholar]
- Rogers MA, Alarcon NB. Dissolution of spoken language in primary progressive aphasia. Aphasiology. 1998;12(7/8):16. [Google Scholar]
- Rosen HJ, Allison SC, Schauer GF, Gorno-Tempini ML, Weiner MW, Miller BL. Neuroanatomical correlates of behavioural disorders in dementia. Brain. 2005;128:2612–2625. doi: 10.1093/brain/awh628. [DOI] [PMC free article] [PubMed] [Google Scholar]
- Scott SK, Wise RJ. The functional neuroanatomy of prelexical processing in speech perception. Cognition. 2004;92(1–2):13–45. doi: 10.1016/j.cognition.2002.12.002. [DOI] [PubMed] [Google Scholar]
- Smith SM. Fast robust automated brain extraction. Hum Brain Mapp. 2002;17(3):143–155. doi: 10.1002/hbm.10062. [DOI] [PMC free article] [PubMed] [Google Scholar]
- Snowden JS, Goulding PJ, Neary D. Semantic dementia: A form of circumscribed cerebral atrophy. Behavioral Neurology. 1989;2:167–182. [Google Scholar]
- Snowden JS, Neary D, Mann DM. Fronto-temporal Lobar Degeneration: Fronto-temporal Dementia, Progressive Aphasia, Semantic Dementia. New York: Churchill Livingstone; 1996. [Google Scholar]
- Spreen O, Strauss E. A Compendium of Neuropsychological Tests. New York: Oxford University Press; 1991. [Google Scholar]
- Stuss DT, Benson DF. Neuropsychological studies of the frontal lobes. Psychological Bulletin. 1984;95:3–28. [PubMed] [Google Scholar]
- The Lund Manchester Group A. Clinical and neuropathological criteria for frontotemporal dementia. Journal of Neurology, Neurosurgery, and Psychiatry. 1994;57:416–418. doi: 10.1136/jnnp.57.4.416. [DOI] [PMC free article] [PubMed] [Google Scholar]
- Thompson-Schill SL, D’Esposito M, Aguirre G, Farah MJ. Role of left inferior prefrontal cortex in retrieval of semantic knowledge: A reevaluation. Proceedings of the National Academy of Sciences of the USA. 1997;94:14792–14797. doi: 10.1073/pnas.94.26.14792. [DOI] [PMC free article] [PubMed] [Google Scholar]
- Thompson CK, Ballard KJ, Tait ME, Weintraub S, Mesulam M. Patterns of language decline in non-fluent primary progressive aphasia. Aphasiology. 1997;11:297–331. [Google Scholar]
- Turner RS, Kenyon LC, Trojanowski JQ, Gonatas N, Grossman M. Clinical, neuroimaging, and pathologic features of progressive non-fluent aphasia. Annals of Neurology. 1996;39:166–173. doi: 10.1002/ana.410390205. [DOI] [PubMed] [Google Scholar]
- Wagner AD, Pare-Blagoev EJ, Clark J, Poldrack RA. Recovering meaning: Left prefrontal cortex guides controlled semantic retrieval. Neuron. 2001;31:329–336. doi: 10.1016/s0896-6273(01)00359-2. [DOI] [PubMed] [Google Scholar]
- Wechsler D. Wechsler memory scale - revised. San Antonio: The Psychological Corporation; 1987. [Google Scholar]
- Weintraub S, Rubin NP, Mesulam MM. Primary progressive aphasia: Longitudinal course, neuropsychological profile, and language features. Archives of Neurology. 1990;47:1329–1335. doi: 10.1001/archneur.1990.00530120075013. [DOI] [PubMed] [Google Scholar]
- Zhang Y, Brady M, Smith S. Hidden Markov random field model for segmentation of brain MR images. SPIE Proceedings. 2000;3979:1126–1138. doi: 10.1109/42.906424. [DOI] [PubMed] [Google Scholar]