

Abstract
This review covers progress in the development of cytometric methodologies designed to assess DNA replication and RNA synthesis. The early approaches utilizing autoradiography to detect incorporation of 3H- or 14C-labeled thymidine were able to identify the four fundamental phases of the cell cycle G1, S, G2, and M, and by analysis of the fraction of labeled mitosis (FLM), to precisely define the kinetics of cell progression through these phases. Analysis of 3H-uridine incorporation and RNA content provided the means to distinguish quiescent G0 from cycling G1 cells. Subsequent progress in analysis of DNA replication was based on the use of BrdU as a DNA precursor and its detection by the quenching of the fluorescence intensity of DNA-bound fluorochromes such as Hoechst 33358 or acridine orange as measured by flow cytometry. Several variants of this methodology have been designed and used in studies to detect anticancer drug-induced perturbations of cell cycle kinetics. The next phase of method development, which was particularly useful in studies of the cell cycle in vivo, including clinical applications, relied on immunocytochemical detection of incorporated halogenated DNA or RNA precursors. This approach however was hampered by the need for DNA denaturation, which made it difficult to concurrently detect other cell constituents for multiparametric analysis. The recently introduced “click chemistry” approach has no such limitation and is the method of choice for analysis of DNA replication and RNA synthesis. This method is based on the use of 5-ethynyl-2′deoxyuridine (EdU) as a DNA precursor or 5-ethynyluridine (EU) as an RNA precursor and their detection with fluorochrome-tagged azides utilizing a copper (I) catalyzed [3+2] cycloaddition. Several examples are presented that illustrate incorporation of EdU or EU in cells subjected to DNA damage detected as histone H2AX phosphorylation that have been analyzed by flow or laser scanning cytometry.
Keywords: cell cycle, flow cytometry, laser scanning cytometry, click chemistry, 5-ethynyl-2′deoxyuridine incorporation, 5-ethynyluridine incorporation, H2AX phosphorylation, UV light, S-phase
Historical Outlook
Autoradiography
Cytometry is defined as quantitative analysis of individual cells and cell constituents. Within the context of this definition, autoradiography and some other early methods of measuring cells such as microspectrophotometry, microfluorometry, and microinteferometry, represent branches of cytometry that preceded flow cytometry. Prior to the dawn of flow cytometry, during 1950s and 60s, autoradiography was the major methodology utilized to measure DNA replication and transcriptional activity in individual cells. Autoradiography relied on analysis of incorporation of the radioactive precursor of DNA (e.g., 3H- or 14C- labeled thymidine) or RNA (3H- or 14C-uridine). The application of nuclear emulsion to the cells on slides followed by photographic silver-grain development provided a means to detect the radiation associated with precursor incorporation. Despite of cumbersome nature of autoradiographic procedures, which required long exposure times and dark-room photographic emulsion processing followed by visual silver grain counts, important discoveries were made. Thus, it could be determined that DNA replication is discontinuous, occurring within a distinct time interval during interphase. This finding led to identification of four major phases of the cell cycle: the DNA pre-synthetic interphase or the “post-mitotic gap” (G1), DNA synthesis phase (S), post-synthetic interphase or "pre-mitotic gap" (G2), and mitosis (M) (1). These phases are still recognized as a foundation of the cell cycle subdivision.
The very elegant technique based on pulse-labeling cells with 3H-thymidine followed by analysis of the percentage of labeled cells moving through mitosis was developed to assess kinetics of cell progression through the cell cycle (2). In this technique, the kinetics of progression of the cohort of cells labeled during the short pulse in S phase through a narrow time-window in M phase provided the means to accurately estimate the duration of each phase of the cycle (TG1, TS, TG2,TM) as wells as the cell cycle duration (Tc). This “frequency of labeled mitosis” (FLM) method was subsequently widely used in cell proliferation studies in vitro and in vivo (3,4).
Another approach to assess kinetics of cell cycle progression relied on cell arrest in mitosis by mitotic blockers such as colcemid or vinblastine and quantification of frequency of mitotic cells as a function of duration of treatment with the blocker (5). This “stathmokinesis”-based methodology was an alternative to autoradiography in cell kinetics studies and was often utilized in studies of mechanism of action of antitumor drugs on cell cycle progression. In vitro and in vivo applications of 3H- or 14C-thymidine autoradiography yielded significant information on cell cycle distribution and the kinetics of cell proliferation of several normal and cancer cell models (3,6–8). Continuous in vivo labeling with 3H-thymidine made it possible to define the tumor growth fraction as a cohort of proliferating cells responsible for tumor expansion (9), as well as to distinguish the non-proliferating (quiescent, G0) cells in normal bone marrow (10).
The rate of DNA transcription was estimated by counting silver grain densities in the nuclear emulsion over individual cells that were previously exposed in vitro or in vivo to 3H- or 14C-labeled uridine. The induction of RNA synthesis during mitogenic stimulation of peripheral blood normal lymphocytes, revealed by the synthesis of “rapidly labeled” RNA, detected by autoradiography, made it possible to characterize the early transition of cells from the quiescent G0 to the transcriptionally active G1 state (11). Transcriptional activity and cellular RNA content have subsequently become characteristic and widely used biomarkers to discriminate G1 from G0 cells (12).
Initial Measurements of DNA Synthesis by Flow Cytometry: Fluorescence Quenching upon Incorporation of Halogenated Precursors
The capability of rapid and accurate measurements of cell constituents offered by flow cytometry made it the instrument of choice in analysis of cell proliferation and cell physiology. Instead of radioactive markers, the incorporation of halogenated nucleotides has become the foundation providing new vistas to analyze DNA replication and RNA synthesis. The early progress in this area was characterized by methodological approaches stemming from the observation that the intensity of Hoechst 33358 fluorescence was reduced (quenched) upon binding to DNA containing 5-bromo-2-deoxyyridine (BrdU) (13). The BrdU-incorporating cells therefore could be identified based by their property of quenching Hoechst 33358 fluorescence and the degree of quenching was proportional to the extent of BrdU incorporation. Further progress has been marked by the combined staining of DNA with Hoechst 33358 and with a dye whose fluorescence was unaffected by the incorporated BrdU, such as ethidium bromide (EB). This approach made it possible to identify BrdU-incorporating cells and at the same time to reveal the distribution of cells across all phases of the cell cycle, i.e., G1 vs. S vs. G2M (14). An extension of this methodology involved long-term pulse labeling with BrdU, through one or more cell generations, followed by staining with Hoechst 33342 and EB. This approach made it possible to estimate several kinetic parameters of cell cycle progression during sequential cell division cycles (15,16).
An elegant procedure that made it possible to measure cellular DNA content (cell cycle phases) concurrently with DNA replication was developed by Crissman and Steinkamp (17). In their approach following incorporation of BrdU, cellular DNA was stained with both, Hoechst 33358 and mithramycin. While Hoechst 33358 fluorescence of DNA containing incorporated BrdU was quenched, fluorescence of mithramycin was not. The differential fluorescence was obtained by subtracting the fluorescence signal of Hoechst 33358 from that of mithramycin, on cell by cell basis, which represented the extent of BrdU incorporation per given cell. When this differential fluorescence was plotted versus intensity of mithramycin fluorescence (DNA content) the bivariate distributions revealed the classical pattern of BrdU incorporation across the phases of the cell cycle (17).
Another approach employed the metachromatic properties of acridine orange (AO) which differentially stains double stranded versus single stranded (denatured) DNA and allows one to identify mitotic cells by flow cytometry (18). Since fluorescence of AO bound to DNA containing incorporated BrdU, as with Hoechst 33358, is quenched, by combining BrdU incorporation and staining with AO it become possible to distinguish BrdU-labeled and -unlabeled mitotic cells (18). In analogy to the autoradiographic method of Quastler and Sherman (2), this approach made it possible to measure, by cytometry, a variety of kinetic parameters of cell cycle progression based on the percentage of labeled mitoses (19).
Immunocytochemical Detection of Incorporated Halogenated Precursors: Analysis of DNA Replication
Further advances in methodological development to detect DNA replication and RNA synthesis by flow cytometry stemmed from the development of antibodies (Abs) targeting the halogenated precursor and immunocytochemical detection of the precursor incorporated into DNA or RNA (20,21). Analysis of DNA replication by this method required the induction of partial DNA denaturation to make the incorporated BrdU or IdU accessible to the Ab (22,43). DNA denaturation was usually accomplished by treatment of cells with strong acid (2 M HCl) or heat (85–95°C). The bivariate analysis of BrdU incorporation and cellular DNA content provided a significant advance in the methodology (22,23). In this approach, an antibody (Ab) tagged with green-fluorescing fluorophore (e.g., FITC or AlexaFluor® 488) was used to detect the incorporated BrdU or IdU on the single-strand (denatured) DNA sections while the non-denatured, double-stranded DNA sections were concurrently counterstained with a red fluorescing fluorochrome such as propidium iodide (PI) or 7-aminoactinomycin D (7-AAD). The bivariate distributions of cells stained in this way revealed cellular DNA content (and therefore the cell distribution or DNA ploidy) as well as the presence of incorporated BrdU or IdU, indicating the fraction of cells synthesizing DNA (22). For the next two decades this approach became the predominant methodology used to assess DNA replication in conjunction with cell cycle analysis. It was particularly useful in studies of the kinetics of cell cycle progression in normal cells and in tumors. Several mathematical models have been developed to analyze the movement of the cohort of BrdU pulse-labeled cells through subsequent cell cycle phases (24,25). Of particular importance in clinical oncology was the method developed by Begg et al. (24) to measure the duration of S phase (TS) and the potential doubling time (Tpot) of tumor cells, from a single sample collected at a particular time after in vivo administration of BrdU.
Time-separated short pulse-exposures of cells to two different halogenated DNA precursors such as IdU and CldU, subsequently detected immunocytochemically using Abs labeled with fluorochromes emitting at different wavelengths, was proposed as a new strategy to significantly expand the analysis of the cell cycle kinetics through consecutive cell divisions in a relatively simple flow cytometric assay (26–28). This elegant double-labeling technique for cell cycle kinetic analysis was reminiscent of the autoradiographic approach utilizing short consecutive pulses of cells exposed to 3H- and 14C-labeled thymidine. These DNA precursors were subsequently distinguished on the autoradiograms by differences in length of the tracks of the silver-grains in the nuclear emulsion (29,30).
As mentioned previously, immunocytochemical detection of incorporated BrdU typically required the harsh step of DNA denaturation by acid or heat. This treatment often ruined cell morphology, and also damaged the epitope of many proteins, precluding their immunocytochemical detection with fluorescence-labeled Abs. Therefore attempts were made to omit the denaturation step in order to make the detection of BrdU incorporation compatible with the use of other immunocytochemical probes. One approach toward this goal was partial DNA degradation with nucleases such as DNase I to make some DNA sections accessible to the BrdU Ab (31). This method did not receive wide acceptance perhaps due to the difficulty in obtaining reproducible (constant) levels of DNA degradation with DNase I when analyzing different cell types or samples.
Another approach for BrdU detection that omits the DNA denaturation step was based on DNA strand breaks induction by photolysis (SBIP) (32–34). This method relied on illumination of cells with UV light to selectively photolyse DNA (induce DNA breaks) at the sections containing the incorporated BrdU. DNA strand breaks generated by photolysis are subsequently labeled with a fluorochrome-tagged deoxynucleotide by utilizing exogenous terminal deoxynucleotidyl transferase, in analogy to the TUNEL assay, developed to detect DNA breaks in apoptotic cells (35,36). Several kits that rely on this methodology are now commercially available (e.g., ABSOLUTE-SBIP; Molecular Probes, Eugene, OR or Phoenix Flow Systems, San Diego, CA).
Applications of the SBIP methodology made it possible to correlate the expression of cyclin A and cyclin B1, two key proteins driving the cell through the cell cycle, with initiation and termination of DNA replication during S phase (34). Figure 1 illustrates this approach. In this experiment MOLT-4 cells were exposed for 60 min to BrdU and then illuminated with UV light to selectively photolyse DNA at sites that had incorporated BrdU. The cells were then fixed and DNA strand breaks resulting from the photolysis were labeled again with BrdU using terminal transferase and BrdUTP; BrdU was subsequently detected immunocytochemically with anti-BrdU Ab tagged with FITC, without a need for DNA denaturation. Cyclin A or cyclin B1 was detected with phycoerythrin (PE)-conjugated Ab and DNA was counterstained with 7-aminoactinomycin D (7AAD) (34). Gating analysis revealed that the elevated level of expression of cyclin A coincided with the time when cells entered S phase during the 60-min pulse exposure to BrdU (SE). Likewise, the rise in expression of cyclin B1 coincided with entrance to G2 phase (G2E) (34).
Figure 1.

Application of the DNA strand breaks induction by photolysis (SBIP) methodology in analyzing the correlation between cyclin A or cyclin B1 expression with the initiation and termination of DNA replication (34). Five cell subpopulations can be distinguished on the bivariate BrdU incorporation vs. DNA content distribution: G1 and G2/M cells showing no BrdU incorporation, SE and G2E cells having variable level of BrdU and representing the cells entering S and G2, respectively, during the BrdU pulse, and S-cells with a maximal and relatively constant level of BrdU (A). The color-gating analysis made it possible to correlate the expression of cyclins A and B1 in these cell subpopulations (B, C) as well as to show a correlation between BrdU incorporation and expression of cyclin A (D). Dashed lines represent the background fluorescence of the control cells not incubated with BrdU (A) or incubated with the isotype IgG instead of cyclin-Abs (B,D).
Another application of the SBIP technique is shown in Figure 2. In this application, the SBIB approach was used to detect DNA replicating cells concurrent with cells undergoing apoptosis (33). Sequential labeling of DNA strand breaks, first those induced by apoptosis with PE, then the breaks induced by DNA photolysis with FITC and counterstaining DNA with 7-AAD made it possible to simultaneously detect DNA replication and apoptosis and to correlate them with cell cycle phase (33).
Figure 2.

Detection of DNA replication by the SBIP approach simultaneous with identification of apoptotic cells by the TUNEL technique (33). HL-60 cells were exposed for 30 min to BrdU, rinsed, transferred to 43.5°C for 30 min then incubated at 37°C for 3 h and fixed. Initially the apoptosis-induced DNA strand breaks were labeled with biotin-dUTP followed by streptavidin–PE conjugate utilizing the TUNEL protocol. The cells were subsequently illuminated with UV to photolyse DNA having incorporated BrdU and the resulting strand breaks were TUNEL-labeled with BrdUTP followed by FITC-tagged anti BrdU Abs. Cellular DNA was counterstained with 7-AAD. Fluorescence was measured with a single-laser (488 nm) flow cytometer with no compensation (33). Streptavidin-PE orange fluorescence (Fl 2) identifies apoptotic cells (Ap) as shown in A. When these cells are gated out and the sample is measured in the green detection channel (Fl 3) DNA replicating cells (S) are distinctly evident (B). When Ap cells are gated in and measured in the FITC Fl 3 channel they have even higher fluorescence intensity that S-phase cells due to a large number of strand breaks and strong green component of the PE emission. The images of the SBIP-labeled cells in the right panel show a typical pattern of “DNA replication factories” (37), SBIP unlabeled cells are marked with arrows.
Analysis of RNA Synthesis
As in the case of DNA replication, the flow cytometric analysis of RNA synthesis was based on immunocytochemical detection of the incorporated halogenated RNA precursor, BrU or BrUTP (38,39). There are several variants of this methodology, differing primarily in the procedure by which the cells were permeabilized to make the incorporated BrU accessible to Ab (40). All variants utilized Abs marketed as anti BrdU which happen to cross-reacts with BrU. This is expected since nearly all commercially available BrdU Abs were generated using 5-bromouridine rather than 5-bromo-2-deoxyuridine to immunize rodents or rabbits. Either direct or indirect immunocytochemical procedures employing Ab tagged with fluorochromes of any desired emission and excitation properties could be used. Depending on the duration of the BrU pulse during in vitro incubation, one could preferentially incorporate BrU either into the rapidly turning over RNA found in nucleoli and associated with synthesis and processing of pre-ribosomal RNA species, or incorporate into messenger or ribosomal RNA (41,42).
Cytometric assessment of BrU incorporation combined with analysis of cellular DNA content using the respective DNA and RNA probes of different emission color provided the basis for correlating the overall transcriptional activity with cell cycle phase or cell ploidy (40–42). Detection of the incorporated BrU concurrent with cell surface immunophenotyping offered the possibility to correlate cell phenotype with its transcriptional activity (39).
Recent Advances: The “Click Chemistry” Approach
Bypassing Limitations of Prior Methods
Several limitations plague immunocytochemical cytometric methods designed to detect DNA replication. As mentioned, the “classic” methodology that requires the induction of partial DNA denaturation (22,43) ruins cell morphology and destroys the native structure of proteins preventing either surface immunophenotyping or detecting intracellular proteins immunocytochemically. One approach to circumvent the denaturation step utilizing partial DNA digestion with nucleases was difficult to standardize in terms of the degree of DNA hydrolysis (31). Another attempt to omit DNA denaturation, based on photolysis of DNA (SBIP) (32,33), is rather complex as it requires illumination of cells with a proper, optimized dose of UV light.
While cellular RNA has a multitude of structures, containing single-stranded (ss) as well as double-stranded (ds) sections, the detection of BrU incorporated into ss RNA does not require a denaturation step. However, because some ss RNA sections are in complexes with proteins, their accessibility to Ab may be limited due to steric hindrance. Furthermore, since large portion of RNA is ds, its denaturation is required to allow the precursor accessibility to all the RNA. In the absence of full RNA denaturation, the fraction of RNA that is labeled following incubation with BrU is unknown.
Principles of the Click Chemistry Approach
The “click chemistry” approach to assess DNA replication (44) and RNA synthesis (45) overcomes the limitations of the prior methodologies as outlined above. The method is based on the use of 5-ethynyl-2′deoxyuridine as a DNA precursor and 5-ethynyluridine as an RNA precursor. These precursors once incorporated by the cells into DNA or RNA, respectively, can be detected with fluorochrome-tagged azides by means of a copper (I) catalyzed [3+2] cycloaddition reaction defined as “click chemistry” (46–48). Among the advantages of this method one should note the small size of the fluorescent azides that more easily penetrates into the specimen as opposed to the larger sized BrdU Abs. Thus, the accessibility of the EdU to the azides is greater than of BrdU to an Ab. Furthermore, compared with the BrdU labeling, the “click chemistry” method is simpler and more rapid. The greatest advantage, however, stems from the fact that no DNA denaturation is required. A convenient kit containing all necessary reagents and protocol for the click chemistry methodology (“Click-iT™) is commercially available from Molecular Probes/Invitrogen (Carlsbad, CA).
Applications of the Click Chemistry Methodology in Cytometry
Flow Cytometry
Although the click chemistry-based methodology designed to detect DNA replication (44,49) and RNA synthesis (45) was introduced only very recently there are already several reports of its applications in cytometry. A variant of this methodology described by Capella et al. (50) also utilizes EdU as a DNA precursor incorporated into live cells. However, in their method, the exposed nucleotide alkyne moiety in DNA instead of being derivatized by Cu(I)-catalyzed azide-alkyne cycloaddition directly with azide-tagged fluorochrome is derivatized with BrdU-tagged azide. The attached BrdU can then be detected immunocytochemically with the BrdU Ab as in the classic procedure of DNA labeling with BrdU developed by Gratzner (20) and Dolbeare et al. (22). While this procedure also does not require a DNA denaturation step, and is therefore compatible with immunocytochemical detection of surface and intracellular proteins, it is more complex in comparison with the Salic and Mitchison method (44) since it has an additional step involving the immunocytochemical detection of BrdU. Furthermore, being a much larger molecule than the complex of azide-tagged fluorochrome, the fluorochrome-tagged BrdU-Ab may encounter greater steric hindrance in attaching to the incorporated precursor.
Using the Salic and Mitchison (44) approach, Yu et al. (51) observed a good correlation between the standard assay of proliferation of spleen lymphocytes based on 3H-thymidine incorporation and EdU incorporation detected by flow cytometry. The authors studied the effect of partial immune reconstitution on the response of lymphocytes from purine nucleoside phosphorylase defective mice after their mitogenic stimulation by CD-3 Abs (51). They concluded that the EdU-click methodology can be used as an alternative to 3H-thymidine incorporation. Different methods of cell fixation and permeabilization to optimize the detection of the incorporated EdU were explored by Hamelik and Krishan (52).
Interesting in vivo studies were recently carried out by Jensen et al. (53) who administered EdU to mice and at different time intervals analyzed both the incorporation of the precursor and the immunophenotype of the keratinocytes. The cells were fixed in a Zinc (Zn) salt-based solution which unlike formaldehyde does not crosslink proteins or nucleic acids. As a result, nucleic acids can be extracted and analyzed by gel electrophoresis and/or subjected to PCR. This approach combines the analytical capabilities of cytometry and molecular biology that collectively can be used to assess DNA replication in subpopulations of cells characterized by a particular immunophenotype and upon cell sorting to extract DNA, RNA, or protein, and then use PCR, RT-PCR, or Western blotting to analyze these subpopulations.
The applicability of the EdU-click methodology in cell kinetics or tracking studies was thoroughly explored in elegant studies by Diermeier-Daucher et al. (54). Using several cell lines the authors studied the effect of EdU on DNA synthesis, cell cycle progression and viability, comparing it with BrdU. They observed rather minor differences between BrdU and EdU. They concluded that as with BrdU, EdU could be used not only for pulse-labeling but also for continuous labeling in dynamic studies of cell cycle progression. However, noticing the increased sensitivity of breast cancer lines BT474 and SK-BR-3 to EdU, the authors cautioned that any potential cytostatic/cytotoxic effect of this precursor on a particular cell type should be examined before using this approach to assess cell cycle progression (54,55). The application of the EdU-click methodology to assess DNA replication in synchronized bacteria (E. coli) was recently reported by Ferullo et al. (56).
We took advantage of the analytical capabilities offered by the click chemistry approach to explore, by flow cytometry, a possible correlation between DNA replication and induction of histone H2AX phosphorylation in cells subjected to DNA damage by treatment with the DNA topoisomerase I inhibitor topotecan (Tpt), an analogue of camptothecin (Cpt) (57). Histone H2AX phosphorylation on Ser139 is a sensitive biomarker of DNA damage response and phosphorylated H2AX, which can be detected with a phospho-specific Ab, has been defined as γH2AX (58). We previously observed that treatment with Tpt induces DNA damage manifesting as histone H2AX phosphorylation predominantly in the S-phase cells (59,60); subsequently the S-phase cells undergo apoptosis (57,59). Therefore, it was expected that, upon cell treatment with Cpt or Tpt, histone H2AX phosphorylation would be detected primarily in DNA replicating cells. As it is evident from the data shown in Figure 3 such a correlation indeed was demonstrated. In this experiment, the human lymphoblastoid TK6 cells were incubated with EdU to label DNA replicating cells, and concurrently exposed to Tpt. The incorporated EdU was then detected using azide conjugated to the AlexaFluor® 488 fluorochrome emitting green fluorescence while phosphorylated H2AX was detected immunocytochemically using AlexaFluor 647® tagged Ab which fluoresces red. DNA was counterstained with blue-fluorescing 4′,6-diamidino-2-phenylindole (DAPI). The multiparameter “paint-a-gate” analysis made it possible to “paint” DNA replicating (EdU-incorporating) cells red (Fig. 3 left panels) and on the bivariate EdU versus γH2AX distributions (Fig. 3 right panels) to observe that the cells expressing γH2AX from the Tpt-treated cultures were predominantly the same that incorporated EdU i.e., marked red. These data thus demonstrate that the immunocytochemical detection of γH2AX with phospho-specific Ab is fully compatible with the detection of DNA replication by using the click chemistry.
Figure 3.

Assessment of DNA damage response revealed by histone H2AX phosphorylation induced by treatment of TK6 cells with DNA topoisomerase I inhibitor topotecan (Tpt) vis-a-vis DNA replication (EdU incorporation). The three top panels represent control cultures that were exposed to 5′-ethynyl-2-deoxyuridine (EdU) for 70 min, and then harvested. The bottom three panels show cultures exposed to 0.2 μM of topotecan (Tpt) for the final 40 min of the 70 min exposure to EdU. The incorporated EdU was subsequently detected by “click chemistry” using a click-IT™ reagents kit provided by Invitrogen-Molecular Probes (Carlsbad, CA) with AlexaFluor® 488 tagged azide. Histone H2AX phosphorylation was detected immunocytochemically using AlexaFluor® 647 secondary Ab (far red fluorescence) and DNA was counterstained with DAPI (blue fluorescence), as described elsewhere (61). Cellular fluorescence was measured using a MoFlo XDP (Beckman-Coulter) high speed flow cytometer/sorter. Using “paint-a-gate” multivariate analysis the EdU incorporating cells (above the skewed line, left panels) were electronically colored red, EdU negative cells blue. When re-plotted as bivariate distributions on the DNA content (DAPI) versus γH2AX coordinates (mid-panels) the expression of phosphorylated H2AX (γH2AX) can be related to EdU incorporation. It is quite evident that in the culture treated with Tpt, phosphorylation of H2AX (expression of γH2AX) occurred predominantly in the DNA replicating cells (bottom mid-panel). Also, the extent of EdU incorporation was distinctly decreased in Tpt-treated cells compared to control (bottom left panel). Right panels show the correlation between H2AX phosphorylation and EdU incorporation. The insets in mid-panels show the DNA content histograms with EdU incorporating cells marked red. [Color figure can be viewed in the online issue, which is available at wileyonlinelibrary.com.]
The successful application of EdU in vivo has been described by Kaiser et al.(62) who assessed DNA replication in proliferating cells in the regenerating cochlea of two-week-old chicks. Using the EdU-click approach these authors were able to correlate EdU incorporation with the expression of several proteins related to cochlear regeneration detected immunocytochemically.
Click Chemistry by Laser Scanning Cytometry (LSC)
We have tested the applicability of EdU- and EU-click methodology using laser scanning cytometry (LSC), an instrumentation that combines the analytical capabilities of flow- and image cytometry (63,64). The latest versions of the LSC (iGeneration: iCyte®, iCys®, and iColor®) provide fluorescence excitation with up to four laser wavelengths (selected from 405, 488, 532, 561, 594, and 633 nm) and four photomultipliers allowing fluorescence measurements in wavelength bands appropriate for the respective excitation wavelengths. Its current software offers highly sophisticated multivariate data collection and analysis (65,66). In the first set of experiments utilizing the EdU-click methodology we explored whether propidium iodide (PI), a fluorochrome commonly used as a viability probe has the potential to affect DNA replication (67). Figure 4 illustrates the results of the experiment in which the untreated and PI-treated cells were pulse labeled for 60 min with EdU which subsequently was detected using azide tagged with AlexaFluor 633. Cellular DNAwas counterstained with DAPI and the various fluorescence emissions measured by LSC. The bivariate DNA content versus EdU incorporation distributions reveal excellent signal to noise ratio in discriminating the EdU labeled versus unlabeled cells. In addition, the high resolution of the DNA content frequency histograms (Fig. 4) demonstrates, as was also the case with flow cytometry (Fig. 1), that the procedure of cell labeling with EdU and its detection by fluorochrome tagged azide has no deleterious effect on subsequent DNA stainability with DAPI.
Figure 4.

Detection of DNA replication by EdU click chemistry in human pulmonary adenocarcinoma A549 cell untreated and treated for 48 h with 1.5 μM propidium iodide (PI). Exponentially growing cells either untreated (A, B, and D) or treated with PI (1.5 μM) for 48 h (C) were incubated with 10 μM EdU for 60 min and then fixed. The incorporated EdU was detected with AlexaFluor® 488 tagged azide using the Click-IT™ kit (Invitrogen-Molecular Probes). Cellular blue (DAPI) and green (AlexaFluor 488) fluorescence was measured by laser scanning cytometry (67). Cells from the control culture not incubated with EdU but processed identically including treatment with Alexa-Fluor 488 azide are shown in Panel A. Bivariate distributions illustrate DNA content (DAPI fluorescence) versus incorporation of EdU [fluorescence intensity integrated over the nucleus (B,C) or maximal pixel (D)]. The insets show DNA content frequency histograms from the respective cultures. The upper threshold of the control, EdU unlabeled cells is marked by the dashed skewed line. The cells with variable levels of EdU incorporation marked enS and exS represent the cells entering to- and exiting from- S phase during the time of the EdU pulse; such cells were exposed to the precursor for variable time intervals (up to 60 min) while replicating DNA. [Color figure can be viewed in the online issue, which is available at wileyonlinelibrary.com.]
The variability in intensity of EdU labeling makes it also possible to identify and count the cells that were entering (enS) and exiting S (exS) phase during the 60 min-pulse with the precursor (Fig. 4). In fact, the apparent differences in the frequency of enS versus exS cells reveals the different rates of cell cycle progression during the initial- and the last- 60 min of the S phase interval. Specifically, in asynchronous cultures the probability of detection of the cells traversing S phase increments of the same time duration (“time windows”) is inversely proportional to the rate of traverse through these increments (68). As it is evident from the data shown in Figure 4, fewer cells were exiting S (exS) than entering S phase (enS). This indicates that the rate of progression through the initial 60-min increment of S phase (initiation of DNA replication) was distinctly slower than through the last 60-min increment.
Also of interest is the variability of EdU incorporation by cells in mid-S phase expressed as the intensity of maximal pixel (Panel D). The cells with the highest intensity of incorporated EdU (marked with oval dashed outline, D) likely represent cells which during the exposure to EdU maintained the DNA replication foci (“factories”), known to contain high local concentrations of enzymes required for chromatin replication thereby reflecting a high rate of DNA replication (37). As it is evident, growth of cells in the presence of 1.5 μM PI for 48 h had little or no effect on either the cell cycle distribution or DNA replication (see Ref. 67 for further details).
In another set of experiments, we explored the relationship between DNA replication and DNA damage caused by UV-B light (61). In these experiments, click chemistry offered the possibility of combining the analysis of DNA replication with phosphorylation of histone H2AX. We had previously observed that illumination with UV triggers DNA damage response revealed by H2AX phosphorylation (69). The experiment shown in Figure 5 was designed to explore a possible correlation between H2AX phosphorylation induced by exposure to UV and DNA replication. Toward this end exponentially growing A549 cells were pulse-labeled with EdU for 60 min, and then were exposed to 50 J/m2 of UV light, and subsequently incubated for 30 min before culture termination. The incorporated EdU was detected using Alexa Fluor® 488 azide (green fluorescence), expression γH2AX was detected immunocytochemically using Alexa Fluor 633 secondary Ab (far red fluorescence), while DNA was counterstained with DAPI (blue fluorescence) and cellular fluorescence measured by LSC (Fig. 5). Using “paint-a-gate” multivariate analysis, the EdU incorporating cells (Fig. 5A) above the skewed dashed line were electronically colored red. As in Figure 4 the cells with variable level of EdU incorporation could be identified as entering (enS) or exiting (exS) S phase, respectively, during the pulse exposure to EdU. It is evident that when the data were re-plotted as bivariate distributions on DNA content (DAPI) versus γH2AX coordinates (Panel B) expression of γH2AX is essentially limited to the red colored cells (EdU-positive) cells. Panel C shows the bivariate analysis of EdU incorporation versus expression of γH2AX. A strong correlation between the degree of H2AX phosphorylation (intensity of γH2AX immunofluorescence) and the level of EdU incorporation is seen among the EdU incorporating (red) cells; the regression plot is marked with a dashed line. Thus, the data reveals that the UV-induced DNA damage response manifesting as H2AX phosphorylation occurs essentially only in DNA replicating cells and is strongly proportional to the extent of DNA replication at the time of UV illumination.
Figure 5.
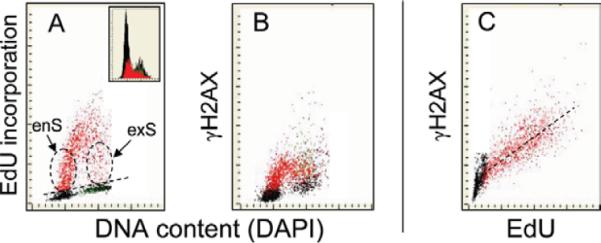
Correlation between DNA replication detected by EdU incorporation and the UV-induced H2AX phosphorylation detected immunocytochemically in A549 cells. Exponentially growing cells were incubated for 60 min with EdU then exposed to 50 J/m2 of UV-B light, incubated for 30 min and fixed. The incorporated EdU was detected using Alexa Fluor 488 azide (green fluorescence), γH2AX was detected immunocytochemically with Alexa Fluor 633 secondary Ab (far red fluorescence), DNA was stained with DAPI (blue fluorescence) and fluorescence was measured by LSC (61). Using the “paint-a-gate” multiparameter analysis, the EdU-incorporating cells were marked as red (A). Note that expression of γH2AX is predominantly in the EdU incorporating cells (B) and is proportional to the intensity of EdU labeling (C). [Color figure can be viewed in the online issue, which is available at wileyonlinelibrary.com.]
It should be noted that the subpopulation of cells with the increased expression of γH2AX but not incorporating EdU (61) was gated out from Panel C in Figure 5. These cells were characterized by high intensity of maximal pixel of DAPI fluorescence, the marker of strongly condensed chromatin. Imaging by iCys “CompuSort” and measuring their cellular DNA content revealed that these cells were mitotic (including prophase) cells that had a DNA index (DI) of 2.0 and condensed chromatin. This observation is consistent with our prior findings that the level of the constitutive H2AX phosphorylation reporting DNA damage by endogenously generated oxidants in control, untreated cell populations, is maximal in G2 and M cells (70,71). Our data demonstrate that the immunocytochemical detection of γH2AX with phospho-specific Ab is fully compatible with the concurrent labeling and the detection of incorporated EdU using the EdU-click methodology regardless of whether fluorescence is measured by flow cytometry (Fig. 3) or LSC (Fig. 5).
Figure 6 illustrates cytometric detection of EU incorporated into RNA. In this experiment we have estimated the degree of suppression of RNA synthesis in A549 cells exposed to different concentrations of the DNA topoisomerase II inhibitor mitoxantrone (Mxt) in relation to the induction of cell senescence (66). The data shows that cell senescence could be induced only at low (2 nM) Mxt concentrations, at which the rate of transcription was not markedly (<50%) inhibited. Higher Mxt concentrations led to strong inhibition of the rate of RNA synthesis that resulted in delayed apoptosis rater than senescence. These data were compatible with the mechanism of induction of cell senescence when the arrest in cell cycle progression is not accompanied by total suppression of cell growth (72).
Figure 6.

Effect of treatment of A549 cells with the DNA topoisomerase II inhibitor mitoxantrone (Mxt) on the rate of transcription as measured by 5-ethynyluridine (EU) incorporation during 30-min incubation with the precursor. The cells were untreated (Ctrl) or treated with 2 and 20 nM Mxt for 4 h, then the RNA precursor 5-ethynyluridine (EU) was added for 30 min. The incorporation of EU was detected using the “click chemistry” (45) with AlexaFluor 633 tagged azide. Note significant, Mxt-concentration dependent, decrease in incorporation of EU in all phases of the cell cycle in the drug treated cells (see Ref. 67 for further details). [Color figure can be viewed in the online issue, which is available at wileyonlinelibrary.com.]
It should be noted the detection of RNA synthesis by analysis of EU incorporation mediated by the click chemistry is particularly advantageous compared with the incorporation of BrU. As mentioned before, large sections of RNA have double stranded conformation and some sections are in complexes with proteins. This impedes accessibility of the incorporated precursor to large molecules such as Abs. The steric hindrance in the accessibility of the EU incorporated into RNA to the fluorochrome-tagged azide is expected to be much less compared to the accessibility of the Ab to incorporated BrU.
Caution should be exercised, however, in interpreting data on EU (or BrU) incorporation as representing the rate of RNA synthesis. This pertains also to the DNA precursors EdU (or BrdU). There is an uncertainty about the rates of uptake of labeled precursors, which may differ from that of natural, unlabeled precursors and may differ from one cell type to the next. Furthermore, incorporation of labeled precursors is affected by the size of the pool of endogenous natural precursors, which is unknown and expected to vary in different cell types. Thus, any observed differences in the rate of incorporation of 5′ethynyl or halogenated nucleotides (typically measured as the amount of fluorescence) between different cells, should not be assumed to reflect actual differences in the rates of DNA replication or transcription.
Taking into account the simplicity of the staining protocol, excellent resolution of DNA histograms (Figs. 3 and 4), high sensitivity, accessibility of the incorporated precursor (EdU or EU) to the fluorochrome-tagged azides, and compatibility with immunocytochemical procedures, the click chemistry approach opens entirely new analytical capabilities in cell biology and medicine. It can be expected that this approach, in conjunction with flow or imaging cytometry, will be widely used to correlate DNA replication and/or transcription with a variety of other cell attributes such as cell cycle progression, growth, metabolic activity, responses to drug treatment, apoptosis, or senescence.
Acknowledgments
Grant sponsor: NCI; Grant number: R01 28 704;
Literature Cited
- 1.Howard A, Pelc SR. Nuclear incorporation of P32 as demonstrated by auto-radiographs. Exp Cell Res. 1951;2:178–187. [Google Scholar]
- 2.Quastler H, Sherman FG. Cell population kinetics in the intestinal 1 epithelium of the mouse. Exp Cell Res. 1959;17:420–428. doi: 10.1016/0014-4827(59)90063-1. [DOI] [PubMed] [Google Scholar]
- 3.Baserga R. The Biology of Cell Reproduction. Harvard University Press; Cambridge, MA: 1985. [Google Scholar]
- 4.Gray JW, Darzynkiewicz Z. Techniques in Cell Cycle Analysis. Humana Press; Clifton, NJ: 1987. [Google Scholar]
- 5.Puck TT, Steffen J. Life cycle analysis of mammalian cells. I. A method for localizing metabolic events within the life cycle and its application to the action of Colcemid and sublethal doses of X-irradiation. Biophys J. 1963;3:379–397. doi: 10.1016/s0006-3495(63)86828-9. [DOI] [PMC free article] [PubMed] [Google Scholar]
- 6.Darzynkiewicz Z, Crissman HA, Jacobberger JW. Cytometry of the cell cycle: Cycling through history. Cytometry A. 2004;58A:21–31. doi: 10.1002/cyto.a.20003. [DOI] [PubMed] [Google Scholar]
- 7.Lloyd D, Poole RK, Edwards SW. The Cell Division Cycle. Temporal Organization of Cellular Growth and Reproduction. Academic Press; London: 1982. [Google Scholar]
- 8.Steel GG. Growth Kinetics of Tumors: Cell Population Kinetics in Relation to Growth and Treatment of Cancer. Clarendon Press; Oxford: 1977. [Google Scholar]
- 9.Mendelsohn ML. Autoradiographic analysis of cell proliferation in spontaneous breast cancer of C3H mouse. The growth fraction. J Natl Cancer Inst. 1962;28:1015–1029. [PubMed] [Google Scholar]
- 10.Laitha LG. Bone marrow stem cells kinetics. Semin Hematol. 1967;4:293–303. [PubMed] [Google Scholar]
- 11.Darzynkiewicz Z, Krassowski T, Skopinska E. Effect of phytohaemagglutinin on synthesis of “rapidly labeled” ribonucleic acid in human lymphocytes. Nature. 1965;207:1402–1403. doi: 10.1038/2071402a0. [DOI] [PubMed] [Google Scholar]
- 12.Darzynkiewicz Z, Traganos F, Sharpless T, Melamed MR. Lymphocyte stimulation: A rapid multiparameter analysis. Proc Natl Acad Sci USA. 1976;73:2881–2884. doi: 10.1073/pnas.73.8.2881. [DOI] [PMC free article] [PubMed] [Google Scholar]
- 13.Latt SA. Detection of DNA synthesis in interphase nuclei by fluorescence microscopy. J Cell Biol. 1974;62:546–550. doi: 10.1083/jcb.62.2.546. [DOI] [PMC free article] [PubMed] [Google Scholar]
- 14.Böhmer RM, Ellwart J. Cell cycle analysis by combining 5-bromodeoxyuridine/33258 Hoechst technique with DNA-specific ethidium bromide staining. Cytometry. 1981;2:31–34. doi: 10.1002/cyto.990020107. [DOI] [PubMed] [Google Scholar]
- 15.Kubbies M, Schindler D, Hoehn H, Rabinovitch PS. Cell cycle kinetics by BrdUHoechst flow cytometry: An alternative to the differential metaphase labeling technique. Cell Tissue Kinet. 1985;18:551–562. doi: 10.1111/j.1365-2184.1985.tb00696.x. [DOI] [PubMed] [Google Scholar]
- 16.Poot M, Hoehn H, Kubbies M, Grossman A, Chen Y, Rabinovitch PS. Cell-cycle analysis using continuous bromodeoxyuridine labeling and Hoechst 33358-ethidium bromide bivariate flow cytometry. Methods Cell Biol. 1994;41:327–338. doi: 10.1016/s0091-679x(08)61726-4. [DOI] [PubMed] [Google Scholar]
- 17.Crissman HA, Steinkamp JA. A new method for rapid and sensitive detection of bromodeoxyuridine in DNA replicating cells. Exp Cell Res. 1987;173:256–261. doi: 10.1016/0014-4827(87)90350-8. [DOI] [PubMed] [Google Scholar]
- 18.Darzynkiewicz Z, Traganos F, Melamed MR. Distinction between 5-bromodeoxyuridine labeled and unlabeled mitotic cells by flow cytometry. Cytometry. 1983;3:345–348. doi: 10.1002/cyto.990030507. [DOI] [PubMed] [Google Scholar]
- 19.Gorczyca W, Melamed MR, Darzynkiewicz Z. Laser scanning cytometer analysis of fraction of labeled mitoses. Cell Prolif. 1996;29:539–548. doi: 10.1111/j.1365-2184.1996.tb00969.x. [DOI] [PubMed] [Google Scholar]
- 20.Gratzner HG. Monoclonal antibody to 5-bromo- and 5-iododeoxyuridine: A new reagent for detection of DNA replication. Science. 1982;218:474–475. doi: 10.1126/science.7123245. [DOI] [PubMed] [Google Scholar]
- 21.Leif RC, Stein JH, Zucker RM. A short history of the initial application of anti-BrdU to the detection and measurement of S phase. Cytometry A. 2004;58A:45–52. doi: 10.1002/cyto.a.20012. [DOI] [PubMed] [Google Scholar]
- 22.Dolbeare F, Gratzner H, Pallavicini MG, Gray JW. Flow cytometric measurement of total DNA content and incorporated bromodeoxyuridine. Proc Natl Acad Sci USA. 1983;80:5573–5577. doi: 10.1073/pnas.80.18.5573. [DOI] [PMC free article] [PubMed] [Google Scholar]
- 23.Dolbeare F, Selden JR. Immunochemical quantitation of bromodeoxyuridine: Application to cell cycle analysis. Methods Cell Biol. 1994;41:297–316. [PubMed] [Google Scholar]
- 24.Begg AC, McNally NJ, Shrieve DC, Karcher HA. method to measure duration of DNA synthesis and the potential doubling time from a single sample. Cytometry. 1985;6:620–626. doi: 10.1002/cyto.990060618. [DOI] [PubMed] [Google Scholar]
- 25.Terry NHA, White RA. Cell cycle kinetics estimated by analysis of bromodeoxyuridine incorporation. Methods Cell Biol. 2001;63:355–374. doi: 10.1016/s0091-679x(01)63020-6. [DOI] [PubMed] [Google Scholar]
- 26.Aten JA, Bakker PJM, Stap J, Boschman GA, Veenhof CHN. DNA double labeling with IdUrd and CldUrd for spatial and temporal analysis of cell proliferation and DNA replication. Histochem J. 1992;24:251–259. doi: 10.1007/BF01046839. [DOI] [PubMed] [Google Scholar]
- 27.Aten JA, Stap J, Hoebe R, Bakker PJM. Application and detection of IdUrd and CldUrd as two independent cell-cycle markers. Methods Cell Biol. 1994;41:317–326. [PubMed] [Google Scholar]
- 28.Pollack A, Terry HA, Van NT, Meistrich ML. Flow cytometric analysis of two incorporated halogenated thymidine analogues and DNA in a mouse mammary tumor grown in vivo. Cytometry. 1993;14:168–172. doi: 10.1002/cyto.990140208. [DOI] [PubMed] [Google Scholar]
- 29.Braunschweiger PG, Schiffer LM. Effect of adriamycin on the cell kinetics of 13762 rat mammary tumors and implications for therapy. Cancer Treat Rep. 1980;64:293–300. [PubMed] [Google Scholar]
- 30.Schiffer LM, Braunschweiger PG, Stragand JJ, Poulakos L. The cell kinetics of human mammary cancers. Cancer. 1979;43:1707–1719. doi: 10.1002/1097-0142(197905)43:5<1707::aid-cncr2820430522>3.0.co;2-a. [DOI] [PubMed] [Google Scholar]
- 31.Holm M, Thomsen M, Hoyer M, Hokland P. Optimization of a flow cytometric method for the simultaneous measurement of cell surface antigen, DNA content and in vivo BrdUrd incorporation into normal and malignant hematopoietic cells. Cytometry. 1998;32:28–36. doi: 10.1002/(sici)1097-0320(19980501)32:1<28::aid-cyto4>3.0.co;2-b. [DOI] [PubMed] [Google Scholar]
- 32.Li X, Traganos F, Melamed MR, Darzynkiewicz Z. Detection of 5-bromo-2-deoxyuridine incorporated into DNA by labeling strand breaks induced by photolysis (SBIP) Int J Oncol. 1994;4:1157–1161. doi: 10.3892/ijo.4.6.1157. [DOI] [PubMed] [Google Scholar]
- 33.Li X, Melamed MR, Darzynkiewicz Z. Detection of apoptosis and DNA replication by differential labeling of DNA strand breaks with fluorochromes of different color. Exp Cell Res. 1996;222:28–37. doi: 10.1006/excr.1996.0004. [DOI] [PubMed] [Google Scholar]
- 34.Juan G, Li X, Darzynkiewicz Z. Correlation between DNA replication and expression of cyclins A and B1 in individual MOLT-4 cells. Cancer Res. 1997;57:803–807. [PubMed] [Google Scholar]
- 35.Gorczyca W, Bruno S, Darzynkiewicz RJ, Gong J, Darzynkiewicz Z. DNA strand breaks occurring during apoptosis: Their early in situ detection by the terminal deoxynucleotidyl transferase and nick translation assays and prevention by serine protease inhibitors. Int J Onc. 1992;1:639–648. doi: 10.3892/ijo.1.6.639. [DOI] [PubMed] [Google Scholar]
- 36.Gorczyca W, Gong JP, Darzynkiewicz Z. Detection of DNA strand breaks in individual apoptotic cells by the in situ terminal deoxynucleotidyl transferase and nick translation assays. Cancer Res. 1993;53:1945–1951. [PubMed] [Google Scholar]
- 37.Cseresnyes Z, Schwartz U, Green CM. Analysis of replication factories in human cells by super-resolution light microscopy. BMC Cell Biol. 2009;10:88. doi: 10.1186/1471-2121-10-88. [DOI] [PMC free article] [PubMed] [Google Scholar]
- 38.Jensen PÄ, Larsen J, Christiansen J, Larsen JK. Flow cytometric measurement of RNA synthesis using bromouridine labeling and bromodeoxyuridine antibodies. Cytometry. 1993;14:455–458. doi: 10.1002/cyto.990140416. [DOI] [PubMed] [Google Scholar]
- 39.Jensen PÄ, Larsen J, Larsen JK. Flow cytometric measurement of RNA synthesis based on bromouridine labeling and combined with measurement of DNA content or cell surface antigen. Acta Oncol. 1993;32:521–524. doi: 10.3109/02841869309096111. [DOI] [PubMed] [Google Scholar]
- 40.Jensen PÄ, Larsen J, Larsen JK. Analysis of RNA synthesis by cytometry. Methods Cell Biol. 2001;64:129–138. doi: 10.1016/s0091-679x(01)64010-x. [DOI] [PubMed] [Google Scholar]
- 41.Halicka HD, Bedner E, Darzynkiewicz Z. Segregation of RNA and separate packaging of DNA and RNA in apoptotic bodies during apoptosis. Exp Cell Res. 2000;260:248–255. doi: 10.1006/excr.2000.5027. [DOI] [PubMed] [Google Scholar]
- 42.Haider SR, Juan G, Traganos F, Darzynkiewicz Z. Immuno-separation and immuno-detection of nucleic acids with halogenated nucleotides. Exp Cell Res. 1997;234:498–506. doi: 10.1006/excr.1997.3644. [DOI] [PubMed] [Google Scholar]
- 43.Moran R, Darzynkiewicz Z, Staiano-Coico L, Melamed MR. Detection of BrdUrd incorporation by monoclonal antibodies: Role of the DNA denaturation step. J Histochem Cytochem. 1985;33:821–827. doi: 10.1177/33.8.3860561. [DOI] [PubMed] [Google Scholar]
- 44.Salic A, Mitchison TJ. A chemical method for fast and sensitive detection of DNA synthesis in vivo. Proc Natl Acad Sci USA. 2008;105:2415–2420. doi: 10.1073/pnas.0712168105. [DOI] [PMC free article] [PubMed] [Google Scholar]
- 45.Jao CY, Salic A. Exploring RNA transcription and turnover in vivo by using click chemistry. Proc Natl Acad Sci USA. 2008;105:15779–15784. doi: 10.1073/pnas.0808480105. [DOI] [PMC free article] [PubMed] [Google Scholar]
- 46.Tornøe CW, Christensen C, Meldal M. Peptidotriazoles on solid phase: [1,2,3]-Triazoles by regiospecific copper(I)-catalyzed 1,3-dipolar cycloadditions of terminal alkynes to azides. J Org Chem. 2002;67:3057–3064. doi: 10.1021/jo011148j. [DOI] [PubMed] [Google Scholar]
- 47.Meldal M, Tornøe CW. Cu-catalyzed azide-alkyne cycloaddition. Chem Rev. 2008;108:2952–3015. doi: 10.1021/cr0783479. [DOI] [PubMed] [Google Scholar]
- 48.Rostovtsev VV, Green LG, Fokin VV, Sharpless KB. A stepwise huisgen cycloaddition process: Copper(I)-catalyzed regioselective “ligation” of azides and terminal alkynes. Angew Chem Int Ed Engl. 2002;41:2596–2599. doi: 10.1002/1521-3773(20020715)41:14<2596::AID-ANIE2596>3.0.CO;2-4. [DOI] [PubMed] [Google Scholar]
- 49.Buck SZ, Bradford J, Gee KR, Agnew BJ, Clarke ST, Salic A. Detection of S-phase cell cycle progression using 5-ethynyl-2′-deoxyuridine incorporation with click chemistry, an alternative to using 5-bromo-2′-deoxyuridine antibodies. Biotechniques. 2008;44:927–929. doi: 10.2144/000112812. [DOI] [PubMed] [Google Scholar]
- 50.Cappella P, Gaspari F, Pulici M, Moll J. A novel method based on click chemistry, which overcomes limitations of cell cycle analysis by classical determination of BrdU incorporation, allowing multiplex antibody staining. Cytometry A. 2008;74A:626–636. doi: 10.1002/cyto.a.20582. [DOI] [PubMed] [Google Scholar]
- 51.Yu Y, Arora A, Min W, Roifman CM, Grunebaum E. EdU uptake is an alternative non-radioactive assay to 3H thymidine uptake for in vivo measurement of mice T-cell proliferations. J Immunol Methods. 2009;350:29–35. doi: 10.1016/j.jim.2009.07.008. [DOI] [PubMed] [Google Scholar]
- 52.Hamelik RM, Krishan A. Click-IT assay with improved DNA distribution histograms. Cytometry A. 2009;75A:862–865. doi: 10.1002/cyto.a.20780. [DOI] [PubMed] [Google Scholar]
- 53.Jensen UB, Owens DM, Pedersen S, Christensen R. Zinc fixation preserves flow cytometry scatter and fluorescence parameters and allows simultaneous analysis of DNA content and synthesis, and intracellular and surface epitopes. Cytometry A. 2010;77A:798–804. doi: 10.1002/cyto.a.20914. [DOI] [PubMed] [Google Scholar]
- 54.Diermeier-Daucher S, Clarke ST, Hill D, Vollmann-Zwerenz A, Bradford JA, Brockhoff G. Cell type specific applicability of 5-ethynyl-2′-deoxyuridine (EdU) for dynamic proliferation assessment in flow cytometry. Cytometry A. 2009;75A:535–546. doi: 10.1002/cyto.a.20712. [DOI] [PubMed] [Google Scholar]
- 55.Diermeier-Daucher S, Brockhoff G. Dynamic proliferation assessment in flow cytometry. Curr Prot Cell Biol. 2010;chapter 8(Unit 8.6):1–23. doi: 10.1002/0471143030.cb0806s48. [DOI] [PubMed] [Google Scholar]
- 56.Ferullo DJ, Cooper DL, Moore HR, Lovett S. Cell cycle synchronization of E. coli using the stringent response, with fluorescence labeling assays for DNA content and replication. Methods. 2010;48:8–13. doi: 10.1016/j.ymeth.2009.02.010. [DOI] [PMC free article] [PubMed] [Google Scholar]
- 57.Del Bino G, Bruno S, Yi PN, Darzynkiewicz Z. Apoptotic cell death triggered by camptothecin or teniposide: The cell cycle specificity and effects of ionizing radiation. Cell Prolif. 1992;25:537–548. doi: 10.1111/j.1365-2184.1992.tb01458.x. [DOI] [PubMed] [Google Scholar]
- 58.Rogakou EP, Pilch DR, Orr AH, Ivanova VS, Bonner WM. DNA double-stranded breaks induce histone H2AX phosphorylation on serine 139. J Biol Chem. 1998;273:5858–5868. doi: 10.1074/jbc.273.10.5858. [DOI] [PubMed] [Google Scholar]
- 59.Huang X, Okafuji M, Traganos F, Luther E, Holden E, Darzynkiewicz Z. Assessment of histone H2AX phosphorylation induced by DNA topoisomerase I and II inhibitors topotecan and mitoxantrone and by DNA crosslinking agent cisplatin. Cytometry A. 2004;58A:99–110. doi: 10.1002/cyto.a.20018. [DOI] [PubMed] [Google Scholar]
- 60.Tanaka T, Huang X, Halicka HD, Zhao H, Traganos F, Albino AP, Dai W, Darzynkiewicz Z. Cytometry of ATM activation and histone H2AX phosphorylation to estimate extent of DNA damage induced by exogenous agents. Cytometry A. 2007;71A:648–661. doi: 10.1002/cyto.a.20426. [DOI] [PMC free article] [PubMed] [Google Scholar]
- 61.Zhao H, Traganos F, Darzynkiewicz Z. Kinetics of the UV-induced DNA damage response in relation to cell cycle phase. Correlation with DNA replication. Cytometry A. 2010;77A:285–293. doi: 10.1002/cyto.a.20839. [DOI] [PMC free article] [PubMed] [Google Scholar]
- 62.Kaiser CL, Kamien AJ, Shah PA, Chapman BJ, Cotanche DA. 5-ethynyl-2′deoxyuridine labeling detects proliferating cells in the regenerating avian cochlea. Laryngoscope. 2009;119:1770–1775. doi: 10.1002/lary.20557. [DOI] [PMC free article] [PubMed] [Google Scholar]
- 63.Kamentsky LA. Laser scanning cytometry. Methods Cell Biol. 2001;63:51–87. doi: 10.1016/s0091-679x(01)63007-3. [DOI] [PubMed] [Google Scholar]
- 64.Pozarowski P, Holden E, Darzynkiewicz Z. Laser scanning cytometry: Principles and applications. Methods Mol Biol. 2006;319:65–192. doi: 10.1007/978-1-59259-993-6_8. [DOI] [PMC free article] [PubMed] [Google Scholar]
- 65.Darzynkiewicz Z, Smolewski P, Holden E, Luther E, Henriksen M, François M, Leifert W, Fenech M. Laser scanning cytometry for automation of the micronucleus assay. Mutagenesis. 2011;26:151–161. doi: 10.1093/mutage/geq069. [DOI] [PMC free article] [PubMed] [Google Scholar]
- 66.Zhao H, Halicka HD, Jorgensen E, Traganos F, Darzynkiewicz Z. New biomarkers probing the depth of cell senescence assessed by laser scanning cytometry. Cytometry A. 2010;77A:999–1007. doi: 10.1002/cyto.a.20983. [DOI] [PMC free article] [PubMed] [Google Scholar]
- 67.Zhao H, Oczos J, Janowski P, Trembecka D, Dobrucki J, Darzynkiewicz Z, Wlodkowic D. Rationale for the real-time and dynamic cell death assays using propidum iodide. Cytometry A. 2010;77A:399–405. doi: 10.1002/cyto.a.20867. [DOI] [PMC free article] [PubMed] [Google Scholar]
- 68.Darzynkiewicz Z. Mammalian cell-cycle analysis. In: Fantes P, Brooks R, editors. The Cell Cycle. A Practical Approach. Oxford University Press; Oxford: 1993. pp. 45–68. [Google Scholar]
- 69.Halicka HD, Huang X, Traganos F, King MA, Dai W, Darzynkiewicz Z. Histone H2AX phosphorylation after cell irradiation with UV-B: Relationship to cell cycle phase and induction of apoptosis. Cell Cycle. 2005;4:339–345. [PubMed] [Google Scholar]
- 70.Tanaka T, Halicka HD, Huang X, Traganos F, Darzynkiewicz Z. Constitutive histone H2AX phosphorylation and ATM activation, the reporters of DNA damage by endogenous oxidants. Cell Cycle. 2006;5:1940–1945. doi: 10.4161/cc.5.17.3191. [DOI] [PMC free article] [PubMed] [Google Scholar]
- 71.Zhao H, Tanaka T, Halicka HD, Traganos F, Zarebski M, Dobrucki J, Darzynkiewicz Z. Cytometric assessment of DNA damage by exogenous and endogenous oxidants reports the aging-related processes. Cytometry A. 2007;71A:905–914. doi: 10.1002/cyto.a.20469. [DOI] [PMC free article] [PubMed] [Google Scholar]
- 72.Demidenko ZN, Blagosklonny MV. Growth stimulation leads to cellular senescence when the cell cycle is blocked. Cell Cycle. 2008;7:3355–3361. doi: 10.4161/cc.7.21.6919. [DOI] [PubMed] [Google Scholar]