Abstract
The complex of the HIV TAR RNA with the viral regulatory protein Tat is of considerable interest, but the plasticity of this interaction has made it impossible so far to establish the structure of that complex. In order to explore a new approach to obtain structural information on protein-RNA complexes, we performed 13C/15N-19F REDOR NMR experiments in the solid state on TAR bound to a peptide comprising the RNA-binding section of Tat. A critical arginine in the peptide was uniformly 13C and 15N labeled and 5-fluorouridine was incorporated at the U23 position of TAR. REDOR irradiation resulted in dephasing of the 13C and 15N resonances, indicating proximity of the U23(5F)-C and U23(5F)-N spin pairs. Best fits to the REDOR data shows the U23(5F)-C distances and the U23(5F)-N distances are in good agreement with the distances obtained from solution NMR structures of partial complexes of Tat with TAR. These results demonstrate that it is possible to study protein-RNA complexes using solid-state REDOR NMR measurements, adding to a growing list of solid state techniques for studying protein-nucleic acid complexes.
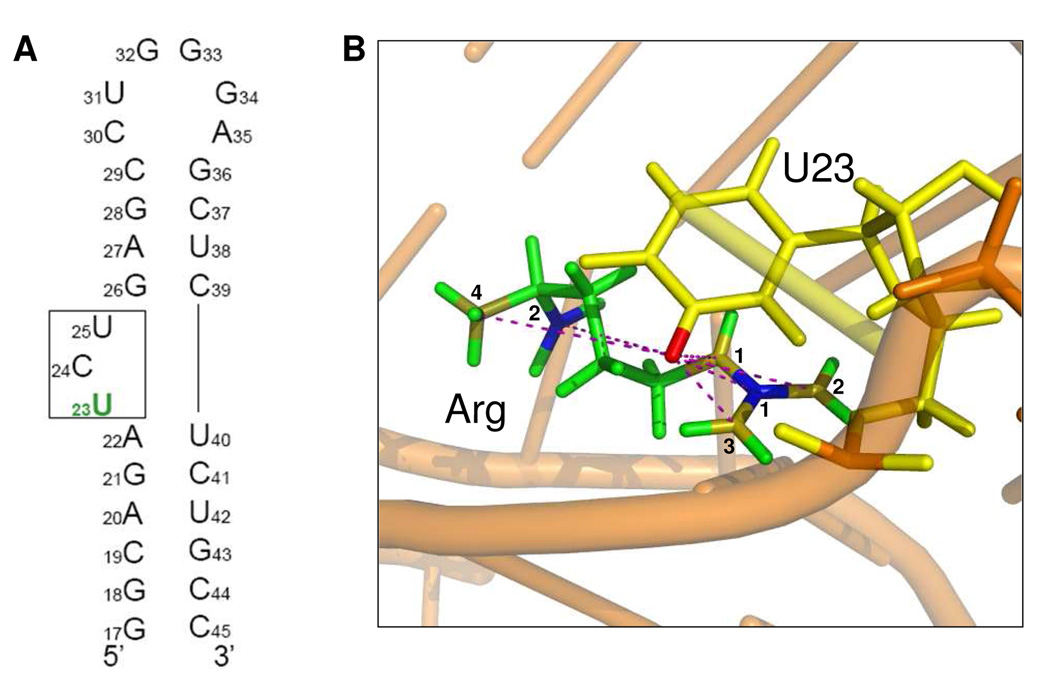
The interaction between the HIV-1 transactivation response element (TAR) RNA and Tat protein is essential for viral replication1–4 and is a paradigm for a class of protein-RNA complexes. However, a structure of this classic complex remains to be determined, in part because of conformational dynamics in the complex. Although various models and structures of TAR in the presence and absence of Tat-derived peptides and argininamide have been reported,7–11 it has not been possible to directly observe the interaction between TAR and Tat using NMR or X-ray crystallography. The region of TAR comprising the UCU bulge and neighboring base pairs is essential for the specific binding of Tat (Figure 1A) and undergoes a substantial conformational change upon binding of Tat and even of a single argininamide molecule.1,5,6 In this work, we use solid-state Rotational Echo Double Resonance (REDOR) NMR12 to observe intermolecular interactions between TAR and a peptide mimic of the arginine-rich RNA-binding domain of Tat. The REDOR technique detects heteronuclear dipolar coupling and therefore the distance between two heteronuclei. In our set-up, 13C or 15N is the observed nucleus, while 19F is the dephasing nucleus (Figure S1).
Figure 1.
a) Secondary structure of TAR RNA, indicating the position of the 5-19F base-labeled U23 nucleotide. b) Structure of the complex between TAR and a Tat-derived 37-mer peptide9. The phosphate backbone is represented by an orange ribbon and distances between TAR RNA and arginine are indicated by dash lines. Single argininamide is indicated in green with Cζ shown in blue 1, CO in blue 2, Nε in gold 1, Nη1, η2 in gold 2, 3, and NH in gold 4. U23 is indicated in yellow with the labeled 19F shown in red.
We previously showed that with 31P-19F REDOR it is possible to measure the distance between nucleotides within TAR that are remote in the absence of Tat peptide, but move into closer proximity upon binding to Tat peptides.13 Upon peptide binding, the separation between phosphorothioate and the 2’-F label incorporated at A27 in the upper helix and U23 in the bulged loop, respectively, decreases from 10.3 Å in the unbound RNA to 6.6 Å. This change was consistent with distances observed in solution NMR studies showing significant rearrangement in the position of bulge residue U23 in the bound RNA.9 However, it did not demonstrate in a direct way that side chains of basic amino acids in Tat were positioned in proximity to the bulged loop of TAR. Solid state TEDOR NMR experiments were used recently to measure intermolecular distances between 15N and 31P in another protein-RNA complex14. While this approach measures distances between the RNA backbone and the protein backbone, our approach here measures intermolecular distances between RNA bases and both the side chain and backbone in a protein.
An 11-mer peptide 47YGRKKKRRQRRR57 representing the arginine rich domain of Tat was used to form the complex with TAR (29 nucleotides, Figure 1A). Previous work has shown that this region of Tat provides direct contacts with the TAR bulge region and that the conformational change induced in TAR is very similar to that of full Tat protein.1–3,5,6,15–24 Uniformly 13C and 15N labeled FMOC-Arg(Pbf)-OH was incorporated into the peptide at the position equivalent to Arg52 using solid phase peptide synthesis. In the structure of TAR bound to arginine and to peptides derived from Tat, U23 repositions itself in close proximity to G26 and to the A27-U38 base pair in the major groove.8,9,23,25–27 Thus, to demonstrate the feasibility of our new method, we prepared a 19F U23 residue labeled at the 5 position in order to measure the distance between U23 (5F) and the labeled arginine using 13C/15N-19F REDOR. U42 (5F) was also labeled in the sample for another purpose, but it is too distant from both U23 (5F) and arginine to cause measureable dipolar dephasing, so it has no effects on the current REDOR experiments.
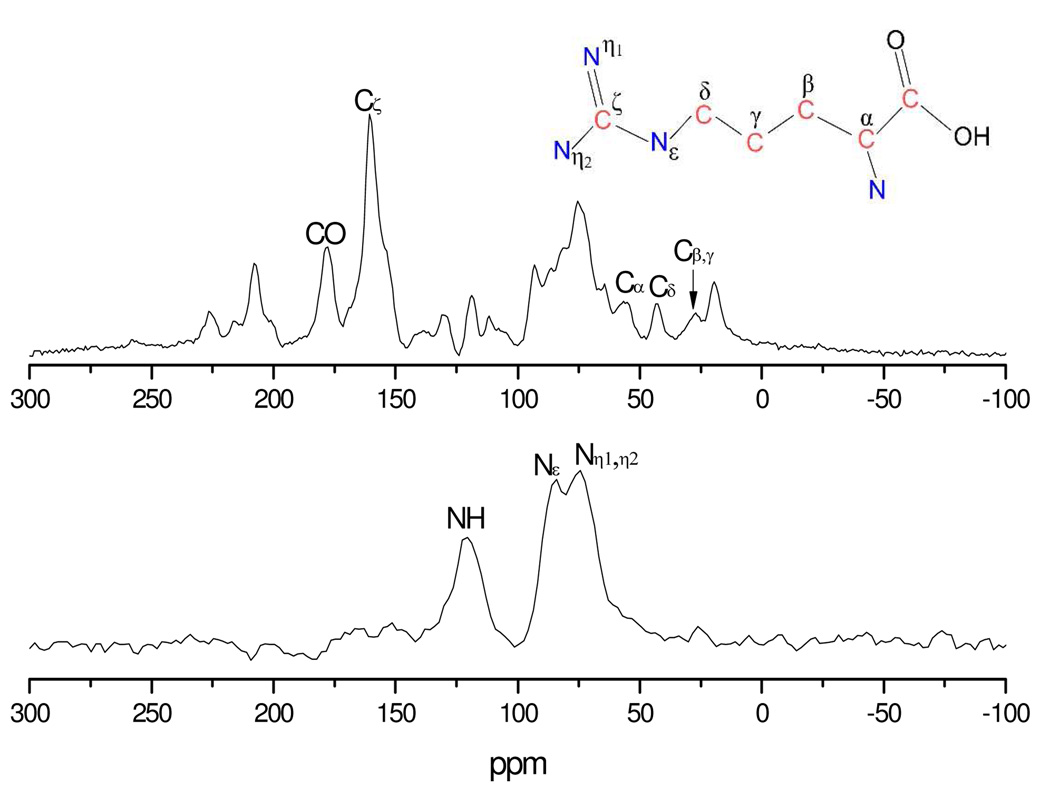
Figure 2 shows the 13C and 15N magic angle spinning reference (S0) spectra of the bound 11-mer peptide-TAR complex corresponding to the initial REDOR S/S0 point; all S and S0 spectra are shown in Figure S2 and Figure S3. The labeled 13C resonances in arginine are well resolved, with only the β and γ carbons overlapped; the other resonances visible in the spectrum arise from the RNA backbone and other amino acids in the peptide at natural abundance. The carbon and nitrogen resonances in the complex are not shifted relative to free arginine, within the experimental linewidth. This conclusion is supported by the analysis of BioMagResBank28 which shows a Cζ chemical shift distribution of only 0.5 ppm (FWHM), and a Nε chemical shift distribution of 1 ppm (FWHM). The Cζ and CO peaks are resolved enough to obtain REDOR dephasing curves. However, they could be overlapped with some natural abundance 13C signals. Those signals are small compared with labeled carbon, but they may generate unpredictable decays. Labeled 15N resonances, indicated in lower panel of Figure 2, are also well resolved except the η1 and η2 nitrogens. Although parts of Nε and Nη1,η2 signals are also overlapped, they can be separated into two Gaussian-shaped peaks. Thus, distances from the 19F spin in the base of U23 in TAR RNA to Cζ, CO, NH, Nε, and Nη1, Nη2 in Arg52 are observable.
Figure 2.
Reference REDOR MAS spectrum (S0) recorded at the initial dephasing time point along with spectral assignments. 13C observed spectra were obtained with 20,000 scans under a spinning speed of 6,000 Hz, while 15N observed spectra were obtained with 22,000 scans under a spinning speed of 8,000 Hz. The inset shows the position of each carbon and nitrogen in the arginine amino acid
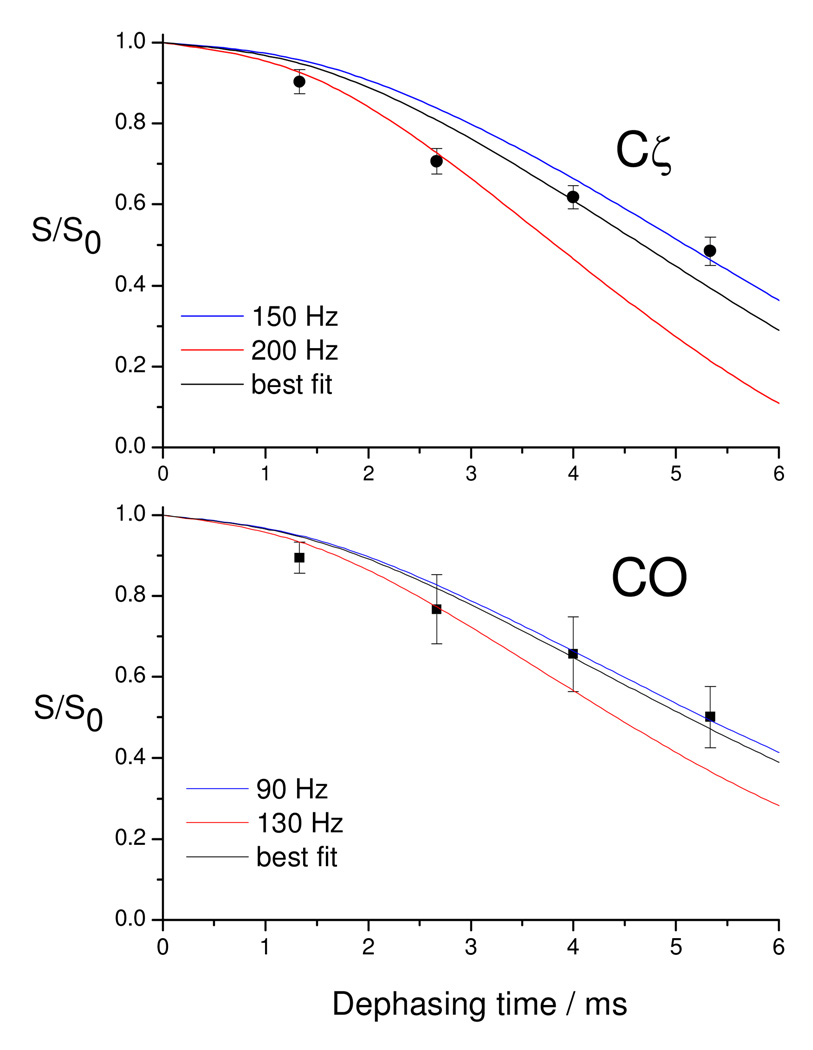
Distances from the Arg52 Cζ and CO to U23 (5F) were measured using 13C-19F REDOR as shown in Figure 3. A χ2 analysis (Figure S4) of the fits using SIMPSON29 to the REDOR data shows the U23(5F)-Cζ distance to be 5.6 ± 0.1 Å and the U23(5F)-CO distance to be 6.6 ± 0.4 Å (Figure 1B). In this analysis, homonuclear 13C-13C couplings were only considered for CO with the closest carbon; all others 13C-13C couplings were ignored because they are distant enough to have no effect on the simulation.
Figure 3.
13C-19F REDOR dephasing curves for the complex of TAR with an 11-mer Tat-derived peptide, reported with simulations of the internuclear distances performed with SIMPSON. The upper panel reports the decay of Cζ in the labeled arginine, while the lower panel monitors the CO.
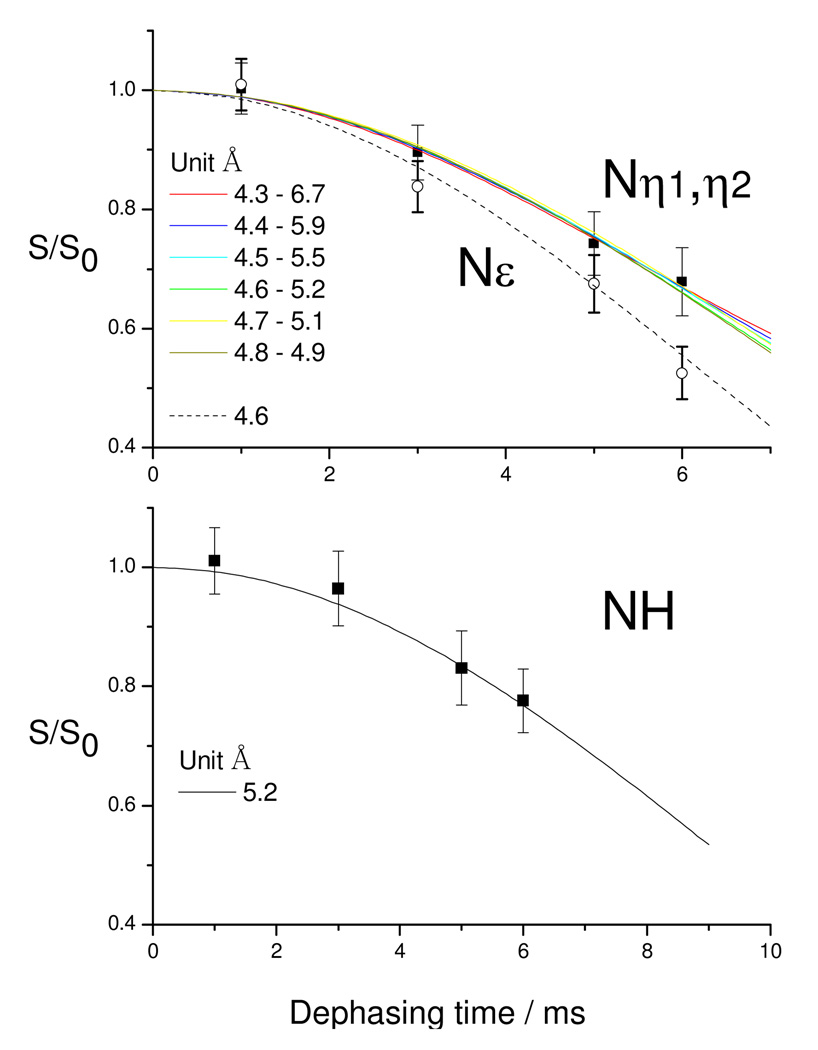
The 15N-19F REDOR dephasing curves are shown in Figure 4. Since the 15Nη1 and 15Nη2 are not resolved, only one dephasing curve is obtained for those two 15N spins. This results in multiple solutions for the Nη1 and Nη2 distances in the simulations. Slower decay is observed for the NH of Arg52 in the main chain of the Tat peptide, confirming that the guanidinium group has closer contacts with the bulge region. In the simulation, homonuclear 15N-15N couplings are only considered within the guanidinium group, and are assumed to be 111 Hz (2.23 Å). Best fits to the 15N-19F REDOR data show the U23(5F) - NH distance to be 5.2 ± 0.2 Å, and U23(5F) - Nε distance to be 4.6 ± 0.1 Å. Multiple solutions exist for the U23(5F) - Nη1 and U23(5F) - Nη2 distances. The best fits using SIMPSON are (4.3 Å, 6.7 Å), (4.4 Å, 5.9 Å), (4.5 Å, 5.5 Å), (4.6 Å, 5.2 Å), (4.7 Å, 5.1 Å) and (4.8 Å, 4.9 Å), as indicated in the upper panel of Figure 4. The above distances agree with the conclusions derived from the 13C- 19F measurements.
Figure 4.
15N-19F REDOR dephasing curves for the complex of TAR with an 11-mer Tat-derived peptide, reported with simulations of the internuclear distances performed with SIMPSON. The upper panel reports the decay of Nε and Nη1, Nη2 in the labeled arginine, while the lower panel monitors the NH.
The results provide direct evidence for a close interaction between Arg52 and U23.7–9,12,15,23 They are also quantitatively in agreement with models based on solution NMR data9 that unfortunately did not contain sufficient information in the form of intermolecular NOEs to generate an unambiguous structure for the entire peptide; only the position of a single arginine could be defined. In the reported 20 models (PDB ARJ), the average interlabel U23(5F)-Cζ distance was 4.2 Å, ranging between 3.1 Å and 5.9 Å. The average inter-label U23(5F)-CO distance was 6.6 Å, ranging between 5.1 Å and 8.5 Å. These results are consistent with the distances obtained from REDOR and presented here.
The solid-state REDOR technique used in this work offers a direct method to measure intermolecular protein-RNA distances when intermolecular distance constraints cannot be obtained using solution NMR. We report distances which are consistent with solution state structures even if the solid state sample conditions correspond to an amorphous powder. Other peptide-RNA constrains will be measured in the future to obtain more detailed structural information and reconstruct the conformation of this paradigmatic complex. The application of multiple solid state NMR methods provide a suit of highly complementary experiments to measure intermolecular distance constraints in protein-RNA complexes which are not tractable using solution NMR or crystallography.
Supplementary Material
Acknowledgment
The authors wish to thank Dr. Dirk Stueber for preparing the labeled tat peptide and TAR constructs. This research was supported by NSF MCB 0642253.
Footnotes
Supporting Information Available: Sample preparation, NMR experiments, data processing and complete ref 28. This material is available free of charge via the internet at http://pubs.acs.org.
References
- 1.Dingwall C, Ernberg I, Gait MJ, Green SM, Heaphy S, Karn J, Lowe AD, Singh M, Skinner MA. EMBO J. 1990;9:4145–4153. doi: 10.1002/j.1460-2075.1990.tb07637.x. [DOI] [PMC free article] [PubMed] [Google Scholar]
- 2.Calnan BJ, Biancalana S, Hudson D, Frankel AD. Genes Dev. 1991;5:201–210. doi: 10.1101/gad.5.2.201. [DOI] [PubMed] [Google Scholar]
- 3.Roy S, Delling U, Chen CH, Rosen CA, Sonenberg N. Genes Dev. 1990;4:1365–1373. doi: 10.1101/gad.4.8.1365. [DOI] [PubMed] [Google Scholar]
- 4.Muesing MA, Smith DH, Capon DJ. Cell. 1987;48:691–701. doi: 10.1016/0092-8674(87)90247-9. [DOI] [PubMed] [Google Scholar]
- 5.Weeks KM, Ampe C, Schultz SC, Steitz TA, Crothers DM. Science. 1990;249:1281–1285. doi: 10.1126/science.2205002. [DOI] [PubMed] [Google Scholar]
- 6.Cordingley MG, LaFemina RL, Callahan PL, Condra JH, Sardana VV, Graham DJ, Nguyen TM, LeGrow K, Gotlib L, Schlabach AJ, Colonno RJ. Proc. Natl Acad. Sci. USA. 1990;87:8985–8989. doi: 10.1073/pnas.87.22.8985. [DOI] [PMC free article] [PubMed] [Google Scholar]
- 7.Calnan BJ, Tidor B, Biancalana S, Hudson D, Frankel AD. Science. 1991;252:1167–1171. doi: 10.1126/science.252.5009.1167. [DOI] [PubMed] [Google Scholar]
- 8.Puglisi JD, Tan R, Calnan BJ, Frankel AD, Williamson JR. Science. 1992;257:76–80. doi: 10.1126/science.1621097. [DOI] [PubMed] [Google Scholar]
- 9.Aboul-Ela F, Karn J, Varani G. J. Mol. Biol. 1995;253:313–332. doi: 10.1006/jmbi.1995.0555. [DOI] [PubMed] [Google Scholar]
- 10.Aboul-ela F, Karn J, Varani G. Nucleic Acids Res. 1996;24:3974–3981. doi: 10.1093/nar/24.20.3974. [DOI] [PMC free article] [PubMed] [Google Scholar]
- 11.Davidson A, Leeper TC, Athanassiou Z, Patora-Komisarska K, Karn J, Robinson JA, Varani G. Proc. Natl Acad. Sci. USA. 2009;106:11931–11936. doi: 10.1073/pnas.0900629106. [DOI] [PMC free article] [PubMed] [Google Scholar]
- 12.Gullion T, Schaefer J. J. Magn. Reson. 1989;81:196–200. [Google Scholar]
- 13.Olsen GL, Edwards TE, Deka P, Varani G, Sigurdsson ST, Drobny GP. Nucleic Acids Res. 2005;33:3447–3454. doi: 10.1093/nar/gki626. [DOI] [PMC free article] [PubMed] [Google Scholar]
- 14.Jehle S, Falb M, Kirkpatrick JP, Oschkinat H, van Rossum BJ, Althoff G, Carlomagno T. J. Am. Chem. Soc. 2010;132:3842–3846. doi: 10.1021/ja909723f. [DOI] [PubMed] [Google Scholar]
- 15.Davis B, Afshar M, Varani G, Murchie AI, Karn J, Lentzen G, Drysdale M, Bower J, Potter AJ, Starkey ID, Swarbrick T, Aboul-ela F. J. Mol. Biol. 2004;336:343–356. doi: 10.1016/j.jmb.2003.12.046. [DOI] [PubMed] [Google Scholar]
- 16.Weeks KM, Crothers DM. Cell. 1991;66:577–588. doi: 10.1016/0092-8674(81)90020-9. [DOI] [PubMed] [Google Scholar]
- 17.Dingwall C, Ernberg I, Gait MJ, Green SM, Heaphy S, Karn J, Lowe AD, Singh M, Skinner MA, Valerio R. Proc. Natl Acad. Sci. USA. 1989;86:6925–6929. doi: 10.1073/pnas.86.18.6925. [DOI] [PMC free article] [PubMed] [Google Scholar]
- 18.Roy S, Parkin NT, Rosen C, Itovitch J, Sonenberg N. J. Virol. 1990;64:1402–1406. doi: 10.1128/jvi.64.3.1402-1406.1990. [DOI] [PMC free article] [PubMed] [Google Scholar]
- 19.Sumner-Smith M, Roy S, Barnett R, Reid LS, Kuperman R, Delling U, Sonenberg N. J. Virol. 1991;65:5196–5202. doi: 10.1128/jvi.65.10.5196-5202.1991. [DOI] [PMC free article] [PubMed] [Google Scholar]
- 20.Tao J, Frankel AD. Proc. Natl Acad. Sci. USA. 1992;89:2723–2726. doi: 10.1073/pnas.89.7.2723. [DOI] [PMC free article] [PubMed] [Google Scholar]
- 21.Loret EP, Georgel P, Johnson WC, Ho PS. Proc. Natl Acad. Sci. USA. 1992;89:9734–9738. doi: 10.1073/pnas.89.20.9734. [DOI] [PMC free article] [PubMed] [Google Scholar]
- 22.Weeks KM, Crothers DM. Biochemistry. 1992;31:10281–10287. doi: 10.1021/bi00157a015. [DOI] [PubMed] [Google Scholar]
- 23.Churcher MJ, Lamont C, Hamy F, Dingwall C, Green SM, Lowe AD, Butler JG, Gait MJ, Karn J. J. Mol. Biol. 1993;230:90–110. doi: 10.1006/jmbi.1993.1128. [DOI] [PubMed] [Google Scholar]
- 24.Puglisi JD, Chen L, Frankel AD, Williamson JR. Proc. Natl Acad. Sci. USA. 1993;90:3680–3684. doi: 10.1073/pnas.90.8.3680. [DOI] [PMC free article] [PubMed] [Google Scholar]
- 25.Brodsky AS, Williamson JR. J. Mol. Biol. 1997;267:624–639. doi: 10.1006/jmbi.1996.0879. [DOI] [PubMed] [Google Scholar]
- 26.Long KS, Crothers DM. Biochemistry. 1999;38:10059–10069. doi: 10.1021/bi990590h. [DOI] [PubMed] [Google Scholar]
- 27.Tao J, Chen L, Frankel AD. Biochemistry. 1997;36:3491–3495. doi: 10.1021/bi962259t. [DOI] [PubMed] [Google Scholar]
- 28.Ulrich EL, et al. Nucleic Acids Res. 2007;36:402–408. [Google Scholar]
- 29.Bak M, Rasmussen JT, Nielsen NC. J. Magn. Reson. 2000;147:296–330. doi: 10.1006/jmre.2000.2179. [DOI] [PubMed] [Google Scholar]
Associated Data
This section collects any data citations, data availability statements, or supplementary materials included in this article.


