Abstract
OBJECTIVES
To evaluate the relationship between serial c-TnT levels with infarct size and left ventricular ejection fraction (LVEF) by gated single photon emission computed tomography myocardial perfusion imaging (SPECT-MPI) in patients with acute myocardial infarction (AMI).
BACKGROUND
Current guidelines recommend the use of troponin (c-Tn) as the biomarker of choice for diagnosis of AMI. Data relating c-TnT to SPECT-MPI in patients with AMI are limited.
METHODS
A subset of patients with first AMI participating in a community-based cohort of AMI in Olmsted County, MN, were prospectively studied. Serial c-TnT levels were evaluated at presentation, <12 hours, 1 day, 2 days, and 3 days after onset of pain. Peak c-TnT was defined as the maximum c-TnT value.
RESULTS
121 patients (age 61 ± 13; 31% women) with AMI underwent gated SPECT-MPI at a median (25th percentile; 75th percentile) of 10 (5; 15) days post-AMI. The type of infarct was NSTEMI in 61% and 13 % were anterior in location. Median infarct size was 1% (0%; 11%) and median gated LVEF was 54% (47%; 60%). 59 patients (49% of the population) had no measurable infarction by SPECT-MPI. Independent predictors for measurable SPECT-MPI infarct size included c-TnT at days 1, 2, 3 and peak c-TnT, but not at presentation or < 12 hours. In ROC analysis the AUC was highest at day 3. ROC analysis demonstrated a cut-off of 1.5 ng/mL for peak c-TnT for detection of measurable infarct size.
CONCLUSIONS
In a community-based cohort of patients with first AMI, independent predictors of measurable SPECT-MPI infarct size included c-TnT at days 1, 2, 3 and peak c-TnT. In contrast, c-TnT at presentation and <12 hours were not independent predictors of MI size as assessed by SPECT-MPI. ROC analysis demonstrated a cut-off value peak c-TnT of 1.5 ng/mL for detection of measurable infarct.
Keywords: Imaging, myocardial infarction, scintigraphy, infarct size, troponin
The American College of Cardiology/European Society of Cardiology (ACC/ESC) diagnostic criteria for acute myocardial infarction (AMI) combine ischemic symptoms and/or electrocardiographic changes with biochemical markers of myocardial necrosis (1). Cardiac troponin (c-Tn) has been designated as the biomarker of choice for the diagnosis of AMI (1). Serial c-Tn samples should be acquired at presentation and 6 to 9 hours in most patients, with a third sample at 12 to 24 hours in the occasional patient where the initial measurements are not elevated and the clinical index of suspicion remains high (1,2).
Current clinical practice in the United States involves serial c-Tn measurements during the initial hours after presentation. In the setting of AMI, c-TnT appears in the serum within 1 to 3 hours and remains elevated for 4 to 10 days (1). An elevated c-Tn value establishes the diagnosis of infarction (1), but the clinical significance of the magnitude of elevation of c-Tn is not clear. Clinicians commonly assume that c-Tn values measured at presentation and at 6 to 9 hours later reflect infarct size. However, only a small number of studies have examined the association between c-Tn values and infarct size with variable results (3–7). The optimal time to sample c-Tn that best predicts infarct size is unknown. Nonetheless, c-Tn release as a reflection of infarct size is already being used as an endpoint to assess the efficacy of therapy in AMI trials (8).
Infarct size can be accurately quantitated by both the size of the perfusion defect on single photon emission computed tomography myocardial perfusion imaging (SPECT-MPI) and left ventricular ejection fraction (LVEF) (9). Infarct size measured by SPECT-MPI (10–12) or LVEF (12,13) is a powerful predictor of outcome post-AMI. Accordingly, the aim of this study was to evaluate the associations between serial values of c-TnT and nuclear indices of infarct size in a series of patients with first AMI, diagnosed with the ACC/ESC criteria (1).
METHODS
Patients
The study was approved by the Mayo Clinic Institutional Review Board. Patients provided written informed consent. We prospectively recruited a sample of 121 patients hospitalized with a first AMI between November 2002 to October 2007. These patients represented a subset of patients who were enrolled in a prospective, community-based AMI study from Olmsted County MN designed to examine changes in the incidence of AMI diagnosis resulting from using cTnT in place of the MB fraction of creatine kinase (CK-MB). Details of this study have been published elsewhere (14). For MI diagnosis, we applied a computerized algorithm which integrated ischemic symptoms, Minnesota code of the electrocardiograms, and c-TnT levels (14). For this algorithm, 3 electrocardiograms were electronically available and were coded using a previously validated electronically coding system. For those patients who were transferred from another medical facility in Olmsted County to the Mayo Clinic Emergency Department (n= 13), the presentation electrocardiograms were not electronically available. For these transferred patients, the clinician’s interpretation of the electrocardiogram recorded in the medical record was used for the AMI diagnosis.
Since nuclear indices of infarction cannot separate past from present AMI, only patients with a documented first AMI were enrolled in this sub-study. The linkage system from the Rochester Epidemiology project (15) enabled the identification of patients with prior AMI by history. Electrocardiograms and electronic medical records of all eligible patients were reviewed to exclude patients with significant Q waves on the electrocardiogram or evidence of reduced LVEF, regional wall motion abnormality, or perfusion defect on any prior cardiac imaging modality (echocardiogram or SPECT-MPI). Since peri-procedural AMI can be difficult to diagnose, patients with a history of percutaneous coronary intervention (PCI) or coronary artery bypass surgery were not included in this study. There were 37 patients not included in this study because of previous history of MI or revascularization and 78 patients declined to participate in this study.
Clinical data obtained included comorbidities measured by the Charlson index (16) and Killip class. Clinical diagnoses were used to ascertain hypertension, diabetes mellitus, hyperlipidemia, family history of coronary disease and smoking status. Medications recorded during the hospitalization for the acute event included beta-blockers, angiotensin-converting enzyme inhibitors, angiotensin II receptor blockers, statins and aspirin. Reperfusion or revascularization therapy was defined as the use of thrombolytic therapy, percutaneous coronary intervention, or coronary artery bypass surgery within the same hospitalization. All decisions regarding patient management were left to the discretion of the attending cardiologists, the vast majority of whom were not investigators in this study.
Serial c-TnT
All patients had an elevation of cardiac c-TnT above 0.03 ng/ml (14). This threshold was the 10% coefficient variation for the assay used at our institution during the time frame of this study. C-TnT was measured by the third generation c-TnT assay (17) in the Department of Laboratory Medicine and Pathology, which is certified by the Clinical Laboratory Improvement Act of 1988 and by the College of American Pathologists.
C-TnT levels were ordered at the discretion of the attending cardiologists. For this reason c-TnT levels were not available at all time points in all patients. Serial c-TnT levels were obtained at presentation (121 patients), <12 hours (96 patients), 12– 24 hours (99 patients), Day 2 (72 patients) and Day 3 (45 patients). We performed a preliminary analysis of our data after the evaluation of 53 patients and recognized the potential value of obtaining later measurements of c-TnT at ≥4 days. From this time point forward, c-TnT values were obtained at ≥4 days when possible but in only 29 patients and those samples were not included in this analysis due to the small number.
Technetium-99m Sestamibi SPECT-MPI
All patients underwent gated SPECT-MPI at a median of 10 days (25th percentile 5 days, 75th percentile 15 days) post AMI. For this study, 45 patients underwent a clinically-indicated stress SPECT-MPI and 76 patients underwent a research SPECT-MPI if not ordered for clinical reasons. All imaging was performed at least 117 hours after the onset of symptoms. This timeframe was selected because SPECT-MPI performed before the fifth day has been shown to overestimate infarct size. For the clinically-indicated stress tests (1 day rest-stress sequence), 8–12 mCi of Technetium (Tc)-99m sestamibi were administered for the resting images and 32–48 mCi of Tc-99m sestamibi for the stress images. For the research scans patients underwent resting imaging only and received an intravenous injection of 20–30 mCi of Tc-99m sestamibi. Infarct size was determined from the resting images. LVEF was calculated from the post-stress gated images.
SPECT images were acquired beginning 45–60 minutes after Tc-99m sestamibi injection using a rotating gamma camera with a low-energy, all-purpose collimator. Processing and reconstruction were performed using standard back-projection algorithms and a Ramp-Hanning filter. Infarct size was quantitated using established methods (10). Circumferential count profiles were generated for 5 representative short-axis slices of the left ventricle extending from apex to base. Infarct size was quantitated using a threshold value of 60% of peak counts. The defect size was expressed as a percentage of the left ventricle. Gated SPECT LVEF was measured using QGS software (Cedars-Sinai Medical Center) (18). LVEF was not available in 22 (18%) patients due to technical factors.
Coronary angiography
Coronary angiography was performed at the discretion of the attending cardiologist. The angiograms were interpreted by 2 experiences observers according to the Coronary Artery Surgery Study (CASS) coding system: ≥ 50 left main stenosis or ≥ 70% stenosis of the left anterior descending, left circumflex, or right coronary arteries or their major branches considered significant (19). The success of PCI was determined by the same individuals.
Follow-up
Follow up was obtained at a mean duration of 4.8 ± 1.6 years. Data was obtained by surveillance of medical records. The ascertainment of death incorporated death certificates filed in Olmsted County, autopsy reports, obituary notices, and electronic files of death certificates obtained from the State of Minnesota Department of Vital and Health Statistics (15). The diagnosis of HF was validated using the Framingham criteria (20). We previously reported the reliability of the application of these diagnostic criteria in our cohort (21). Major cardiac events at follow-up were defined as death or HF.
Statistical analysis
Data are presented as frequencies for categorical variables, as means with standard deviations for continuous variables, or as medians with 25th–75th percentiles for variables with skewed distribution. Time zero was defined as the time of onset of symptoms. C-TnT values were categorized using the following approach: <12 hours; 12–24 hours, day 2, day 3, and peak. A value was defined as peak if it was the highest in the time course. In a secondary analysis, models were repeated considering time zero as the time of presentation to the emergency department. For the secondary analysis we also categorized the time points as <12 hours; 12–24 hours, day 2, day 3, and peak.
Unadjusted and adjusted logistic regression models were developed to test the associations of measurements of c-TnT at each of these time points with SPECT-MPI infarct size of 0% (non-measurable infarct) or ≥ 1% (measurable infarct). The models were adjusted for age, gender, ST elevation (STEMI) or non-ST elevation (NSTEMI) AMI and AMI location. These variables were chosen from those known to be of clinical relevance for post-AMI risk stratification.
Receiver operator characteristics (ROC) were analyzed to evaluate the relationship between c-TnT values at the time points and measurable and non-measurable SPECT-MPI infarct size. Using ROC analysis the best cut-off of c-TnT for the detection of measurable SPECT-MPI infarct size at each time point was identified.
The correlations between c-TnT and SPECT-MPI infarct size and between c-TnT and LVEF were analyzed by the Spearman test. The Spearman test was also used to analyze the correlation between infarct size and peak c-TnT in patients who underwent PCI ≤ 9 hours versus >9 hours from onset of symptoms to first balloon inflation. This time point was used because 9 hours was the median time from onset of symptoms to first balloon inflation. There were too few patients to evaluate this issue at multiple time points including very early (within 2 hours).
Unadjusted and adjusted Cox proportional hazard regression models were constructed using infarct size or peak c-TnT to estimate hazard ratios (HR) and 95% confidence intervals (CI) for major cardiac events. For all analyses, a p-value ≤0.05 was considered statistically significant. SAS version 9.1 software was used for all statistical analyses.
RESULTS
Clinical Characteristics
(Table 1). The mean age of the population was 61±13 years and approximately two thirds were men. The study cohort was generally a low-risk AMI population: 84% of patients were Killip class I or II and most (86%) had a low Charlson comorbidity index. The type of infarct was NSTEMI in 61% and 13 % were anterior in location.
Table 1.
Baseline clinical characteristics.
| N=121 | |
|---|---|
| Age, mean ±sd, years | 61±13 |
| Men, n (%) | 84 (69) |
| Killip Class | |
| I, n (%) | 98 (81) |
| II, n (%) | 4 (3) |
| III, n (%) | 18 (15) |
| IV, n (%) | 1 (1) |
| Comorbidity Index | |
| 0, n (%) | 58 (48) |
| 1–2, n (%) | 46 (38) |
| 3 and above, n (%) | 17(14) |
| Electrocardiogram | |
| Non STEMI, n, % | 74 (61) |
| Infarct location | |
| Anterior, n (%) | 16(13) |
| Inferior, n (%) | 24(20) |
| Lateral, n (%) | 8(7) |
| Combined, n (%) | 29(24) |
| Indeterminate, n (%) | 44(36) |
| C-TnT median (25th, 75th), ng/mL | |
| Presentation (n = 121) | 0.04 (0.01, 0.16) |
| <12 hours (n = 96) | 0.40 (0.14, 3.31) |
| Day 1 (n = 99) | 0.90 (0.25, 3.01) |
| Day 2 (n = 72) | 1.08 (0.18, 1.92) |
| Day 3 (n = 45) | 1.20 (0.17, 3.08) |
| Peak (n = 121) | 1.46 (0.35, 4.10) |
| Medications | |
| Beta blockers, n (%) | 111(97) |
| ACE/ ARBs, n (%) | 88 (77) |
| Statins, n (%) | 96 (83) |
| Aspirin, n (%) | 114 (99) |
| Risk factors | |
| Hypertension, n (%) | 66(54) |
| Hyperlipidemia, n (%) | 72(59) |
| Diabetes mellitus, n (%) | 21 (17) |
| Family history | 22(18) |
| Current smoker, n (%) | 32(26) |
| Reperfusion, n (%) | 93 (77) |
| Percutaneous coronary intervention, n (%) | 90 (74) * |
| Coronary artery bypass surgery, n (%) | 2 (2) |
| Thrombolysis, n (%) | 1 (1) |
| Coronary angiography | 104 † |
| 0 vessel CAD | 5 |
| 1 vessel CAD | 46 |
| 2 vessel CAD | 37 |
| 3 vessel CAD | 16 |
| Left main CAD | 1 |
| Infarct related coronary artery | |
| LAD, n | 71 |
| LCX, n | 40 |
| RCA, n | 53 |
| No. of stents, mean ± sd | 1.2 ± 0.7 |
| Successful PCI (<20% stenosis), n (%) | 83 (92) |
| Percent stenosis ‡ | |
| Before PCI median (25th%–75th %) | 99 (90,100) |
| After PCI median (25th%–75th %) | 0 (0,0) |
5 PCIs were PTCA only;
total number of patients who underwent coronary angiogram during the same episode of care;
p <0.001 for comparison of percent stenosis before and after PCI.
Patients who had c-TnT levels measured at day 2 and beyond (n= 28) were more likely to be diagnosed with non-STEMIs and more likely to undergo PCI later during hospitalization (median 38 hours; 25th % 25 hours, 75th % 53 hours) than patients who did not have c-TnT levels measured at day 2 and beyond (median 11 hours; 25th % 4 hours, 75th % = 27 hours) (p = 0.003). All other clinical, biochemical and angiographic characteristics were similar between these two groups of patients.
Seventy-seven % of patients were treated with reperfusion therapy, most of whom received PCI (Table 1). Patients who did not undergo reperfusion (n= 28) were older (68±14 years vs 59±13 years; p = 0.002), more likely to be women (61% vs 21%, p < 0.001), p = 0.02) and to be diagnosed with non-STEMI (89% vs 53%, p < 0.001). In addition, those who did not undergo reperfusion had lower peak c-TnT (median 0.4 ng/mL; 25th % 0.1 ng/mL, 75th % 1.5 ng/mL) than those who underwent reperfusion therapy (median 1.8 ng/mL; 25th % 0.6 ng/mL, 75th % 4.7 ng/mL; p < 0.001).
SPECT-MPI infarct size and LVEF
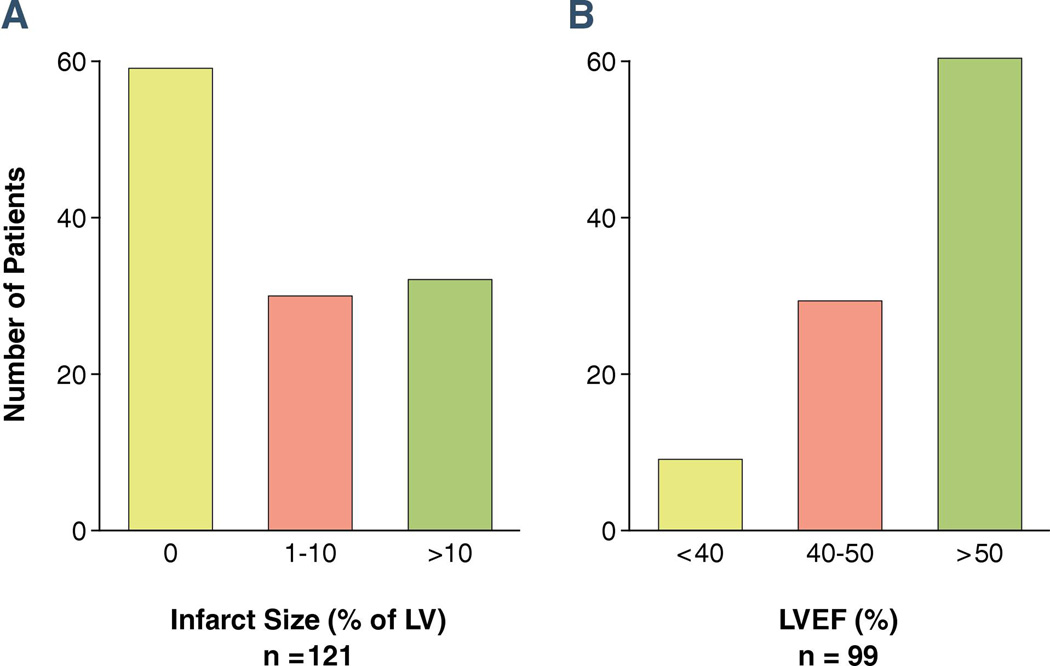
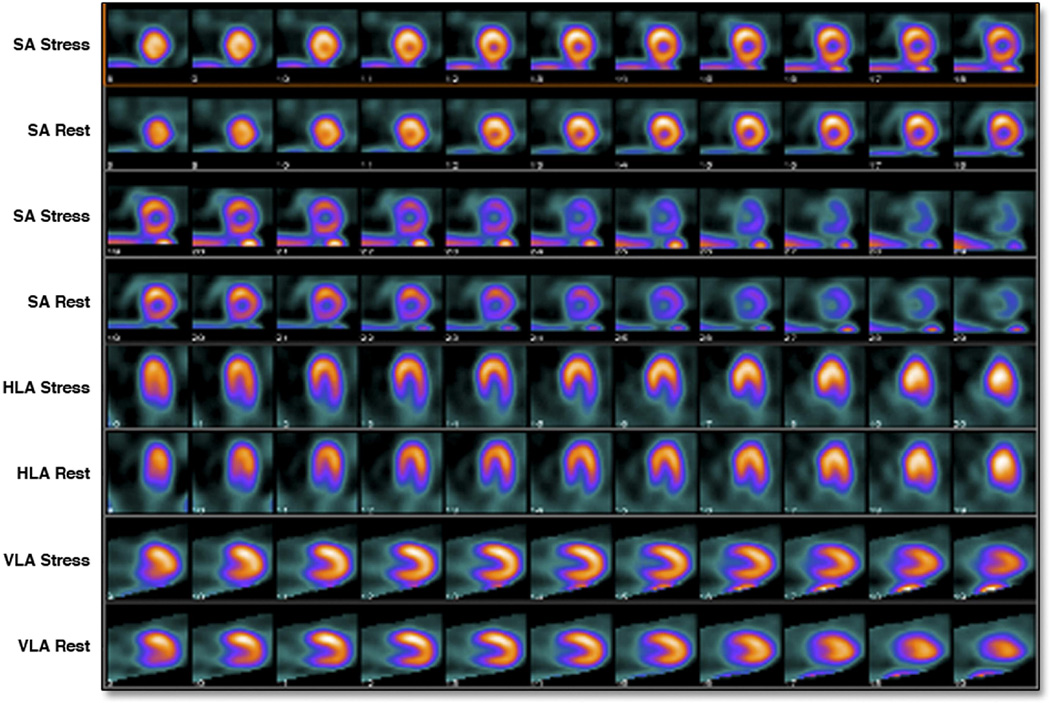
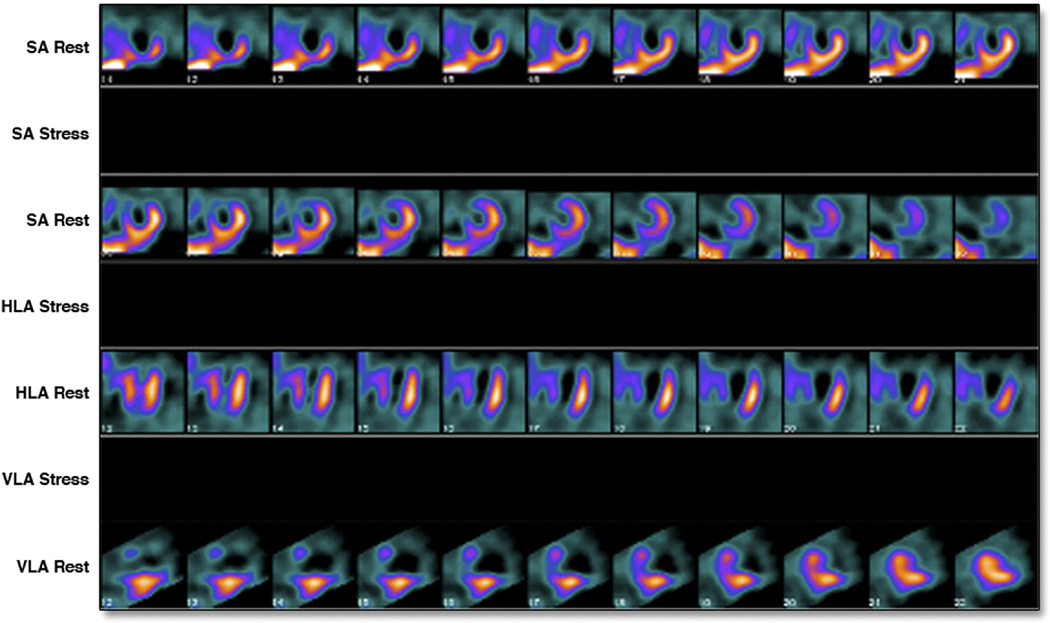
(Figure 1). Median infarct size was 1% (25th % = 0%, 75th % = 11%). Almost half (49%) of patients had no measurable infarct size. Figure 2 shows an example of no measurable infarct size and Figure 3 shows measurable infarct size. Only 25% of patients had infarct size >10% of LV. Among the 99 patients who had measurable LVEF, the median LVEF was 54% (25th % = 47%, 75th % = 60%). Of those, nearly two thirds (62%) had LVEF > 50%. Patients with measurable infarct size had higher values for peak c-TnT (median 2.9 ng/mL; 25th % 0.9 ng/mL, 75th % 6.2 ng/mL), than those without measurable infarct (median 0.7 ng/mL; 25th % 0.2 ng/mL, 75th % 1.8 ng/mL; p < 0.0001).
Figure 1. Distribution of SPECT-MPI infarct size (panel A) and LVEF (panel B).
Panel A shows that almost half of patients had no measurable infarct size. Panel B shows that most patients had preserved LVEF.
Figure 2. Example of non-measurable infarct size.
Stress and rest images of an 80-year-old man who presented 2 hours after onset chest pain with an anterior wall NSTEMI. Initial c-TnT was 0.21 ng/mL. C-TnT at day 3 was 1.8 ng/mL. SPECT-MPI showed no perfusion defects. LVEF was 55%.
Figure 3. Example of measurable infarct size.
Rest only images of a 47-year-old-man who presented 21 hours after onset of chest pain with an anterior wall STEMI treated with direct PCI. Initial c-TnT was 4.55 ng/mL. C-TnT at day 3 was < 0.01 ng/mL. SPECT-MPI showed a large anterior, apical, antero-lateral and antero-septal perfusion defect. Infarct size was quantitated at 55% of the LV. LVEF was 32%.
Relationship between serial c-TnT with SPECT-MPI infarct size and LVEF
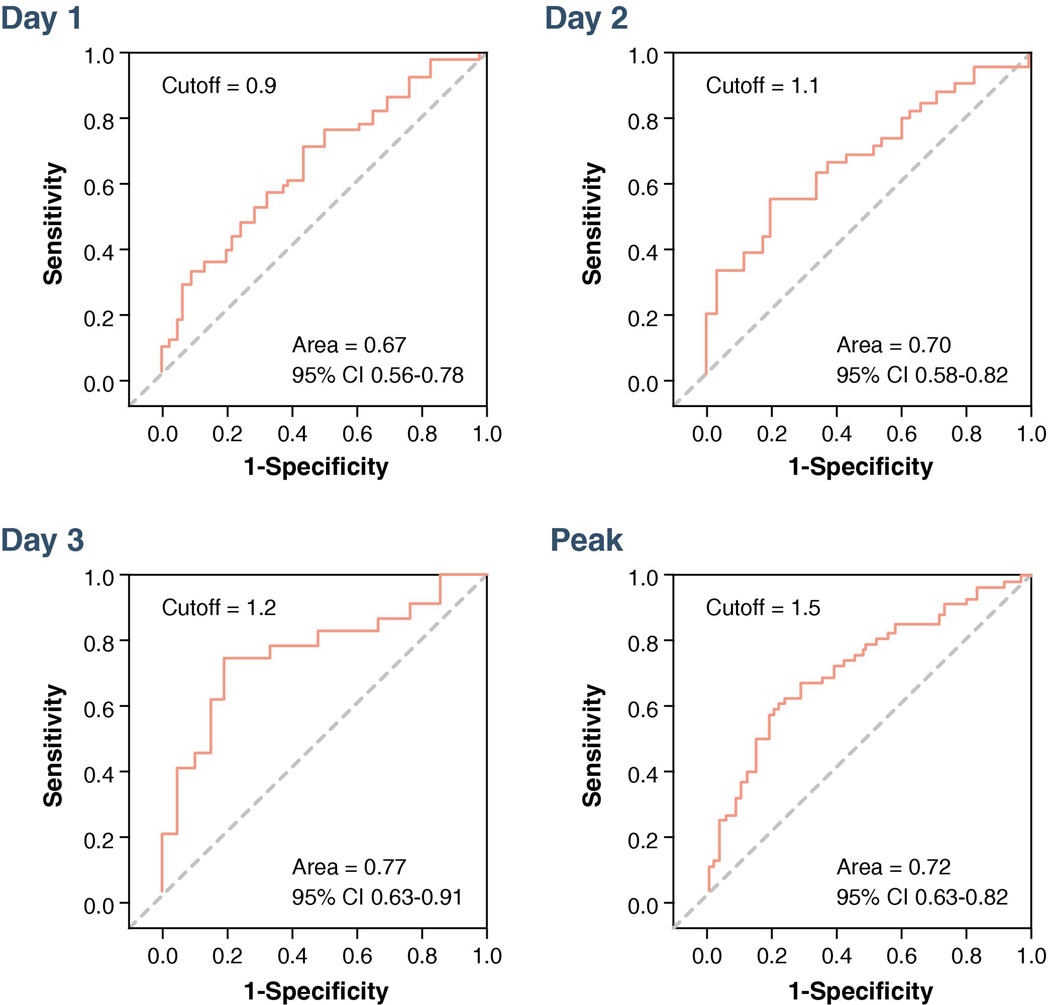
In the unadjusted logistic regression model, admission c-TnT was not associated with measurable SPECT-MPI infarct size. However, c-TnT values at <12 hours, day 1, day 2, day 3, and peak were all associated with the presence of measurable infarct size (Table 2). After adjustment for age, gender, type of AMI and location of AMI, independent predictors for measurable SPECT-MPI infarct size included c-TnT at day 1, day 2, day 3, and peak c-TnT; c-TnT <12 hours was no longer associated with measurable SPECT-MPI infarct size. In ROC analysis the AUC was highest at day 3 (Figure 4). ROC analysis demonstrated a cut-off of 1.5 ng/mL for peak c-TnT for detection of measurable infarct size (Figure 4).
Table 2.
Associations between c-TnT and measurable SPECT-MPI infarct size
| Unadjusted | Adjusted* | |
|---|---|---|
| Time | Odds ratio (p value) |
Odds ratio (p-value) |
| Presentation | 1.00 (0.98) |
0.97 (0.86) |
| < 12 hours | 1.17 (0.04) |
1.18 (0.10) |
| Day 1 | 1.27 (0.01) |
1.26 (0.03) |
| Day 2 | 1.78 (0.007) |
1.66 (0.02) |
| Day 3 | 2.03 (0.007) |
2.27 (0.008) |
| Peak | 1.33 (<0.001) |
1.34 (0.003) |
adjusted for age, gender, AMI type, and location; odds ratios are expressed per every 1 ng/mL increase in c-TnT.
Figure 4. ROC analysis displaying the performance of c-TnT to identify measurable versus non-measurable SPECT-MPI infarct size.
The AUC was highest at day 3. ROC analysis demonstrated a cut-off of 1.5 ng/mL for peak c-TnT for detection of measurable infarct size.
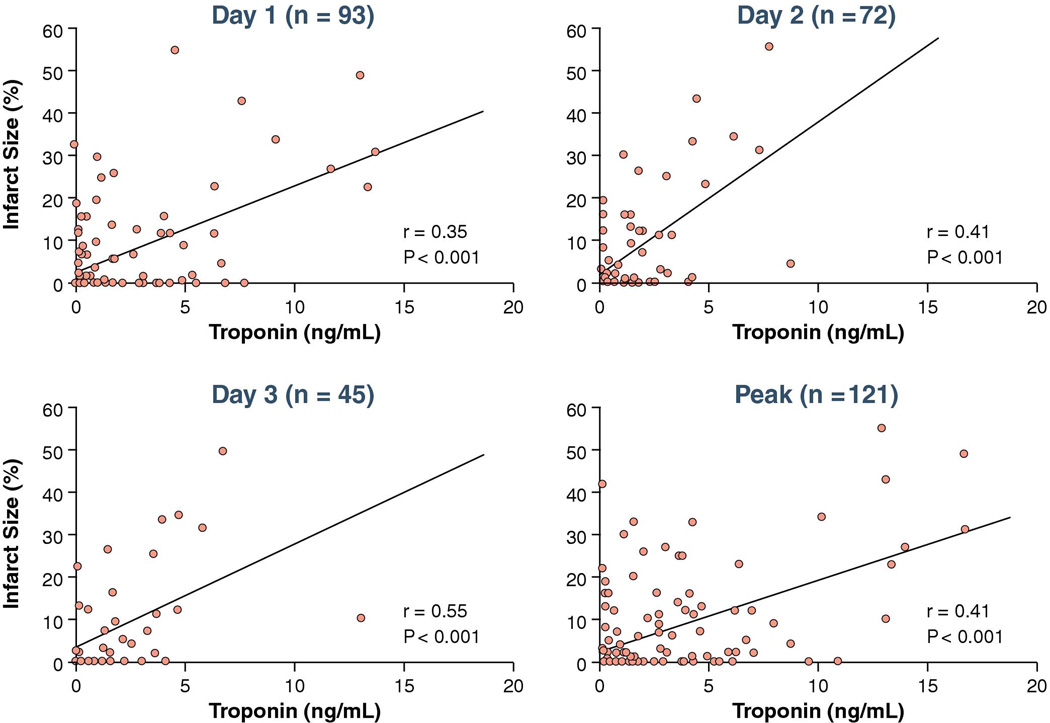
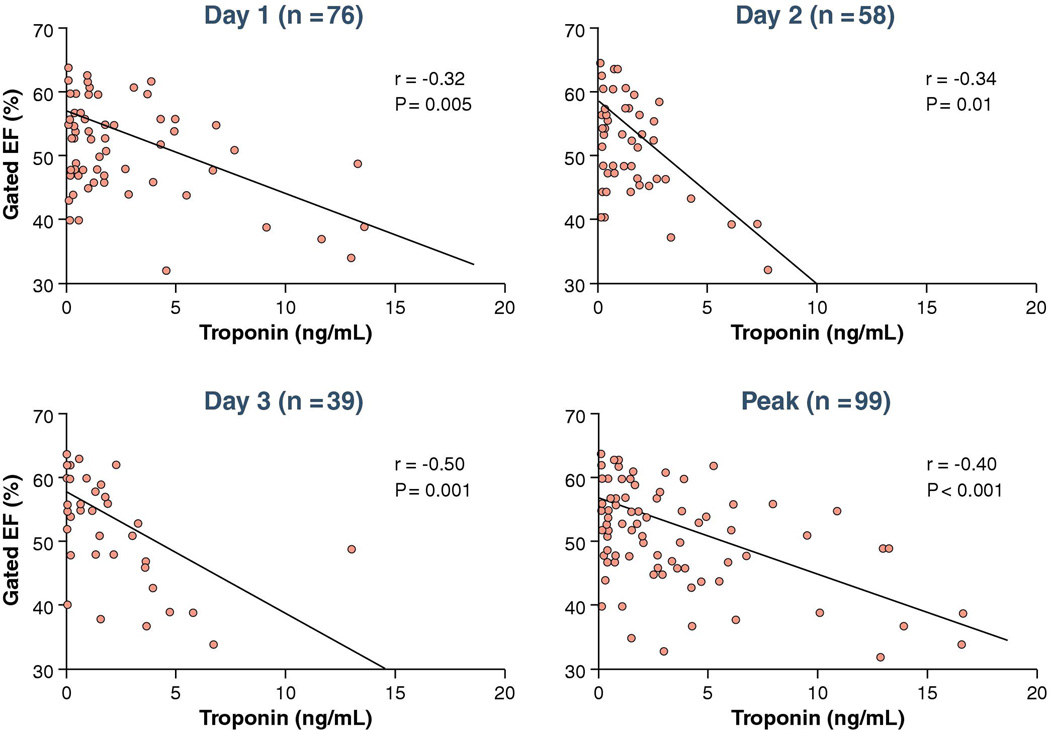
There were significant positive correlations of the magnitude of c-TnT values at days 1, 2, 3 and peak with infarct size but r values were modest (Figure 5). Of note SPECT-MPI did not detect infarction in 49% of patients who met the c-TnT threshold for infarction. There were significant negative correlations of LVEF and c-TnT values at days 1, 2, 3 and peak c-TnT also with modest r values (Figure 6). There were similar correlations between infarct size and peak c-TnT in those patients ≤ 9 hours from onset of symptoms to first balloon inflation (r = 0.47, p = 0.001) versus those > 9 hours from onset of symptoms to first balloon inflation (r = 0.48, p < 0.001).
Figure 5. Correlations between SPECT-MPI infarct size and troponin.
There were significant positive correlations of the magnitude of c-TnT values at days 1, 2, 3 and peak with infarct size but r values were modest.
Figure 6. Correlations between LVEF and troponin.
There were significant negative correlations of LVEF and c-TnT values at days 1, 2, 3 and peak c-TnT also with modest r values
In a secondary analysis considering time zero as the time of presentation, c-TnT <12 hours was associated with SPECT-MPI infarct size in the unadjusted logistic model (odds ratio = 1.22, p = 0.009). This association persisted after adjustment (odds ratio = 1.22, p = 0.03). For all other time points the associations were similar to the associations described that used time zero as onset of symptoms.
Follow-up
During follow-up 10 patients died and 15 experienced HF. Both infarct size (HR 1.4; 95 % CI 1.1 – 14.2, p = 0.006) and peak c-Tn-T (HR 2.8; 95 % CI 1.1 – 6.9, p = 0.03.) were significantly associated with major cardiac events. The association between infarct size and major cardiac events persisted after adjustment for age (p = 0.003) and sex (p = 0.006). The association between peak c-TnT and major cardiac events also persisted after adjustment for age (p = 0.003) and sex (p = 0.03).
DISCUSSION
In this community-based cohort of patients with a first AMI defined by contemporary criteria, novel findings include that SPECT-MPI did not detect measurable infarct in nearly half of the patients and that independent predictors for measurable SPECT-MPI infarct size were c-TnT at days 1, 2, 3 and peak c-TnT. In addition, ROC analysis demonstrated a cut-off value peak c-TnT of 1.5 ng/mL for detection of measurable infarct. Finally, infarct size and peak c-TnT were associated with major cardiac events at follow up.
cTnT and SPECT imaging for diagnosis of AMI
In a prior study (14), we reported that implementation of c-TnT in place of CK-MB for the diagnosis of AMI resulted in a 74% increase in the number of AMIs with a change in the case mix. Cases diagnosed with AMI by c-TnT criteria only were less likely to have STEMI and had better survival compared to those diagnosed by the traditional CK-MB approach (14). These changes resulted from the increased sensitivity of c-TnT versus CK-MB, presumably resulting in the identification of patients with smaller infarcts. The results of the present imaging study support this concept. In this study 70% of patients had NSTEMI; furthermore, approximately 50% of patients had no measurable infarct by SPECT-MPI and another 25% had infarct size between 1 –10% of the left ventricle. SPECT-MPI can detect infarcts as small as 3% of the left ventricle (22) but can miss smaller infarcts, especially non-transmural infarcts involving < 50% of the left ventricular wall thickness as demonstrated by studies using cardiac magnetic resonance imaging (23).
Troponin and infarct size
The peak level of CK-MB, the former biomarker for establishing the diagnosis of AMI, was shown to reflect infarct size and was accepted as a clinical method for estimating infarct size (9,24). This measurement is less reliable in patients treated with reperfusion therapy (9). Although an elevated troponin level is currently required for diagnostic purposes (1,2), there is little data examining the optimal timing intervals for obtaining c-TnT samples or the magnitude of c-TnT levels for determining infarct size.
In a prior study of 61 patients with AMI (31 STEMI, 30 non-STEMI) who underwent serial c-TnT assay and magnetic resonance imaging (MRI) for infarct size, measurements of c-TnT within 4 days after the acute event correlated with infarct size except for the admission c-TnT (4). In our study we confirmed these observations in a larger sample size, using a different imaging modality. We observed that c-TnT levels measured beyond the first 24 hours post acute event are associated with SPECT-MPI indices of infarct size. The prior study (4) also reported significant but modest correlations (r values of 0.64 – 0.66 for all patients with available c-TnT levels between days 1– 4 and MRI infarct mass), with substantially worse r values (r = 0.36 at day 4) for patients with non-STEMI or those with small infarct mass (r= 0.2 at day 4). In the present study the majority of patients had non-STEMI or small infarct size, helping explain the modest r values.
A previous study reported a significant correlation between single time point measurements of c-TnT at day 3 post AMI with infarct size by SPECT-MPI (25). A single measurement of c-TnT at day 4 post AMI was also previously associated with infarct size quantitated by magnetic resonance imaging (3). In the present study the correlations between c-TnT and infarct size improved as the timing post-MI increased. However, the subset of patients who had c-TnT levels measured at day 2 and beyond were more likely to be diagnosed with non-STEMIs and more likely to undergo reperfusion therapy later during hospitalization. Thus, type of AMI and more prolonged interval for reperfusion therapy in this group of patients may have contributed to the slightly higher correlation of c-TnT level with infarct size at later time points (days 2 and 3) observed in our present study.
Prognosis
In the present study, both infarct size and peak c-TnT were predictors for major cardiac events at follow up, also supporting the findings of prior studies. Patients with “microinfarcts” diagnosed by c-TnT criteria have a favorable prognosis (14,26). Several studies that enrolled primarily patients with STEMI treated with reperfusion therapy reported that patients with SPECT-MPI infarct size ≤ 10% of the left ventricle have mortality rates between 0% and 1% during follow-up of 6 months to 2 years (10–12,27,28).
Limitations
Limitations of this study include the relatively small numbers of c-TnT measurements, particularly the later measurements. Enrollment in this study was slower than anticipated, related to the method of screening patients for enrollment (cardiovascular research nurses carefully reviewed each potential participant’s electronic record and excluded participants with any possible evidence for prior MI on the basis of history, ECG or imaging study). Also, in the current era of short hospital stay, several patients were unwilling to return for a SPECT study, 5 days or later after their AMI for research purposes. Infarct size was quantitated by low-dose Tc-99m sestamibi (8 – 12 mCi) resting images in 45 patients who underwent stress SPECT MPI. The validation studies of previous applications of this technique were performed in studies where the resting dose of Tc-99 sestamibi doses was 20-30 mCI. Prior work demonstrated that soft tissue artifact could influence infarct size measurement in some obese patients (10). This issue could potentially play a more important role in this study, given the small median infarct size and the low-dose isotope injection for some of the resting scans. Use of a lower dose increases the “noise” of the images and the possibility that soft-tissue attenuation is incorrectly quantified as infarction.
Implications of the present study
The ACC/ESC AMI guideline recommends obtaining c-Tn samples at presentation and again 6 to 9 hours later in patients with suspected AMI. Clinicians commonly view the magnitude of c-TnT levels measured at these early time points as indicative of infarct size. The data from the present study indicate that these early measurements of c-TnT do not accurately reflect SPECT-MPI infarct size or LVEF, whereas c-TnT values beyond the first 24 hours are associated with indices of infarct size. In addition, ROC analysis demonstrated a cut-off value peak c-TnT of 1.5 ng/mL for detection of measurable infarct. Both infarct size and peak c-TnT identified patients at increased risk for major cardiac events at follow up.
Acknowledgments
Funding Sources: This study was supported by a Clinician Investigator Fellowship Award from the Mayo Clinic, grants from the Public Health Service and the National Institutes of Health (AR30582, R01 HL 59205 and R01 HL 72435) and by a research grant from Xantheus Medical Imaging. Dr Roger is an Established Investigator of the American Heart Association.
We would like to thank Beth Kaping, RN and Mary Phelps, RN for study coordination, Ellen Koepsell, RN, for enrollment of patients, the study manager Susan Stotz, RN for assistance in data collection, and Jill Killian for data analyses.
References
- 1.Alpert JS, Thygesen K, Antman E, Bassand JP. Myocardial infarction redefined--a consensus document of The Joint European Society of Cardiology/American College of Cardiology Committee for the redefinition of myocardial infarction. J Am Coll Cardiol. 2000;36:959–969. doi: 10.1016/s0735-1097(00)00804-4. [DOI] [PubMed] [Google Scholar]
- 2.Thygesen K, Alpert JS, White HD. Universal definition of myocardial infarction. J Am Coll Cardiol. 2007;50:2173–2195. doi: 10.1016/j.jacc.2007.09.011. [DOI] [PubMed] [Google Scholar]
- 3.Steen H, Giannitsis E, Futterer S, Merten C, Juenger C, Katus HA. Cardiac troponin T at 96 hours after acute myocardial infarction correlates with infarct size and cardiac function. J Am Coll Cardiol. 2006;48:2192–2194. doi: 10.1016/j.jacc.2006.06.002. [DOI] [PubMed] [Google Scholar]
- 4.Giannitsis E, Steen H, Kurz K, et al. Cardiac magnetic resonance imaging study for quantification of infarct size comparing directly serial versus single time-point measurements of cardiac troponin T. J Am Coll Cardiol. 2008;51:307–314. doi: 10.1016/j.jacc.2007.09.041. [DOI] [PubMed] [Google Scholar]
- 5.Vasile VC, Babuin L, Giannitsis E, Katus HA, Jaffe AS. Relationship of MRI-determined infarct size and cTnI measurements in patients with ST-elevation myocardial infarction. Clin Chem. 2008;54:617–619. doi: 10.1373/clinchem.2007.095604. [DOI] [PubMed] [Google Scholar]
- 6.Hedstrom E, Astrom-Olsson K, Ohlin H, et al. Peak CKMB and cTnT accurately estimates myocardial infarct size after reperfusion. Scand Cardiovasc J. 2007;41:44–50. doi: 10.1080/14017430601071849. [DOI] [PubMed] [Google Scholar]
- 7.Tzivoni D, Koukoui D, Guetta V, Novack L, Cowing G. Comparison of Troponin T to creatine kinase and to radionuclide cardiac imaging infarct size in patients with ST-elevation myocardial infarction undergoing primary angioplasty. Am J Cardiol. 2008;101:753–757. doi: 10.1016/j.amjcard.2007.09.119. [DOI] [PubMed] [Google Scholar]
- 8.Piot C, Croisille P, Staat P, et al. Effect of cyclosporine on reperfusion injury in acute myocardial infarction. N Engl J Med. 2008;359:473–481. doi: 10.1056/NEJMoa071142. [DOI] [PubMed] [Google Scholar]
- 9.Gibbons RJ, Valeti US, Araoz PA, Jaffe AS. The quantification of infarct size. Journal of the American College of Cardiology. 2004;44:1533–1542. doi: 10.1016/j.jacc.2004.06.071. [DOI] [PubMed] [Google Scholar]
- 10.Miller TD, Christian TF, Hopfenspirger MR, Hodge DO, Gersh BJ, Gibbons RJ. Infarct size after acute myocardial infarction measured by quantitative tomographic 99mTc sestamibi imaging predicts subsequent mortality. Circulation. 1995;92:334–341. doi: 10.1161/01.cir.92.3.334. [DOI] [PubMed] [Google Scholar]
- 11.Miller TD, Hodge DO, Sutton JM, et al. Usefulness of technetium-99m sestamibi infarct size in predicting posthospital mortality following acute myocardial infarction. Am J Cardiol. 1998;81:1491–1493. doi: 10.1016/s0002-9149(98)00220-3. [DOI] [PubMed] [Google Scholar]
- 12.Burns RJ, Gibbons RJ, Yi Q, et al. The relationships of left ventricular ejection fraction, end-systolic volume index and infarct size to six-month mortality after hospital discharge following myocardial infarction treated by thrombolysis. J Am Coll Cardiol. 2002;39:30–36. doi: 10.1016/s0735-1097(01)01711-9. [DOI] [PubMed] [Google Scholar]
- 13.Ndrepepa G, Mehilli J, Martinoff S, Schwaiger M, Schomig A, Kastrati A. Evolution of left ventricular ejection fraction and its relationship to infarct size after acute myocardial infarction. J Am Coll Cardiol. 2007;50:149–156. doi: 10.1016/j.jacc.2007.03.034. [DOI] [PubMed] [Google Scholar]
- 14.Roger VL, Killian JM, Weston SA, et al. Redefinition of myocardial infarction: prospective evaluation in the community. Circulation. 2006;114:790–797. doi: 10.1161/CIRCULATIONAHA.106.627505. [DOI] [PubMed] [Google Scholar]
- 15.Melton LJ., 3rd History of the Rochester Epidemiology Project. Mayo Clin Proc. 1996;71:266–274. doi: 10.4065/71.3.266. [DOI] [PubMed] [Google Scholar]
- 16.Charlson ME, Pompei P, Ales KL, MacKenzie CR. A new method of classifying prognostic comorbidity in longitudinal studies: development and validation. J Chronic Dis. 1987;40:373–383. doi: 10.1016/0021-9681(87)90171-8. [DOI] [PubMed] [Google Scholar]
- 17.Hallermayer K, Klenner D, Vogel R. Use of recombinant human cardiac Troponin T for standardization of third generation Troponin T methods. Scand J Clin Lab Invest Suppl. 1999;230:128–131. [PubMed] [Google Scholar]
- 18.Germano G, Kiat H, Kavanagh PB, et al. Automatic quantification of ejection fraction from gated myocardial perfusion SPECT. J Nucl Med. 1995;36:2138–2147. [PubMed] [Google Scholar]
- 19.Chaitman BR, Bourassa MG, Davis K, et al. Angiographic prevalence of high-risk coronary artery disease in patient subsets (CASS) Circulation. 1981;64:360–367. doi: 10.1161/01.cir.64.2.360. [DOI] [PubMed] [Google Scholar]
- 20.Ho KK, Anderson KM, Kannel WB, Grossman W, Levy D. Survival after the onset of congestive heart failure in Framingham Heart Study subjects. Circulation. 1993;88:107–115. doi: 10.1161/01.cir.88.1.107. [DOI] [PubMed] [Google Scholar]
- 21.Hellermann JP, Goraya TY, Jacobsen SJ, et al. Incidence of heart failure after myocardial infarction: is it changing over time? Am J Epidemiol. 2003;157:1101–1107. doi: 10.1093/aje/kwg078. [DOI] [PubMed] [Google Scholar]
- 22.O'Connor MK, Gibbons RJ, Juni JE, O'Keefe J, Jr, Ali A. Quantitative myocardial SPECT for infarct sizing: feasibility of a multicenter trial evaluated using a cardiac phantom. J Nucl Med. 1995;36:1130–1136. [PubMed] [Google Scholar]
- 23.Wagner A, Mahrholdt H, Holly TA, et al. Contrast-enhanced MRI and routine single photon emission computed tomography (SPECT) perfusion imaging for detection of subendocardial myocardial infarcts: an imaging study. Lancet. 2003;361:374–379. doi: 10.1016/S0140-6736(03)12389-6. [see comment] [DOI] [PubMed] [Google Scholar]
- 24.Hackel DB, Reimer KA, Ideker RE, et al. Comparison of enzymatic and anatomic estimates of myocardial infarct size in man. Circulation. 1984;70:824–835. doi: 10.1161/01.cir.70.5.824. [DOI] [PubMed] [Google Scholar]
- 25.Panteghini M, Cuccia C, Bonetti G, Giubbini R, Pagani F, Bonini E. Single-point cardiac troponin T at coronary care unit discharge after myocardial infarction correlates with infarct size and ejection fraction. Clin Chem. 2002;48:1432–1436. [PubMed] [Google Scholar]
- 26.Arruda-Olson AM, Pellikka PA, Bursi F, et al. Left ventricular function and heart failure in myocardial infarction: impact of the new definition in the community. Am Heart J. 2008;156:810–815. doi: 10.1016/j.ahj.2008.06.040. [DOI] [PMC free article] [PubMed] [Google Scholar]
- 27.Kastrati A, Mehilli J, Dirschinger J, et al. Myocardial salvage after coronary stenting plus abciximab versus fibrinolysis plus abciximab in patients with acute myocardial infarction: a randomised trial. Lancet. 2002;359:920–925. doi: 10.1016/S0140-6736(02)08022-4. [DOI] [PubMed] [Google Scholar]
- 28.Schomig A, Kastrati A, Dirschinger J, et al. Coronary stenting plus platelet glycoprotein IIb/IIIa blockade compared with tissue plasminogen activator in acute myocardial infarction. Stent versus Thrombolysis for Occluded Coronary Arteries in Patients with Acute Myocardial Infarction Study Investigators. N Engl J Med. 2000;343:385–391. doi: 10.1056/NEJM200008103430602. [DOI] [PubMed] [Google Scholar]


