

Abstract
Five nonfluent aphasia patients participated in a picture-naming treatment that used an intention manipulation (opening a box and pressing a button on a device in the box with the left hand) to initiate naming trials and was designed to re-lateralize word production mechanisms from the left to the right frontal lobe. To test the underlying assumption regarding re-lateralization, patients participated in fMRI of category-member generation before and after treatment. Generally, the four patients who improved during treatment showed reduced frontal activity from pre- to post-treatment fMRI with increasing concentration of activity in the right posterior frontal lobe (motor/premotor cortex, pars opercularis), demonstrating a significant shift in lateraliity toward the right lateral frontal lobe, as predicted. Three of these four patients showed no left frontal activity by completion of treatment, indicating that right posterior lateral frontal activity supported category member generation. Patients who improved in treatment showed no difference in lateralization of lateral frontal activity from normal controls pre-treatment, but post-treatment, their lateral frontal activity during category-member generation was significantly more right lateralized than that of controls. Patterns of activity pre- and post-treatment suggested increasing efficiency of cortical processing as a result of treatment in the four patients who improved. The one patient who did not improve during treatment showed a leftward shift in lateral frontal lateralization that was significantly different from the four patients who did improve. Neither medial frontal nor posterior perisylvian re-lateralization from immediately pre- to immediately post-treatment images was a necessary condition for significant treatment gains or shift in lateral frontal lateralization. Of the three patients who improved and in whom posterior perisylvian activity could be measured at post-treatment fMRI, all maintained equal or greater amounts of left-hemisphere perisylvian activity as compared to right. This finding is consistent with reviews suggesting both hemispheres are involved in recovery of language in aphasia patients.
Keywords: Aphasia, fMRI, Language, Neuroplasticity, Neuroimaging, Rehabilitation, Intention, Attention
INTRODUCTION
It has been clear for more than a century that right-hemisphere mechanisms contribute to language recovery in some patients with aphasia. In particular, right-hemisphere lesion after functional recovery in aphasia can cause deterioration of language (Barlow, 1877; Basso et al., 1989; Gowers, 1887), as can temporary right-hemisphere inactivation during Wada tests (Kinsbourne, 1971). More recent functional imaging studies have provided mixed evidence regarding right-hemisphere participation in language for aphasia patients. However, when the extant literature is carefully reviewed, it indicates that both the right and left hemispheres contribute to language in aphasia (Crosson et al., 2007a). Some evidence suggests that in nonfluent aphasia, right frontal structures are engaged when their left-hemisphere counterpart is damaged (Blank et al., 2003). Hence, in chronic nonfluent aphasia, reorganization of some language production functions to the right hemisphere may be desirable. Yet, many patients fail to demonstrate such reorganization, even with conventional therapy (e.g., Kim et al., 2002).
Thus, a naming treatment was designed to stimulate reorganization of word production to the right lateral frontal lobe. The treatment used a complex left-hand movement to initiate picture-naming attempts. The complex left-hand movement involved opening a box and pressing one of four buttons on a device within the box. Pressing the correct button resulted in presentation of a picture to name on a computer monitor while pressing an incorrect button had no result. The rationale for the treatment was that the complex left-hand movement would activate intention mechanisms in the right medial frontal lobe (e.g., Picard & Strick, 1996), which in turn would activate right lateral frontal structures that could participate in picture naming. This intention treatment was inspired in part by observations that language performance of some patients with parietal lesions improved with an attention manipulation, i.e., moving stimuli into the ipsilesional hemispace (Coslett, 1999). If an attention manipulation improved language performance in patients with parietal lesions, then an intention manipulation (complex left-hand movement) might improve performance for patients with nonfluent aphasia, which is commonly accompanied by frontal lesions (see Crosson et al., 2007b for the detailed treatment rationale).
The new intention treatment was tested in an efficacy study by administering it and a comparison attention treatment to 34 patients with chronic nonfluent aphasia using a cross-over design (Crosson et al., 2007b). For 11 patients with profound naming impairments (picture naming < 20% correct on 40 items with 12 high, 12 medium, and 16 low frequency target words; Mean Boston Naming Test = 1.50 of 60 items correct, SD = 2.32), there were no differences between treatments, with roughly half of the patients improving in both treatments. However, in the 23 patients with moderate (picture naming > 70% correct on the 40 items; Mean Boston Naming Test = 33.00 items correct, SD = 8.45) to severe (20 ≤ picture naming ≤ 70% correct on the 40 items; Mean Boston Naming Test = 12.82 items correct, SD = 9.48) naming impairments, this intention treatment produced a faster rate of relearning picture names than did the comparison treatment, and produced a significant treatment response in 89% of patients. Further, treatment effects generalized to untrained items. Yet, these findings, no matter how encouraging, do not demonstrate that the treatment had the intended effect of engaging right lateral frontal mechanisms. Crosson et al. (2005) presented preliminary fMRI data showing that one patient who benefitted from the intention treatment re-lateralized frontal mechanisms to the right hemisphere during category member generation from pre- to post-intention treatment. The frontal activity of a second patient, who also benefitted from treatment, appeared to be completely re-lateralized to the right hemisphere prior to receiving the intention treatment, when image analysis was time-locked solely to spoken response as opposed to stimuli that evoked responses.
The current report expands the fMRI inquiry to five of the patients from our previous efficacy study (Crosson et al., 2007b). These patients received fMRI during category-member generation immediately before and immediately after a six-week course of the intention treatment. The purpose of this fMRI inquiry was to determine whether the intended changes in the neural substrates of word production occurred as a result of the intention treatment. An improved method of image analysis, combining response- and stimulus-locked approaches (explained below) (Crosson et al., 2007a), was used. Further, because normal older persons may demonstrate greater right-frontal activity than younger persons for word finding tasks (Wierenga et al., 2008), the current report includes for comparison purposes fMRI findings for a normal age-matched control group on the same word-production task. The main hypothesis was that a positive response to the intention treatment would be accompanied by increased lateralization of lateral frontal activity to the right frontal lobe. Specifically, it was hypothesized that patients who showed significant improvement during treatment would demonstrate increased prominence of right lateral frontal activity during word production, as indicated by shift in fMRI lateral frontal laterality indices rightward from pre- to post-treatment. Also, it was hypothesized that patients who showed significant improvement during treatment would demonstrate greater lateral frontal right-hemisphere lateralization post- (but not pre-) treatment than normal age-, education-, and gender-matched controls.
Pre- and post-treatment fMRI data also were used to address three additional questions. (1) The putative mechanism by which right lateral frontal mechanisms were engaged is that the intention manipulation (complex left-hand movement) engages right medial frontal intention mechanisms. In turn, these right-hemisphere mechanisms are thought to activate right lateral frontal structures that, as a result of activation, become engaged in language production. This theoretical proposition raises the following question: Is it necessary for medial frontal structures to demonstrate a rightward shift in lateralization for improvement in treatment or for a rightward shift in lateral frontal activity to occur? (2) Data suggest that both right- and left-hemisphere mechanisms may contribute to language recovery (Crosson, 2007; Crosson et al., 2007a). Further, relateralization of activity to the right hemisphere often occurs in structures homologous to the damaged structures (e.g., Blank et al., 2003; Calvert et al., 2000; Lazar et al., 2000; Thulborn, 1999; Weiller et al., 1995). Such data suggest that even when right-hemisphere structures are engaged in the service of language functions in aphasia, residual knowledge of language in the left hemisphere is useful for leveraging recovery or treatment gains. This analysis indicates that even if the intention treatment is successful in increasing right frontal participation in language production, it may also be necessary to use residual language knowledge in the left posterior perisylvian cortex, raising the following question: Does left posterior perisylvian cortex remain active after the intention treatment induces a rightward shift in lateral frontal activity during word production? (3) Some rehabilitation studies suggest that activity may become more focused and less diffuse as rehabilitation proceeds (e.g., Dobkin et al., 2004). Indeed, repetitive transcranial magnetic stimulation (rTMS) data suggest that right pars triangularis activity actually may impede language recovery, even though activity in more posterior right inferior frontal cortex (right pars opercularis) may support language recovery (Naeser et al., 2005). These data raise the following question: Will post-intention treatment activity become more focused than pre-treatment activity and will activity in right frontal cortex be confined to structures posterior to pars triangularis?
METHODS
Participants
Participants with aphasia
Five aphasia patients (3 female) with moderate to profound word-finding impairment from left-hemisphere infarction were recruited from a larger study of the intention treatment (Crosson et al., 2007b). All patients received both the intention treatment and a comparison attention treatment. Demographic data from the five patients are presented in the top portion of Table 1. Briefly, all participants were premorbidly right-handed as determined by interview of patients or relatives knowing patients prior to stroke. Mean age was 55.0 years (SD = 11.0); four were between the ages of 47 and 54 years; the fifth was 74. Mean education was 14.2 years (SD = 2.28); education varied between 12 and 18 years. Mean time from most recent stroke was 35.6 months (SD = 30.50); time post onset varied from 8 to 83 months. All patients had nonfluent aphasias at two to four weeks post-stroke as determined from medical records, aphasia treatment records, or in some cases, interview of a relative. For purposes of this study, nonfluent aphasia was defined as difficulty initiating and maintaining spoken language output, i.e., hesitations in initiating spoken output, and frequent pauses between words and short phrases. Agrammatism was not required for this diagnosis.
Table 1. Demographic Variables and Test Scoresfor Participants.
| Subj | Hand Dom | Age | Ed | Sex | Mos Post | BNT 60 items pre/post | WAB AQ max=100 pre/post | WAB Flu 10 points pre/post | WAB Nam 100 points pre/post | WAB Comp 200 points pre/post | WAB Rep 100 points pre/post | Aphasia Type |
|---|---|---|---|---|---|---|---|---|---|---|---|---|
| Patients | ||||||||||||
| 02-030 | R | 48 | 14 | F | 8 | 44/44 | 81.4/84.1 | 5/6 | 83/87 | 196/187 | 86/90 | Anomic |
| 03-031 | R | 74 | 12 | M | 83 | 39/47 | 68.8/70.0 | 5/6 | 85/84 | 154/162 | 52/74 | Mild Broca’s |
| 00-008 | R | 47 | 13 | M | 48 | 50/51 | 79.6/84.6 | 8/8 | 72/85 | 172/196 | 80/90 | Anomic |
| 02-036 | R | 52 | 18 | F | 15 | 1/1 | 27.0/33.4 | 1/2 | 22/32 | 98/111 | 26/26 | Broca’s |
| 03-004 | R | 54 | 14 | F | 24 | 1/1 | 32.3/39.2 | 2/2 | 17/20 | 105/140 | 32/36 | Broca’s |
| Controls | ||||||||||||
| 02-C01 | R | 74 | 9 | F | --- | --- | --- | --- | --- | --- | --- | --- |
| 02-C02 | R | 42 | 12 | F | --- | --- | --- | --- | --- | --- | --- | --- |
| 02-C04 | R | 73 | 18 | M | --- | --- | --- | --- | --- | --- | --- | --- |
| 03-C12 | R | 51 | 16 | F | --- | --- | --- | --- | --- | --- | --- | --- |
| 03-C13 | R | 48 | 16 | M | --- | --- | --- | --- | --- | --- | --- | --- |
Hand dom = hand dominance; Ed = years of formal education; Mos Post = number of months post onset of most recent stroke; BNT = raw number of items named on Boston Naming Test; WAB = Western Aphasia Battery Aphasia Quotient; AQ = Aphasia Quotient; Flu = Fluency score; Nam = raw Naming score; Comp = raw Comprehension score; Rep = raw Repetition score. Aphasia type was based on pattern of WAB scores, with the following exception: Although 03-031’s WAB scores technically may fall in the prescribed ranges for conduction aphasia, his pattern of errors in repetition was not typical of conduction aphasia; the grammatical structure and hesitations in output were more consistent with a mild Broca’s aphasia.
Table 1 also gives language test scores for participants with aphasia just prior to the intention treatment. In general, patients were either moderately impaired in language functions (n = 3) with Western Aphasia Battery (WAB) Aphasia Quotients (AQs) just prior to the intention treatment between 68.8 and 81.4, or they were profoundly impaired in language functions (n = 2), with AQs of 27.0 and 32.3. Raw Boston Naming Test (BNT) scores were consistent with these AQs. The three moderately impaired patients had BNT scores between 39 and 50 items correct (maximum score = 60), and the two profoundly impaired patients each had a BNT score of 1 item correct. WAB scores for Fluency, Naming, Comprehension, and Repetition are given in Table 1. Aphasias were classified as Anomic in two moderately impaired patients and as a mild Broca’s aphasia in the third. Both profoundly impaired patients had Broca’s aphasia.
Damage was limited to the left hemisphere per inclusion criteria; patients with a history of other neurological impairment were excluded. Three patients (02-030, 03-031, 00-008) had non-lacunar, non-hemorrhagic, middle cerebral artery (MCA) infarcts that varied in size and location. One patient (03-004) had both hemorrhagic and ischemic components to her left-hemisphere damage, and one patient had extensive left perisylvian damage (posterior>anterior) and a partial resection of the left parietal lobe after a left-sided intracerebral hemorrhage. Figure 1 shows eight axial and six sagittal T1-weighted MRI slices for each subject, with the caption describing each patient’s lesion in detail. It is worth noting here that the moderately impaired patients had lesions largely centered in anterior cortex, but the profoundly impaired patients had posterior lesions extending into anterior cortex or white matter. All subjects had right hemiparesis; three (02-030, 03-031, 03-004) were described as having minimal or no movement of the right hand.
Figure 1.
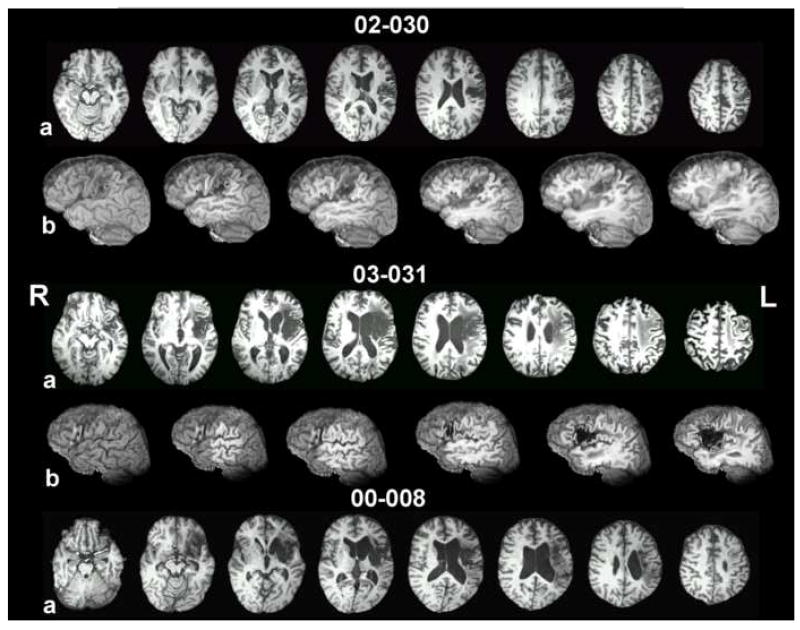

Axial slices and left-hemisphere sagittal cuts from T1-weighted MRI images, after deformation to the Talairach atlas. For each subject, the top row of images (a) contains eight 1mm-thick axial slices with a separation of 8mm from center to center. Images proceed from inferior on the left side to superior on the right side. Axial coordinates vary from patient to patient to best illustrate their lesion. The bottom row of images for each subject (b) shows a lateral view of the left hemisphere from a whole brain image (left-most image), with each successive image from left to right incrementally cutting away 5 mm in the sagittal plane. The purpose of the images is to demonstrate damage to left perisylvian regions, including cortex within sulci and underlying white matter. 02-030’s lesion, at 8 months post-stroke, occupies the inferior two thirds of the left sensory-motor region, extending forward inferiorly to encompass pars opercularis and especially its underlying white matter and undercutting white matter for premotor cortex above the inferior frontal gyrus and in the posterior half of the middle frontal gyrus. Medially, the lesion damaged most of the insula, but left the basal ganglia and thalamus are virtually untouched. 03-031’s lesion, at 83 months post-stroke, is primarily subcortical. It centers on the insula, extending laterally to encompass white matter underlying the operculum and extending medially to border of the lateral ventricle (sparing most of the medial subcallosal fasciculus deep to Broca’s area, but including periventricular white matter deep to sensorimotor cortex area for mouth, at body of the lateral ventricle). Most of the basal ganglia are subsumed by the lesion, but most of the head of the caudate nucleus and the posterior and the superior thalamus are largely intact. White matter underlying the entire frontal lobe and the inferior parietal lobule (deep to the angular and supramarginal gyri), and the superior temporal lobe are compromised. There is also some high, fronto-parietal supraventricular white matter damage. There is small degree of white matter compromise in portions of the superior temporal lobe. 00-008 (48 months post-stroke) has a large subcortical lesion with some cortical compromise. The lesion damaged white matter underlying pars opercularis, but also to some degree beneath pars orbitalis and pars triangularis. Patchy lesion is present in the medial subcallosal fasciculus, antero-lateral to the left frontal horn (deep to Broca’s area). White matter beneath both the inferior parietal lobule and to some degree in the superior temporal lobe is compromised. Medially, the lesion destroyed the insula and basal ganglia. Portions of the thalamus were spared. Wernicke’s area (region of the posterior, superior temporal gyrus) is largely spared. 02-036’s lesion, at15 months post-stroke, destroyed the posterior two thirds of the temporal lobe, including all of Wernicke’s area, sparing only the anterior temporal lobe and those medial structures supplied by the PCA. The entire inferior parietal lobule, most of the superior parietal lobule, and the entire lateral occipital cortex were damaged. Lesion is present in the posterior thalamus, including the pulvinar. The lesion extends minimally into pars opercularis and its underlying white matter. The lesion impinges on the posterior putamen and caudate tail, but the basal ganglia and thalamus are otherwise spared. At the level of the body of the lateral ventricle, lesion of the sensorimotor cortex (most likely at the level of the mouth representation) extends toward the periventricular white matter. The extent of lesion in periventricular white matter adjacent to the body of the lateral ventricle is difficult to assess, however, due to large ventricular dilation in the body of the lateral ventricle, especially in the posterior portion. The deep white matter lesion, immediately posterolateral to the body of the lateral ventricle likely interrupts posterior interhemispheric connections, including auditory pathways which may in part account for the patient’s poor auditory comprehension. 03-004 had two lesions. The anterior, subcortical component of hemorrhagic origin is centered in the putamen, with a posterior white matter extension that may interrupt auditory geniculocortical fibers in the region of the temporal isthmus. The posterior, ischemic component in the area of the supramarginal gyrus extends medially and variably to the posterolateral body of the lateral ventricle. The location of the medial extension, in combination with the temporal isthmus lesion, may account for the auditory comprehension deficit.
Age-matched controls
Five neurologically normal controls (3 females), who performed the same word generation paradigm during a separate fMRI study, were selected to match the participants with aphasia for age, education, and gender. Demographic data for controls are presented at the bottom of Table 1. Mean age was 57.6 years (SD = 14.88); age for controls varied between 42 and 74 years. Mean age for controls did not significantly differ from the mean age of aphasia participants t(8) = 0.31, p > .05. Mean education for controls was 14.2 years (SD = 3.63) ; education varied between 9 and 18 years. Mean education of controls did not differ from that of aphasia participants t(8) = 0.00, p > .05. The gender distribution of the control and aphasia groups was identical. All controls were right handed.
Written informed consent was obtained from each participant for treatment (participants with aphasia only) and fMRI, separately prior to the study, according to procedures established by University of Florida Institutional Review Board, and research was completed in accordance with guidelines of the Helsinki Declaration.
Intention Treatment
Intention treatment
Participants with aphasia were part of a larger study of the intention treatment (Crosson et al., 2007b). In addition to the intention treatment, participants received a comparison attention treatment. Because this paper deals only with fMRI scans from immediately pre- and post-intention treatment, the attention comparison treatment will not be described further. During the intention treatment, patients initiated picture-naming trials and correction procedures, when necessary, with a complex left-hand movement. A complex (multistage) movement was selected because such movements engage pre-SMA, the medial frontal area most important in word generation (Picard & Strick, 1996). Treatment was administered in three phases of 10 treatment sessions each. Treatment sessions were conducted daily, five days per weeks for six weeks.
During phase 1, patients sat directly in front of a computer monitor. The therapist sat behind and to the patient’s left. A flashing star (1 X 1 inch) appeared at the center of the monitor and a 1,000 Hz tone sounded. To present a picture, patients used their left hand to lift the lid on a box located to their left and to press a specific button on a device within the box. The button press caused the tone and star to disappear, and after two seconds, a black and white line drawing appeared at the center of the monitor. Patients had 20 seconds to name the picture. If they gave a correct response, they proceeded to the next trial. If not, the therapist provided the correct name while making a non-meaningful circular left-hand gesture. The subject repeated the correct name aloud while making this gesture. Up to three correction attempts were allowed. The same set of 50 pictures was used throughout this phase.
During phase 2, the patient and therapist were positioned similarly to phase 1. The flashing star appeared on the monitor cuing the patient to initiate trials with the complex left-hand movement, but the tone was eliminated from the cue. The patient trained on a different set of 50 line drawings from phase 1. Otherwise, the trial structure for phase 2 was similar to that of phase 1.
During phase 3, the patient and therapist were positioned as in previous phases. In this phase when patients saw the flashing star, they performed a non-meaningful circular left-hand gesture. The therapist initiated picture presentation once the patient repeated this gesture three times. The subject was trained on 50 line drawings different from those used in other phases. The rationale for introducing the gesture to initiate naming trials was that the patient could use it outside of the therapy session to assist word retrieval. Other aspects of phase 3 picture-naming trials were similar to those of phases 1 and 2.
Treatment Stimuli
Three sets of 50 black and white line drawings (total=150), 10.2 cm X 10.2 cm were used for naming trials. A different set was used for each treatment phase. For patients with profound word-finding impairments (02-036, 03-004), each picture set contained 15 high-frequency (>21 occurrences/million; Francis & Kucera, 1982), 15 medium-frequency (4-20 occurrences/million), and 20 low-frequency (<3 occurrences/million) items. Since patients with moderate word-finding impairments (02-030, 03-031, 00-008) scored too close to ceiling to use such picture sets, all 50 pictures from each of the three sets used for their treatment consisted only of low frequency items. Each set of items for both levels of word-finding impairments contained pictures of 9 living and 41 nonliving objects.
Daily probe stimuli
During baseline sessions before treatment and prior to each treatment session, patients performed a naming task to establish pre-treatment baseline performance and to monitor treatment progress, respectively. During probes, patients sat directly in front of the computer monitor and attempted to name the line drawing within 20 sec. No treatment manipulation was applied, and no feedback regarding response accuracy was given. Each naming probe set contained 40 black and white line drawings, 10 pictures from each of the treatment phases and 10 pictures not trained during any treatment phase. For patients with profound impairment, each probe set contained 12 high frequency, 12 medium frequency, and 16 low frequency words, paralleling the frequency distribution of treatment sets. For patients with moderate word-finding impairments, probe sets consisted of 40 low frequency words. Each probe set had similar proportions of living and nonliving items to the treatment sets.
Treatment procedures
Before starting treatment, each patient had to demonstrate eight consecutive baseline sessions with no significant upward trend as ascertained by the C statistic (Tryon, 1982). Probe and treatment sessions were given daily, five days per week. Treatments were administered in a cross-over design, with at least one month between treatments. The intention treatment was given first to three patients (02-030, 00-008, 02-036), and the attention treatment was given first to two patients (03-031, 03-004). Three methods developed to evaluate AB treatment designs were employed to evaluate progress on daily probe stimuli:
The C statistic (Tryon, 1982) was used to establish that there was no significant upward trend in baseline performance (percent correct responses) for eight consecutive baseline sessions before treatment was begun. If there was a significant upward trend in the data in accordance with the C statistic, additional baseline sessions were given until no significant upward trend existed. Because daily probes were administered immediately before daily treatment sessions, the probes given before the first treatment session constituted a ninth baseline session, and the C statistic was calculated again to ensure that all nine points represented a stable baseline. The baseline Z scores derived from the C statistics varied between -0.34 to 0.77; a significant Z score at p < .05 requires that Z ≥ 1.64. Hence, no baseline was close to demonstrating a significant upward trend. After treatment, the entire time series (baseline and treatment probes) for each patient was tested to determine if there was a significant upward trend in treatment, in accordance with procedures described by Tryon (1982).
The C statistic can be sensitive to changes of a single time point near the end of a time series if the variability between sessions is small. Hence, we calculated effect sizes consisting of the mean percent correct for phase 3 minus the the mean percent correct for baseline (nine points) and dividing this difference by the SD of baseline performance. Based on Student’s t distribution, an effect size of 2.31 was considered significant at the .05 level of probability, and an effect size of 3.36 was considered significant at the .01.
Because the C-statistic can be sensitive to patterns in time series other than shifts in level and slope from baseline (Gorman and Allison, 1996), a test specific to changes from baseline trends was needed. Hence, a modification of the conservative dual criteria (CDC) test (Fisher et al., 2003) was used to determine if changes during treatment were significantly above the trend projected from baseline. For the CDC, a line is drawn through the mean baseline score + .25 SD. Further, a trend line (least squares) is drawn through the baseline data and .25 SD is added to that trendline. The number of points during treatment that must be above each line for a predetermined significance level is determined using the binomial distribution, assuming that any point is equally likely to be above the line or on or below it. However, such trend lines can be extremely vulnerable to small fluctuations at the beginning or end of baseline, and the CDC was not designed for situations in which there is a learning curve. Hence, the following modifications were made to the CDC: (a) Only points during phase 3 were tested when all three sets of trained stimuli had been trained or were being trained, maximizing learning effects. (b) When the first point or two in baseline was below other baseline points, both the linear trend line and a negatively accelerating trend line (natural log) were calculated, and whichever trend line accounted for the most variance in its least squares solution was used. For the modified CDC we assumed that all baseline points that were taken would give us the most reliable trend lines. (More than eight baseline sessions were necessary in only one patient to establish a stable baseline, as described above.) It was not unusual for some patients in our larger series (Crosson et al., 2007) to demonstrate a small number of increasing baseline sessions before demonstrating a stable baseline. (c) When the last point or two of baseline was either above or below the other baseline sessions, it could have a strong influence on the slope of the trend line. In such cases, the probes preceding the next two treatment sessions were added to the nine baseline points to establish the trend line. If the last baseline point or two were outliers, the additional points would regress back toward the mean because little learning had occurred. However, if the last baseline point(s) were not outliers, then the upward trend would become obvious. 1
fMRI
Word generation task
To image word production, patients participated in a category-member generation task during pre- and post-treatment fMRI sessions. To begin a trial, patients heard a single category (e.g., “birds”) and attempted to generate aloud a single category member (e.g., “eagle”). Category-member generation was chosen as the experimental task over simple object naming because of the importance of medial frontal activity in the conceptual model of treatment and because previous research showed that medial frontal activity was more robust during category-member generation (Crosson et al., 2001). Based on the concept that the intention treatment would re-lateralize word production in general, we assumed that generalization would exist between the picture-naming task on which patients were trained during treatment and the category-member generation task used for fMRI. Patients were instructed at all times to look at a fixation cross outside the scanner (through the mirror attached to the head coil) and not to think of any words to themselves between trials. A minimally active baseline task (visual fixation) was chosen to optimize identification of language-related activity (Newman et al., 2001).
Length of trials and intertrial intervals were designed to avoid contaminating hemodynamic responses with head motion from spoken responses in subsequent trials, limiting motion artifacts to the initial portion of the hemodynamic response (Crosson et al., 2007a). For all subjects, five experimental runs of 9 trials each were given. For patients with nonfluent aphasia, trials were 9.96 sec (6 images) in length to allow patients adequate time to generate a response. Intertrial intervals (ITIs) varied in length to facilitate data analysis using AFNI’s (Cox, 1996) deconvolution option. One ITI was 14.94 sec (9 images) in length, three were 16.60 sec (10 images), two were 18.26 sec (11 images), and two were 19.92 sec (12 images). These ITI lengths were placed between trials in a pseudorandom fashion. Intervals before the first trial and after the last trial were 18.26 sec (11 images).
Because normal controls responded rapidly and accurately and because pilot data suggested they had slightly shorter hemodynamic responses, their trial lengths were shorter and the intertrial intervals were shortened slightly. Trial length was 4.98 sec (3 images). One ITI was 11.62 sec (7 images) in length, three were 13.28 sec (8 images), two were 14.94 sec (9 images), and two were 16.60 sec (10 images). The intervals before the first trial and after the last trial were 13.28 sec (8 images). For all participants, stimuli were played from a CD with volume determined individually for maximum comfort level via a Commander XG Audio System (Resonance Technology, Inc.). Patient responses were recorded onto a laptop computer (Gateway) hard drive using Cool-Edit software (Syntrillium Software). Responses were scored for accuracy off-line, and the onset time of each response was recorded for use in image analysis.
Image Acquisition
For three participants with nonfluent aphasia (02-030, 00-008, 02-036) and for normal controls, fMRI data were acquired with a 3T Signa LX scanner (General Electric) with a dome-shaped quadrature radio frequency coil (InVivo). Thirty-two contiguous sagittal slices covering the whole brain were acquired using a 1-shot spiral sequence (1660ms TR; 18ms TE; 70 degree flip angle; 64 × 64 matrix; 200mm FOV; 4mm thickness). An additional 6 images (9.96s) were added to the beginning of the run to allow MR signal to reach equilibrium. Anatomic images were obtained using a T1-weighted spoiled GRASS sequence (23ms TR; 6ms TE; 25 degree flip angle; 256 × 192 matrix; 1.3mm thickness; 124 sagittal slices, 240mm FOV). For two participants (03-031, 03-004), images were acquired on a 3 T Allegra scanner (Siemens) with a standard head coil. Thirty-two continuous axial slices were acquired using a gradient echo echo planar sequence (1660ms TR; 25ms TE; 70 degree flip angle; 200mm FOV; matrix=64×64; 4mm thickness). Anatomic images were obtained using a T1-weighted MP-RAGE sequence (2000ms TR; 4.13ms TE; 8 degree flip angle; 256 × 192 matrix; 1.3mm thickness; 128 axial slices; 240mm FOV). In all cases, foam padding limited head motion during scanning.
Although collection of fMRI data on a larger sample of patients was planned, images for the intention treatment were not available in some patients due to poor quality images (n=3), illness (n=1), patient unavailability (n=1), equipment malfunction (n=1), or discomfort in the scanner (n=1). Of the remaining five patients on whom this study was conducted, images were not available for the attention treatment in three patients, due to equipment malfunction (n=2) and replacement of the scanner (n=1). Thus, fMRI data are presented only for the intention treatment.
Image Analysis
Image analysis was performed with AFNI (Cox, 1996) and programs developed in our laboratory. Using a 3-dimensional rigid body registration, functional images were aligned to a base image from the functional volume acquired closest in time to structural images. Linear trends in the time series of each run were removed, and five runs then were concatenated. Voxels in which the standard deviation exceeded mean signal intensity by more than 8% were excluded from the analysis to mitigate large vessel effects and other artifacts. To allow for maximum accuracy in localizing activity at boundaries between the regions of interest described below, no spatial smoothing was applied to images. AFNI’s deconvolution analysis (http://afni.nimh.nih.gov/afni/) was used to estimate average hemodynamic responses (HDRs) for all trials on which responses were made. The initial deconvolution was time locked to each image in which an overt spoken response began. All analyses for patients included the subsequent 26.5 sec of signal (16 images). Because hemodynamic response times for normal controls were shorter than those of patients, only 19.92 sec of signal (12 images) subsequent to spoken responses were deconvolved for controls. The deconvolution program produces an R2 statistic evaluating goodness of fit between the modeled hemodynamic responses in the temporal sequence of events and the acquired time series.
For all subjects, the time series in each voxel was corrected for residual motion artifacts using a refinement of the selective detrending procedure developed in our laboratory. In brief, this procedure (1) estimates residual-motion-related artifacts by selecting deconvolved responses (DRs) from several voxels outside the brain with high R2 values, and then (2) removes the artifact most highly correlated with each brain voxel’s time series when this correlation exceeds .50. (See Crosson et al. (2007a), Gopinath (2003), and Gopinath et al. (2009) for details.) For one patient’s (02-036’s) pre-treatment images, task-correlated artifacts had durations too long (15 – 20 sec) to be reduced by the selective detrending algorithm, so a second detrending technique was employed in addition to selective detrending. As in the former technique, voxels outside the brain significantly correlated with the task’s time vector were selected. Time series from 1,000 such non-brain voxels were averaged to estimate a time course for the task-related artifact in the MR signals. This estimated artifact time course was detrended separately for each task event from each brain voxel’s time series using linear regression (unconstrained least squares fits).
For all subjects, deconvolution analyses were subsequently repeated on the detrended time series, (1) time locked to the participants’ spoken responses (response-locked analysis), and (2) time locked to stimulus onset (stimulus-locked analysis). Then, for all subjects, voxels for a “union” image were populated with the higher of the R2 values from the response-locked and the stimulus-locked analyses. This procedure was used for two reasons. First, aphasia participants’ reaction times to speak category-member names were long and variable, so that the response time vector was not merely a shifted version of the stimulus time vector. Second, stimulus-locked and response-locked analyses can under these conditions bring out different patterns of activation reflecting different relative contributions of perceptual versus retrieval versus production aspects of the task (see Crosson et al., 2007a, for more detail). Although preliminary analyses from two of these patients (02-030, 00-008) were presented previously (Crosson et al., 2005), those preliminary analyses were conducted only on correct spoken responses and exclusively with a response-locked deconvolution. Thus, the current findings for these two subjects differ to some degree from the previously reported preliminary findings. Further, the inclusion of more patients in the current report allows for the use of group statistics for some analyses that could not be used in the preliminary report.
Prior to analysis of pre- and post-treatment data of participants with aphasia, images were equated for sensitivity to BOLD response across sessions on a voxel by voxel basis using an algorithm developed in our laboratory (Gopinath et al., 2005). In brief, this procedure used the residual variance from a second deconvolution analysis to estimate the noise structures of pre- and post-treatment images. Different known amounts of signal (i.e., simulated hemodynamic responses) were added to the noise bed for both image sets, and detection probability curves (fraction of voxels in the dataset activated as a function of R2) at each of the different levels of added signal, were generated for each dataset. These detection probability curves then were used to equate the pre-treatment and post-treatment R2 distributions for sensitivity (probability of correctly detecting simulated signals of known amplitudes). This procedure can compensate for differences in noise structure, hemodynamic responses, or numbers of responses between pre- and post-treatment fMRI scans.
After correction for motion-related artifacts and equating for sensitivity, images were resampled to 1 cubic mm resolution in Talairach coordinate space (Talairach & Tournoux, 1988). A statistical threshold of R2 > .20 (p < .000001, uncorrected) and a contiguity threshold of volume > 95 microliters were used jointly to select areas of activity for interpretation across all subjects so that the possibility of interpreting false positive responses was minimized. Anatomic localization was determined by visual inspection of images with occasional assistance of the Talairach atlas (Talaraich &Tournoux, 1988) to identify the appropriate landmarks. Two operators, trained in neuroanatomy and a localization algorithm, localized each significant cluster of activity. When disagreement between the raters existed regarding location of activity, the operators met to resolve differences. In instances where operators could not agree regarding location of a cluster, a third experienced investigator met with the operators to resolve the difference. Broad regions of interest (ROIs) were specified for further analysis and included: lateral frontal cortex, medial frontal cortex, and posterior perisylvian cortex. Lateral frontal cortex was defined as encompassing the inferior frontal gyrus, the middle frontal gyrus, the superior frontal gyrus up to but not including the point at which it transitions to the medial wall of the hemisphere, and the precentral gyrus including the anterior bank of the central sulcus. Medial frontal cortex included supracallosal elements anterior to motor cortex, including the portion of the superior frontal gyrus on the medial wall, the cingulate gyrus, and the paracingulate gyrus (when present). Posterior perisylvian cortex was defined as consisting of the angular gyrus, the supramarginal gyrus, the superior temporal gyrus, and the middle temporal gyrus. For each ROI, laterality indices were calculated based on the volume of significant activity for the ROI in the left and right hemispheres using the following formula:
It should be noted that a positive laterality index signifies greater left- than right-hemisphere activity for the ROI in question and that a negative laterality index signifies greater right- than left-hemisphere activity for the ROI.
RESULTS
Cognitive/Treatment Findings
Treatment response
Graphs of probes for baseline and treatment phases are presented in Figure 2, with the criterion lines for the modified CDC, as described above. The three measures of treatment gains are shown in Table 2. Four patients (02-030, 03-031, 00-008, 02-036) demonstrated significant treatment gains as determined by all three measures (C statistic, effect size, modified CDC). One patient (03-004) did not demonstrate significant gains on any measure. The patients who improved made variable gains in other areas as indicated by a significant increase in their WAB AQs (mean increase = 5.58, SD = 2.32, t = 4.81, df = 3, p < .05). Patient 03-004, who did not improve in treatment, showed a similar gain in AQ (6.9 points), but most of this gain was due to a large increase in comprehension. With respect to improvement during treatment, it should be noted that this small sample is representative of the larger sample from which these cases were drawn (Crosson et al., 2007b). Specifically, all three of the moderately impaired patients improved during treatment, compared to 89% of the moderately to severely impaired patients in the larger sample, and one of two profoundly impaired patients improved during treatment compared to 55% of the larger sample.
Figure 2.

Treatment response is shown for all five patients. Data points represent percent correct for daily probe items (see text for explanation of probes). Phases are color coded. Also represented are trend lines for baseline projected into treatment days (see text for details) and, for the modified Conservative Dual Criterion test (MCDC), a line indicating the mean baseline percent correct + .25 SD and the trend line + .25 SD for phase 3. The equations for the trend lines (linear or natural log) are included. Results of Tryon’s C statistic, effect size, and the mCDC are included in Table 2. All patients except for 03-004 showed a significant response to treatment by all three criteria; 03-004 did not show significant improvement by any of the criteria.
Table 2. Treatment Outcome and Regional Laterality Indices.
Laterality Index = (L volume − R volume) / (L volume + R volume) (Negative laterality index is right lateralized)
| Patient | Treatment | fMRI Category Member Generation | Lateral Frontal | Medial Frontal | Posterior Perisylvian | |||||||||||
|---|---|---|---|---|---|---|---|---|---|---|---|---|---|---|---|---|
| Z | Effect Size | mCDC | Pre Correct | Pre Total | Post Correct | Post Total | Pre LI | Post LI | Diff | Pre LI | Post LI | Diff | Pre LI | Post LI | Diff | |
| 02-030GE | 5.13** | 5.09** | 10 / 10** | 42 | 44 | 44 | 45 | -0.78 | -1.00 | -0.22 | -0.61 | 0.41 | 1.02 | -0.42 | 0.55 | 0.97 |
| 03-031SA | 4.45** | 3.33* | 9 / 9** | 18 | 43 | 24 | 36 | -1.00 | -1.00 | 0.00 | -1.00 | ---- | ---- | -0.16 | -0.01 | 0.15 |
| 00-008GE | 3.32** | 3.63** | 9 / 9** | 24 | 39 | 32 | 45 | 0.02 | -0.29 | -0.31 | 0.40 | 0.45 | 0.05 | 0.16 | 0.19 | 0.03 |
| 02-036GE | 4.90** | 6.96** | 10 /10** | 1 | 34 | 6 | 45 | -0.58 | -1.00 | -0.42 | 0.44 | ---- | ---- | -1.00 | ---- | ---- |
| 03-004SA | 0.13 | -0.48 | 0 / 10 | 11 | 35 | 14 | 34 | -0.18 | 0.39 | 0.57 | 0.40 | 0.80 | 0.40 | -1.00 | -0.89 | 0.11 |
GE = patients scanned on the GE Signa instrument; SA = patients scanned on the Siemens Allegra instrument. Z = Z-score derived from Tryon’s (1982) C statistic; Effect Size calculated from mean of phase 3 relative to the mean and SD of baseline; mCDC = current modification of Conservative Dual Criteria (Fisher et al., 2003)-number of points above both lines / number of points in phase 3. Pre Correct = number of correct responses to category member generation during fMRI pre-treatment; Pre-Total = total number of responses to category member generation during fMRI pre-treatment; Post Correct = number of correct responses to category member generation during fMRI post-treatment; Post-Total = total number of responses to category member generation during fMRI post-treatment. Pre LI = pre-treatment laterality index; Post LI = post-treatment laterality index; Diff = post-treatment laterality index minus pre-treatment laterality index.
p < .05;
p < .01.
Category member generation during fMRI
A category-member generation task was used for fMRI because it demonstrates medial frontal activity better than naming specific items (Crosson et al., 2001). The number of correct responses and the total number of trials on which a verbal response was given for both pre- and post-treatment fMRI are shown in Table 2. The assumption was made that treatment effects would generalize to this task from the picture-naming task used in treatment because relateralization of production mechanisms should not be limited to one task. In order to relate activity patterns from the fMRI scanning sessions to treatment responses, it was important to test this assumption. Thus, performance on the category-member generation task was compared from pre- to post- treatment using a one-tailed repeated measures t test. The four patients who improvement during treatment demonstrated a significant increase in accuracy of category-member generation from pre- to post-treatment fMRI scans (mean increase = 5.25%, SD = 2.5, t=4.20, df=3, p<.01), indicating that picture-naming treatment effects generalized to category-member generation.
Pre- and Post-Intention Treatment fMRI Findings
Figure 3 shows pre- and post-intention treatment whole-brain images for all five subjects. Image slabs were selected to best display frontal activity and, therefore, vary in axial boundaries within and between patients. Images were corrected for sensitivity between sessions within subject, but there is variability between patients in image sensitivity. However, the laterality indices used in analyses below put patient data into a comparable metric for which between-patient sensitivity differences are less of an issue. Also, it should be noted that a high statistical threshold (p < .000001, uncorrected) was chosen and applied to all images to reduce false positive activity, but in some cases, also may have reduced sensitivity to true activity. Further, no spatial smoothing was used on the current data to gain precision in anatomical localization at the boundaries of regions of interest. Images in the literature frequently have substantial spatial smoothing, which can act to increase the size of activity clusters as well as to distort cluster location relative to structural landmarks.
Figure 3.
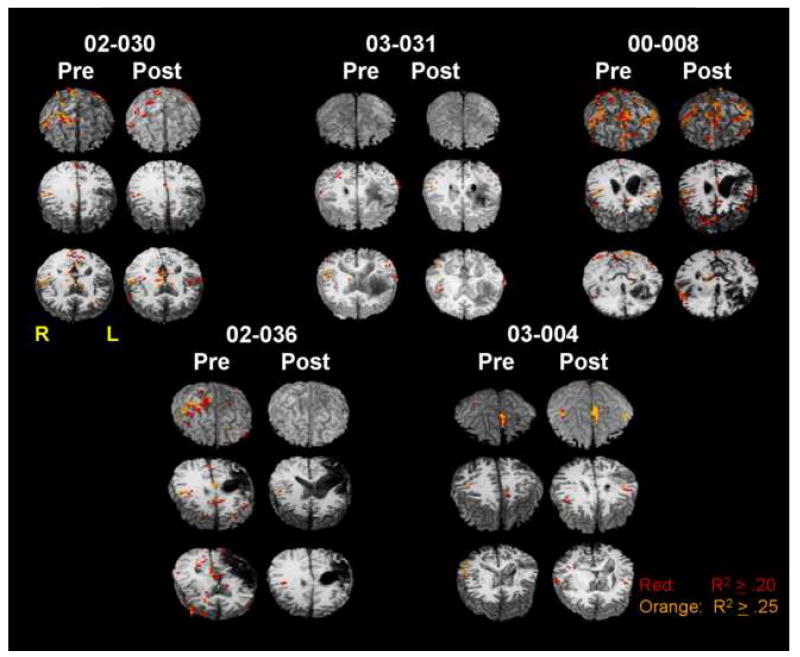
Pre- and post-intention treatment whole-brain images are shown for each of the five patients in the study. A conservative statistical threshold was used to ensure that false positive activity would be excluded. For purposes of anatomic localization of activity at the boundaries of regions of interest, no spatial smoothing was performed on images. For each image set, the frontal lobes are facing the viewer (thus, the left side of the image represents the right side of the brain), and the whole-brain image is sliced axially into three slabs and tilted toward the viewer to best visualize frontal activity in the axial cut. Slice levels may vary between pre- and post-treatment images of an individual patient dependent upon location of frontal activity.
Lateral frontal cortex
The main research question was whether a positive response to the intention treatment was accompanied by increased lateralization of lateral frontal activity to the right frontal lobe. Pre-treatment and post-treatment lateral frontal laterality indices, and the difference between these indices are shown in Table 2 under the “Lateral Frontal” heading. Under the main hypothesis for this study, it was expected that patients who showed significant improvement during the intention treatment would demonstrate a shift in fMRI lateral frontal laterality indices for category-member generation toward the right hemisphere from pre- to post-treatment. One way to approach the data is to assess the pattern of change in lateral frontal laterality indices relative to the pattern of therapeutic change. Specifically, what was the probability that the one patient who failed to improve during treatment would be the one and only of the five patients to show a leftward shift in lateral frontal laterality indices, as opposed demonstrating a rightward shift or no change? If these two possibilities are considered equally likely (i.e., a probability of .5 is assigned to each event), then the probability that 03-004 would be the only patient to show a leftward shift is .03.
The problem can also be approached parametrically. Because patients who improved in treatment were expected to show a rightward shift in laterality indices (directional hypothesis), a one-tailed t test was used to test the mean change in laterality indices from pre- to post-treatment for the 4 patients who did improve during treatment against a null hypothesis of no change in laterality. The 4 patients who improved in treatment showed a significant rightward shift in the lateral frontal laterality index when pre- and post treatment laterality indices were compared t = -2.674, df = 3, p <.05, as expected (mean post- minus pre-treatment laterality index = -0.238, SD = 0.178).
Also, it was hypothesized that patients who showed significant improvement during treatment would demonstrate greater right lateral frontal lateralization post- (but not pre-) treatment than the normal age-matched control group. Given the directionality of this hypothesis, one-tailed tests were used. Laterality indices for control subjects are shown in Table 3. Although the mean lateral frontal laterality index of the normal controls (mean laterality index = -0.150, SD = 0.260) was somewhat less right lateralized than that of patients prior to treatment (mean pre-treatment laterality index = -0.585, SD = .438), this difference was not significant, t = -1.37, df = 7, p > .05. However, the mean laterality index for lateral frontal cortex of nonfluent aphasia patients after treatment (mean post-treatment laterality index = -0.823, SD = 0.355) showed significantly greater right lateralization than did that of controls, t = -3.13, df = 7, p < .01. This significantly greater right lateralization for patients than controls after treatment can be attributed to the patients’ significant rightward shift in lateralization from pre- to post-treatment. It should be noted that at post-treatment, three of four patients who improved in treatment showed lateral frontal activity completely lateralized to the right hemisphere. No normal subject demonstrated complete lateralization of lateral frontal activity to the right hemisphere.
Table 3. Laterality Indices for Control Participants.
Laterality Index = (L volume – R volume) / (L volume + R volume)
| Control Participant | Lateral Frontal | Medial Frontal | Posterior Perisylvian |
|---|---|---|---|
| 02-C01 | 0.10 | 1.00 | 1.00 |
| 02-C02 | -0.21 | 0.21 | 0.03 |
| 02-C04 | 0.01 | -0.35 | 0.32 |
| 03-C12 | -0.10 | -1.00 | 1.00 |
| 03-C13 | -0.56 | 0.17 | -0.46 |
Finally, it was of interest to determine if the lateral frontal lateralization of the patient who failed to improve in treatment (03-004), either before or after treatment, was unique in comparison to the patients who improved or whether she demonstrated a different change in laterality than patients who improved in treatment. Thus, t tests were calculated to determine if the index/change in index for the patient who did not improve lay significantly outside the range of laterality indices/changes in indices for patients who did improve in treatment. Prior to the intention treatment, there was no significant difference between the lateral frontal laterality index for patient 03-004 (pre-treatment laterality index = -0.18) and the average pre-treatment lateral frontal laterality index for the patients who subsequently improved in the intention treatment (see mean and SD above), t = -0.925, df = 3, p > .05. However, at the end of the intention treatment, the laterality index of 03-004 (post-treatment laterality index = 0.39) was significantly different from the average post-treatment laterality index of the patients who did improved during treatment (see mean and SD above), t = -3.417, df = 3, p <.05. This finding reflects that the post-treatment lateral frontal activity of patients who improved during treatment was lateralized to the right hemisphere, but the lateral frontal activity of 03-004, who did not improve in treatment, was lateralized to the left hemisphere. Further, the change in laterality index from pre- to post-treatment for 03-004 (change in laterality index = 0.57) was significantly different from the average change in laterality index for the patients who did improve during treatment (mean change in laterality index = -0.238, SD = 0.178), t = 4.652, df = 3, p < .01. This finding reflects that patients who did improve during treatment showed a mean rightward change in the laterality index, while patient 03-004 showed a leftward change.
To summarize, a positive response to the intention treatment was associated with a rightward shift in lateral frontal activity, which was completely lateralized to the right hemisphere in 3 of the 4 patients whose naming improved by the post-treatment scans. Patients’ lateral frontal lateralization did not differ from that of controls before treatment; but after treatment, lateral frontal activity of patients who improved in treatment was significantly more right lateralized than that of controls. The lateral frontal laterality of the patient who did not improve in treatment was not significantly different from those who did improve for pre-treatment fMRI scans, but after treatment her lateral frontal activity was significantly more left lateralized than that of the patients who improved.
Medial frontal cortex
Another issue is whether a rightward shift in medial frontal lateralization was necessary for improvement in treatment or for a rightward shift in lateral frontal lateralization to occur. Pre-treatment and post-treatment medial frontal laterality indices, and the difference between these are shown in Table 2 under the “Medial Frontal” heading. Because two patients (03-031, 02-036) did not show significant medial frontal clusters during post-treatment fMRI, it was not possible to perform group statistical analyses to test this hypothesis. However, it is worth noting that one patient (02-030) who did improve during the intention treatment showed a large leftward shift in the medial frontal laterality index (post minus pre = 1.02), and a second patient (00-008) who improved during treatment showed virtually no change in the medial frontal laterality index (post minus pre = 0.05). Both of these patients showed a rightward shift in lateral frontal activity. These findings indicate that a rightward shift in medial frontal activity by post-treatment scans was not necessary either for patients to improve in treatment or for lateral frontal activity to shift rightward. It is also worth noting that the pre-treatment medial frontal laterality index for patients who improved in treatment (mean = -0.19, SD = 0.73) did not differ significantly from that of age-matched normal controls (mean = 0.01, SD = 0.74) t = -0.37, df = 7, p > .05.
Posterior perisylvian cortex
An important question is whether left posterior perisylvian cortex remains active after the intention treatment induces a rightward shift in lateral frontal activity during word production. Pre-treatment and post-treatment posterior perisylvian laterality indices for the nonfluent patients, and the difference between them, are shown in Table 2 under the “Posterior Perisylvian” heading. One patient (02-036) did not demonstrate significant posterior perisylvian activity at post-treatment fMRI; hence, group statistics were not applied to address this question. For the remaining four patients, including 03-004 who did not improve during treatment, there was either relatively stable posterior perisylvian laterality or a leftward shift in it. Patient 02-030, who showed a rightward shift in lateral frontal activity and improvement during treatment, also showed large leftward shifts in lateralization for both medial frontal and posterior perisylvian activity. Patients apparently maintain or even increase left posterior perisylvian laterality during word generation from pre- to post-treatment fMRI. Although the mean pre-treatment posterior perisylvian laterality index of patients who improved in treatment (mean = -0.36, SD = 0.49; right lateralized) differed in sign from the mean posterior perisylvian laterality index of aged matched normal controls (mean = 0.38, SD = 0.63; left lateralized), it should be noted that the these laterality indices were not significantly different from one another, t = -1.96, df = 7, p > .05. The lack of significance can be attributed to the relatively large standard deviation of both groups and the use of a two-tailed test because this analysis of pretreatment indices did not address one of our a priori hypotheses.
Focus and location of left lateral frontal activity
A final question is whether post-intention treatment activity would become more focused in specific structures (i.e., less diffuse) than pre-treatment activity. In particular, would activity in right lateral frontal cortex be confined to structures posterior to pars triangularis? To address potential increases in efficiency, a ratio of post-treatment lateral frontal activity volume to pre-treatment lateral frontal activity volume was created. A ratio less than one indicates smaller volumes of frontal activity post- than pre-treatment, and a ratio greater than one indicates larger volumes of frontal activity post- than pre-treatment. The first column under the respective hemispheres in Table 4 shows these frontal activity ratios. As there were some important differences between patients, these ratios are discussed at the individual subject level. Among the 3 patients who improved in treatment but whose frontal activity was not already completely right lateralized before treatment (02-030, 00-008, 02-036), all patients showed less left frontal activity post- than pre-treatment; indeed, two of these patients showed no left frontal activity post-treatment, as did the fourth patient who improved. Patient 03-004, who did not improve during treatment, had increased left frontal activity at post-treatment fMRI. Of the four patients who improved during treatment, three (02-030, 03-031, 02-036) showed a decrease in right frontal activity from pre- to post-treatment fMRI, in spite of the fact that two (02-030, 02-036) showed increased lateralization of frontal activity to the right hemisphere. This finding would be consistent with increased efficiency in utilizing right frontal activity as a result of treatment. However, patient 00-008, the fourth patient who improved in treatment, actually showed an increase in right lateral frontal activity at post-treatment fMRI. This patient also is the only patient who improved in treatment but did not show complete lateralization of lateral frontal activity to the right hemisphere post-treatment. He also had the lowest Z-score for treatment effect among the four patients who improved (Table 2, “Treatment” column).
Table 4.
Other Analyses: Frontal Activity Ratios and Percent of Activity in Motor Cortex
| Patient | Left Hemisphere | Right Hemisphere | ||||
|---|---|---|---|---|---|---|
| Frontal Post/Pre | Pre % Motor | Post % Motor | Frontal Post/Pre | Pre % Motor | Post % Motor | |
| 02-030 | 0.00 | 0.00 | ---- | 0.72 | 89.73 | 92.01 |
| 03-031 | ---- | ---- | ---- | 0.82 | 26.19 | 0.00 |
| 00-008 | 0.72 | 37.90 | 61.81 | 1.35 | 46.82 | 70.81 |
| 02-036 | 0.00 | 64.77 | ---- | 0.05 | 68.69 | 100.00 |
| 03-004 | 13.64 | 27.03 | 51.88 | 4.19 | 100.00 | 67.76 |
Regarding the possibility of increasing concentration of activity in posterior frontal cortex, the greatest concentration of activity in any one frontal area across subjects was in the motor and premotor cortex. Thus, the percentage of lateral frontal activity within each hemisphere that resided in motor/premotor cortex was measured both pre- and post-treatment for both hemispheres (Table 4). Again, data are addressed at the individual subject level. Three patients showed no left lateral frontal activity at post-treatment fMRI (02-030, 02-036, 03-031); hence, a change in percent of activity in motor/premotor cortex for the left hemisphere could not be calculated. For the remaining patient who improved in treatment (00-008), more activity was focused in left motor/premotor cortex post- than pre-treatment.
For the right hemisphere, three of the four patients who improved during treatment showed 70% or more of right lateral frontal activity localized to motor/premotor cortex by post-treatment fMRI. The patient (03-031), who improved in treatment but did not show any right motor/premotor activity at post-treatment fMRI, demonstrated all his activity in pars opercularis, just anterior to motor/premotor cortex but posterior to pars triangularis in the inferior frontal gyrus. Thus, for the patients who improved in treatment, activity was concentrated in the posterior portions of the right lateral frontal lobe after treatment. The patient (03-004) who did not show improvement from treatment also showed lateral frontal activity concentrated in right motor/premotor cortex, though she showed a decrease in the percent of frontal activity concentrated in right motor/premotor cortex from pre- to post-intention treatment. Unlike any other patient, she also showed large increases in lateral frontal activity bilaterally from pre- to post-treatment, suggesting that her activity became less focused or less efficient as a result of treatment.
DISCUSSION
Five patients with chronic nonfluent aphasia participated in functional MRI of category-member generation immediately before and after a treatment designed to shift word production from left to right frontal cortex using picture naming and an intention manipulation. The intention treatment involved initiating picture naming trials with a complex left-hand movement (opening a box and pushing the correct button on a device inside the box). This movement was easily performed by all subjects, requiring little or no learning. The movement was required to initiate picture-naming trials, and it required some attention to select the correct button to press. However, the movement did not require extended use of cognitive resources. This movement (opening the box and pressing the correct button with the left hand) was replaced by a nonsymbolic, left-hand gesture in Phase 3 of treatment and during correction procedures. It is worth noting that this treatment is different from both (a) constraint induced language therapy which prohibits gesture (e.g., Meinzer et al., 2005) and (b) treatments that use symbolic gesture paired with picture naming (e.g., Raymer et al., 2006). This intention treatment produces faster reacquisition of words than a comparable comparison treatment in moderately to severely impaired nonfluent patients (Crosson et al., 2007b), but a shift in frontal activity to the right hemisphere had previously been established only for a single subject (00-008) using only a response-locked analysis (Crosson et al., 2005). Hence, the main purpose of the current study was to determine whether frontal activity shifted rightward from pre- to post-treatment. Statistical thresholds for fMRI images were set high to reduce interpretation of false positives as activity, and spatial smoothing of images was avoided to maintain anatomical precision.
Even though patients who improved during treatment had moderate to large left-hemisphere lesions, their pre-treatment lateralization indices for the lateral frontal lobes, for the medial frontal lobes, and for the posterior perisylvian region did not differ significantly from those of neurologically normal age-, education-, and gender-matched controls in lateralization of activity. Thus, significant right-hemisphere activity on this task in patients with aphasia, particularly in the right frontal lobe, need not necessarily be interpreted as a result of left-hemisphere lesion and aphasia. Even though the role of this increased right-hemisphere activity in old adults is still under debate, right-hemisphere lesion rarely causes frank aphasia in right-handed persons. Hence, in neurologically normal controls, this right-hemisphere activity probably is not involved in basic language functions. It is possible that this conclusion applies to those of our patients with aphasia who did not show complete right-hemisphere lateralization of word production in the frontal lobes prior to the intention treatment. On the other hand, lateral frontal activity completely lateralized to the right frontal lobe provides strong evidence of right frontal participation in word production, since there is no left frontal activity to support it. None of our controls showed frontal activity completely lateralized to the right, which would be consistent with left-hemisphere participation in category-member generation for the controls. These conclusions should be borne in mind as we interpret the pre- to post-intention treatment comparisons for our nonfluent patients.
Four of the five chronically nonfluent patients improved during the intention treatment, and one did not. The central hypothesis was that patients who improved in treatment would demonstrate a shift in lateralization of lateral frontal activity toward the right hemisphere as a result of treatment. This hypothesis was confirmed. As a group, the four patients who improved in the intention treatment did demonstrate a significant shift in lateral frontal laterality indices for category-member generation toward the right hemisphere. Further, although the pre-treatment lateral frontal laterality indices of these patients did not differ from those of matched neurologically normal controls, by the end of treatment, patients demonstrated significantly greater right-hemisphere lateralization of lateral frontal activity than did controls. At the end of treatment, three of the four patients who improved in treatment showed total lateralization of lateral frontal activity to the right hemisphere. In contrast, no normal control demonstrated complete lateralization of frontal activity to the right hemisphere. Although the one patient who did not benefit from treatment did not differ in laterality from the other patients at pre-treatment scans, by the end of treatment, she demonstrated a leftward as opposed to a rightward shift in lateral frontal activity, resulting in a significantly greater leftward lateralization of her lateral frontal activity than in the 4 patients who improved. We note that the patient who did not improve and showed a leftward rather than a rightward shift in lateral frontal activity was profoundly impaired in naming. This finding is consistent with the study of 34 patients who received the intention treatment (Crosson et al., 2007) in that the profoundly impaired patients were less likely to improve than moderately to severely impaired patients. Possibly, more profoundly impaired patients are not good candidates for relateralization of language using the intention treatment.
Although it was not possible to conduct group statistics on laterality shifts in medial frontal or posterior perisylvian activity, two facets of laterality effects of the intention treatment became clear. First, a rightward shift in medial frontal activity was not a prerequisite either for improvement in treatment or for a rightward shift in the lateral frontal laterality index. One of the patients who demonstrated both improvement in treatment and a rightward shift in lateral frontal activity demonstrated a large leftward shift in medial frontal activity. Since this patient was the only patient to demonstrate a leftward shift in posterior perisylvian activity, it is possible that these two leftward shifts are functionally related.
The second additional facet of lateralization is that patients who improved in treatment do not show a shift in lateralization of posterior perisylvian activity toward the right hemisphere even though they do show such a shift in lateral frontal activity. Generally, the patients who improved in treatment demonstrated stable laterality or leftward shifts in posterior perisylvian activity. Of the three patients who improved and in whom posterior perisylvian activity could be measured at post-treatment fMRI, all maintained equal or greater amounts of left-hemisphere posterior perisylvian activity as compared to right-hemisphere posterior perisylvian activity. This is consistent with the conclusion drawn from a review of functional imaging of language in aphasia that both hemispheres are involved in recovery of language in aphasia patients (Crosson et al., 2007a). Hence, it may be necessary to maintain some repository of language code from the left hemisphere to leverage rehabilitation gains. Such a mechanism would be consistent with the fact that patients with more severe deficits are less likely to benefit from the intention treatment than more moderately impaired patients (Crosson et al., 2007b). We hypothesize that their language systems are more globally compromised, leaving less language code on which to build.
Thus, based on our data, it would be a mistake to conclude that the intention treatment causes wholesale shift in language functions toward the right hemisphere. Generally, in patients who improved in treatment, there was less frontal activity in both frontal lobes post- than pre-treatment, and the activity became increasingly concentrated in right motor/premotor cortex, or in right pars opercularis just anterior to motor/premotor cortex. This finding is consistent with Naeser et al.’s (2005) data indicating that using rTMS to reduce activity in right pars triangularis during naming is beneficial. Based on the preliminary data of these authors showing that rTMS of right pars opercularis hampered naming, it appears likely that suppression of right pars triangularis with 1 Hz rTMS permitted pars opercularis and nearby cortex to participate in word production free from any interference by activity from right pars triangularis. It is also important to note the continued or increased activity in left posterior perisylvian cortex in three of the four patients who improved during our treatment, suggesting that left- as well as right-hemisphere mechanisms were important for the treatment gains. It would be of interest to know how activity in right frontal and left posterior perisylvian cortex changes with the rTMS treatment of Naeser et al. (2005) and whether there are parallels in activity changes to the current treatment. The one patient who did improve in treatment but who did not show a reduction in right frontal activity after treatment (00-008) was the only patient who improved in treatment and did not show complete lateralization of lateral frontal activity to the right hemisphere by the end of treatment. Even with this post-treatment increase in right lateral frontal activity, this patient showed increased concentration of the lateral frontal activity in motor/premotor cortex.
Limitations of this study must be briefly addressed. First, the study involved a small number of participants. In particular, only one patient failed to improve in treatment, making it difficult to evaluate how typical her brain activity is for patients who fail to improve. Thus, the current data should be considered preliminary and caution is urged in generalizing to other samples. Future replication of the current findings or group studies of the phenomena would enhance confidence in generaliziation. Second, it is difficult to assess the effects of repeating the word generation paradigm in aphasic patients. Repeated practice of a word generation paradigm with the same items (nine times) in young normal subjects changes the topography of activity as responses become automatic (Petersen et al., 1998). Fundamental word-finding difficulties should prevent responses from becoming automatic in aphasia patients after a single repetition of the same items. Nonetheless, a control condition in which aphasia patients repeat the fMRI task without treatment or with a control condition would increase confidence in findings. Finally, the lack of a systematic rightward shift in medial frontal laterality from pre- to post-treatment calls into question whether medial frontal intention mechanisms mediate the shift in lateral frontal laterality, as originally hypothesized. Arbib (2006) suggested that human language functions evolved from frontal mirror neuron systems involved in hand movements. If such a linkage between hand movements and language exists, that linkage offers an alternative explanation for relateralization of lateral frontal activity instead of mediation of the change by medial frontal mechanisms.
To summarize, when the intention treatment was successful, activity post-treatment was concentrated in the posterior right frontal lobe and was reduced in other frontal areas of both hemispheres from pre-treatment scans, with three of the four successful patients showing no left frontal activity post-treatment. On the other hand, maintenance of left posterior perisylvian activity post-treatment may indicate that language code surviving in this region acts as a platform for relearning word production during the shift in lateral frontal activity. Continued studies will be necessary to replicate and extend current findings and to determine the mechanism leading to rightward shifts in frontal activity from the intention treatment. Finally, findings from this study, while preliminary, suggest that it may be possible to design behavioral treatments to engage specific neural mechanisms and, in parallel, to use fMRI to confirm whether the treatment successfully engages the desired mechanisms.
Acknowledgments
This research was supported by grants # P50 DC03888 and # R01 DC007387 from the National Institute on Deafness and Other Communication Disorders, by Center of Excellence grant # F2182C, Advanced Research Career Development Award # B3323K (Moore), Career Development Transition Award # B4954N (Moore), and Research Career Scientist Award # B3470S (Crosson) from the Department of Veterans Affairs Rehabilitation Research and Development Service, and by a grant from the Brooks Health Foundation.
Appendix A
WAB Subtest Scores.
| Patient | Spontaneous Speech |
WAB Comprehension |
WAB Repetition |
WAB Naming |
|||||||
|---|---|---|---|---|---|---|---|---|---|---|---|
| Info Content |
Fluency | Yes-No Questions |
Aud Word Recog |
Sequential Commands |
Repetition (Words & Phrases Items 1-9) |
Repetition (Sentences Items 10-15) |
Object Naming |
Word Fluency |
Sentence Completion |
Responsive Speech |
|
| 10 points Pre/Post |
10 points Pre/Post |
60 points Pre/Post |
60 points Pre/Post |
80 points Pre/Post |
34 points Pre/Post |
66 points Pre/Post |
60 points Pre/Post |
20 points Pre/Post |
10 points Pre/Post |
10 points Pre/Post |
|
| 02-030 | 9/9 | 5/6 | 60/60 | 60/60 | 76/67 | 32/34 | 54/56 | 57/60 | 6/9 | 10/8 | 10/10 |
|
| |||||||||||
| 03-031 | 8/9 | 5/6 | 60/60 | 60/60 | 34/42 | 34/34 | 18/40 | 60/60 | 5/4 | 10/10 | 10/10 |
|
| |||||||||||
| 00-008 | 8/7 | 8/8 | 57/57 | 54/59 | 72/80 | 34/34 | 46/56 | 54/55 | 0/12 | 10/10 | 10/8 |
|
| |||||||||||
| 02-036 | 3/3 | 1/2 | 49/51 | 37/36 | 12/24 | 24/20 | 2/10 | 14/23 | 2/1 | 6/6 | 0/2 |
|
| |||||||||||
| 03-004 | 4/5 | 2/2 | 48/50 | 39/44 | 18/46 | 16/24 | 16/12 | 7/5 | 2/5 | 6/4 | 2/6 |
Footnotes
It can also be argued that when trend lines account for less than 10% of the variance in baseline, a horizontal line through the mean is the best representation of the baseline trend. In this case, the trend line + .25 SD would be equivalent to the line representing the mean + .25 SD, the other criterion line for CDC.
Publisher's Disclaimer: This is a PDF file of an unedited manuscript that has been accepted for publication. As a service to our customers we are providing this early version of the manuscript. The manuscript will undergo copyediting, typesetting, and review of the resulting proof before it is published in its final citable form. Please note that during the production process errors may be discovered which could affect the content, and all legal disclaimers that apply to the journal pertain.
References
- Arbib M. Broca’s area in system perspective: Language in the context of action-oriented perception. In: Grodzinsky Y, Amunts K, editors. Broca’s Region. New York: Oxford University Press; 2006. pp. 153–168. [Google Scholar]
- Barlow T. On a case of double cerebral hemiplegia, with cerebral symmetrical lesions. British Medical Journal. 1877;2:103–104. doi: 10.1136/bmj.2.865.103. [DOI] [PMC free article] [PubMed] [Google Scholar]
- Basso A, Gardelli M, Grassi MP, Mariotti M. The role of the right hemisphere in recovery from aphasia. Two case studies. Cortex. 1989;25:555–566. doi: 10.1016/s0010-9452(89)80017-6. [DOI] [PubMed] [Google Scholar]
- Blank SC, Bird H, Turkheimer F, Wis RJS. Spech production after stroke: The role of the right pars opercularis. Annals of Neurology. 2003;54:310–320. doi: 10.1002/ana.10656. [DOI] [PubMed] [Google Scholar]
- Cabeza R. Hemispheric asymmetry reduction in older adults: The HAROLD model. Psychology and Aging. 2002;17:85–100. doi: 10.1037//0882-7974.17.1.85. [DOI] [PubMed] [Google Scholar]
- Calvert GA, Brammer MJ, Morris RG, Wiliams SCR, King N, Matthews PM. Using fMRI to study recovery from acquired dysphasia. Brain and Language. 2000;71:391–399. doi: 10.1006/brln.1999.2272. [DOI] [PubMed] [Google Scholar]
- Cao Y, Vikingstad EM, George KP, Johnson AF, Welch KMA. Cortical language activation in stroke patients recovering from aphasia with functional MRI. Stroke. 1999;30:2331–2340. doi: 10.1161/01.str.30.11.2331. [DOI] [PubMed] [Google Scholar]
- Coslett HB. Spatial influences on motor and language function. Neuropsychologia. 1999;37:695–706. doi: 10.1016/s0028-3932(98)00116-x. [DOI] [PubMed] [Google Scholar]
- Cox RW. AFNI: Software for analysis and visualization of functional magnetic resonance images. Computers in Biomedical Research. 1996;29:162–173. doi: 10.1006/cbmr.1996.0014. [DOI] [PubMed] [Google Scholar]
- Crosson B. Functional neuroimaging of impaired language: Aphasia. In: Hillary FG, DeLuca J, editors. Functional Neuroimaging in Impaired Populations. New York: Guilford; 2007. pp. 219–246. [Google Scholar]
- Crosson B, Bacon Moore A, Gopinath K, White KD, Wierenga CE, Gaiefsky ME, Fabrizio KR, Peck KK, Soltysik D, Milstead C, Briggs RW, Conway TW, Rothi LJG. Role of the Right and Left Hemispheres in Recovery of Function during Treatment of Intention in Aphasia. Journal of Cognitive Neuroscience. 2005;17:392–406. doi: 10.1162/0898929053279487. [DOI] [PubMed] [Google Scholar]
- Crosson B, Fabrizio KS, Singletary F, Cato MA, Wierenga CE, Parkinson RB, Sherod ME, Bacon Moore A, Ciampitti M, Holiway B, Leon S, Rodriguez A, Kendall DL, Levy IF, Gonzalez Rothi LJ. Treatment of Naming in Nonfluent Aphasia through Manipulation of Intention and Attention: A Phase 1 Comparison of Two Novel Treatments. Journal of the International Neuropsychological Society. 2007b;13:582–594. doi: 10.1017/S1355617707070737. [DOI] [PubMed] [Google Scholar]
- Crosson B, McGregor K, Gopinath KS, Conway TW, Benjamin M, Chang Y-L, Bacon Moore A, Raymer AM, Briggs RW, Sherod MG, Wierenga CE, White KD. Functional MRI of language in aphasia: A review of the literature and the methodological challenges. Neuropsychology Review. 2007a;17:157–177. doi: 10.1007/s11065-007-9024-z. [DOI] [PMC free article] [PubMed] [Google Scholar]
- Crosson B, Sadek JR, Maron L, Gökçay D, Mohr CM, Auerbach EJ, Freeman AJ, Leonard CM, Briggs RW. Relative Shift in Activity from Medial to Lateral Frontal Cortex during Internally versus Externally Guided Word Generation. Journal of Cognitive Neuroscience. 2001;13:272–283. doi: 10.1162/089892901564225. [DOI] [PubMed] [Google Scholar]
- Dobkin BH, Firestine A, West M, Saremi K, Woods R. Ankle dorsiflexion as an fMRI paradigm to assay motor control for walking during rehabilitation. NeuroImage. 2004;23:370–381. doi: 10.1016/j.neuroimage.2004.06.008. [DOI] [PMC free article] [PubMed] [Google Scholar]
- Fisher WW, Kelley ME, Lomas JE. Visual aids and structured criteria for improving visual inspection and interpretation of single-case designs. Journal of Applied Behavior Analysis. 2003;36:387–406. doi: 10.1901/jaba.2003.36-387. [DOI] [PMC free article] [PubMed] [Google Scholar]
- Gopinath KS. Doctoral dissertation. University of Florida; Gainesville, Florida: 2003. Reduction of noise associated with stimulus correlated motion in event related overt word generation paradigms. [Google Scholar]
- Gopinath K, Crosson B, McGregor K, Peck KK, Chang Y-L, Moore A, Sherod M, Cavanagh C, Wabnitz A, Wierenga C, White K, Cheshkova S, Krishnamurthy V, Briggs RW. Selective detrending method for reducing task-correlated motion artifact during speech in event-related FMRI. Human Brain Mapping. 2009;30:1105–1119. doi: 10.1002/hbm.20572. [DOI] [PMC free article] [PubMed] [Google Scholar]
- Gopinath K, Crosson B, Peck KK, Moore AB, White KD, Briggs RW. Detection Power Adjustment Method for Improved Comparisons between Multiple-Session Individual-Subject fMRI Scans. Proceedings of the International Society for Magnetic Resonance in Medicine. 2005;13:697. [Google Scholar]
- Gorman BS, Allison DB. Statistical alternatives for single-case designs. In: Franklin RD, Allison DB, Gorman BS, editors. Design and Analysis of Single-Case Research. Mahwaj, NJ: Lawrence Erlbaum Associates; 1996. pp. 159–214. [Google Scholar]
- Gowers WR. Lectures on the Diagnosis of Diseases of the Brain. London: Churchill; 1887. [Google Scholar]
- Kim Y-H, Ko M-H, Parrish TB, Kim H-G. Reorganization of cortical language areas in patients with aphasia: A functional MRI study. Yonsei Medical Journal. 2002;43:441–445. doi: 10.3349/ymj.2002.43.4.441. [DOI] [PubMed] [Google Scholar]
- Kinsbourne M. The minor cerebral hemisphere as a source of aphasic speech. Archives of Neurology. 1971;25:302–306. doi: 10.1001/archneur.1971.00490040028003. [DOI] [PubMed] [Google Scholar]
- Lazar RM, Marshall RS, Pile-Spellman J, Duong HC, Mohr JP, Young WL, Solomon RL, Perera GM, DeLaPaz RL. Interhemispheric transfer of language in patients with left frontal cerebral arteriovenous malformation. Neuropsychologia. 2000;38:1325–1332. doi: 10.1016/s0028-3932(00)00054-3. [DOI] [PubMed] [Google Scholar]
- Meinzer M, Djundja D, Barthel G, Elbert T, Rockstroh B. Long-term stability of improved language functions in chronic aphasia after constraint-induced aphasia therapy. Stroke. 2005;36:1462–6. doi: 10.1161/01.STR.0000169941.29831.2a. [DOI] [PubMed] [Google Scholar]
- Naeser MA, Martin PI, Nicholas M, Baker EH, Seekins H, Kobayashi M, Theoret H, Fregni F, Maria Tormos J, Kurland J, Doron KW, Pascual-Leone A. Improved picture naming in chronic aphasia after TMS to part of right Broca’s area: An open-protocol study. Brain and Language. 2005;93:95–105. doi: 10.1016/j.bandl.2004.08.004. [DOI] [PubMed] [Google Scholar]
- Newman SD, Twieg DB, Carpenter PA. Baseline conditions and subtractive logic in neuroimaging. Human Brain Mapping. 2001;14:228–235. doi: 10.1002/hbm.1055. [DOI] [PMC free article] [PubMed] [Google Scholar]
- Petersen S, van Mier H, Fiez JA, Raichle ME. The effects of practice on the functional anatomy of task performance. Proceedings of the National Academy of Science, USA. 1998;95:853–860. doi: 10.1073/pnas.95.3.853. [DOI] [PMC free article] [PubMed] [Google Scholar]
- Picard N, Strick PL. Motor areas of the medial wall: A review of their location and functional activation. Cerebral Cortex. 1996;6:42–353. doi: 10.1093/cercor/6.3.342. [DOI] [PubMed] [Google Scholar]
- Raymer AM, Singletary F, Rodriguez A, Ciampitti M, Heilman KM, Rothi LJ. Effects of gesture+verbal treatment for noun and verb retrieval in aphasia. Journal of the International Neuropsychological Society. 2006;12:867–82. doi: 10.1017/S1355617706061042. [DOI] [PubMed] [Google Scholar]
- Talaraich J, Tournoux P. 3-Dimensional Proportional System: An Approach to Cerebral Imaging. New York: Thieme Medical Publishers; 1988. Co-planar Stereotaxic Atlas of the Human Brain. [Google Scholar]
- Thulborn KR, Carpenter PA, Just MA. Plasticity of language-related brain function during recovery from stroke. Stroke. 1999;30:749–754. doi: 10.1161/01.str.30.4.749. [DOI] [PubMed] [Google Scholar]
- Tryon WW. A simplified time-series analysis for evaluating treatment interventions. Journal of Applied Behavioral Analysis. 1982;15:423–9. doi: 10.1901/jaba.1982.15-423. [DOI] [PMC free article] [PubMed] [Google Scholar]
- Weiller C, Isensee C, Rijntjes M, Huber W, Müller S, Bier D, Dutschka K, Woods RP, Noth J, Diener HC. Recovery from Wernicke’s aphasia: A positron emission tomographic study. Annals of Neurology. 1995;37:723–732. doi: 10.1002/ana.410370605. [DOI] [PubMed] [Google Scholar]
- Wierenga CE, Benjamin M, Gopinath K, Perlstein WM, Leonard CM, Rothi LJG, Conway T, Cato MA, Briggs RW, Crosson B. Age-related changes in word retrieval: Role of bilateral frontal and subcortical networks. Neurobiology of Aging. 2008;29:436–451. doi: 10.1016/j.neurobiolaging.2006.10.024. [DOI] [PubMed] [Google Scholar]