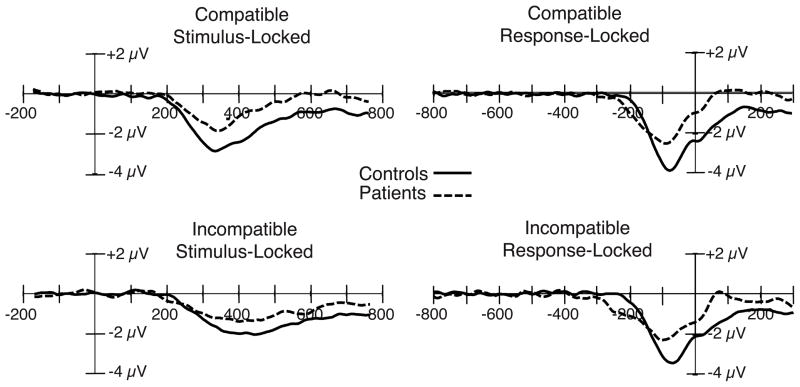
Figure 1.
Stimulus-locked (left) and response-locked (right) grand average ERP difference waveforms (contralateral-minus-ipsilateral) for the compatible and incompatible stimulus categories, collapsed across the C3 and C4 electrode sites, with patient and control waveforms overlaid. A digital low-pass filter was applied offline before plotting the waveforms shown here and in the subsequent figures (Gaussian impulse response function, half-amplitude cutoff = 23.2 Hz, full width at half maximum = 18.8 ms).

