

Abstract
Brownian dynamics (BD) in a suitably constructed potential of mean force is an efficient and accurate method for simulating ion transport through wide ion channels. Here, a web-based graphical user interface (GUI) is presented for grand canonical Monte Carlo (GCMC) BD simulations of channel proteins: http://www.charmm-gui.org/input/gcmcbd. The webserver is designed to help users avoid most of the technical difficulties and issues encountered in setting up and simulating complex pore systems. GCMC/BD simulation results for three proteins, the voltage dependent anion channel (VDAC), α-Hemolysin, and the protective antigen pore of the anthrax toxin (PA), are presented to illustrate system setup, input preparation, and typical output (conductance, ion density profile, ion selectivity, and ion asymmetry). Two models for the input diffusion constants for potassium and chloride ions in the pore are compared: scaling of the bulk diffusion constants by 0.5, as deduced from previous all-atom molecular dynamics simulations of VDAC; and a hydrodynamics based model (HD) of diffusion through a tube. The HD model yields excellent agreement with experimental conductances for VDAC and α-Hemolysin, while scaling bulk diffusion constants by 0.5 leads to underestimates of 10–20%. For PA, simulated ion conduction values overestimate experimental values by a factor of 1.5 to 7 (depending on His protonation state and the transmembrane potential), implying that the currently available computational model of this protein requires further structural refinement.
Keywords: GCMC/BD, Channel conductance, Ion selectivity, VDAC, α-Hemolysin, anthrax toxin protective antigen pore
INTRODUCTION
This manuscript describes the development and applications of a web interface to facilitate the production of grand canonical Monte Carlo/Brownian dynamics (GCMC/BD) simulations,1 an open-source coarse-grained simulation tool in studies of ion transport. Ion channels play a critical physiological role in metabolism and signaling of living cells,2 and their malfunction is associated with numerous diseases.3,4 Engineered ion channels show promise for nano-scale device applications including DNA sequencing and biochemical sensors.5–7
Within the wide range of hierarchical computational approaches,8–10 coarse-grained BD simulation11 lies between fully detailed all-atom molecular dynamics (MD) simulation with explicit solvent molecules, and continuum-based Poisson-Nernst-Planck (PNP) mean-field electrodiffusion theory. In a BD simulation, the trajectories of the ions are generated explicitly while the influence of the solvent is incorporated implicitly from a continuum dielectric model.12,13 Such an approach has a distinct advantage in the study of ion channels. First, it provides a more realistic representation than the mean-field PNP continuum model, which ignores the particle nature and the correlations of the diffusing ions. Second, it enables a more efficient steady-state simulation than all-atom MD simulation, which requires a considerable computational expense with present resources. There are, of course, many other applications of Brownian Dynamics.13 This paper, however, focuses on utility of BD for simulating ion channels.
The applicability of GCMC/BD has been validated from previous simulation studies for the outer membrane porin F (OmpF),14 α-Hemolysin (α-HL),15,16 and the voltage dependent anion channel (VDAC).17 The simulation results agree well with experimental data and other simulations, and have been analyzed to investigate the channel conductance, ion selectivity, and the underlying physical mechanisms of permeation. To facilitate the use of GCMC/BD in ion channel research, we have developed a web-based graphical user interface (GUI) to setup GCMC/BD simulations, http://www.charmm-gui.org/input/gcmcbd. Application of the GCMC/BD web-interface is illustrated using the simulation results of three β-barrel pores: VDAC, α-HL, and protective antigen pore of the anthrax toxin (PA). The simulations are based entirely on the input files generated by the interface.
The next section describes the theoretical background of GCMC/BD and its web interface implementation. This is followed by analysis of the simulations, including a comparison of the effects of different diffusion models for VDAC and α-HL.
METHODS
Theoretical background of GCMC/BD
Only the mobile ions are explicitly simulated in GCMC/BD, while the influence from the protein, lipid, and water is implicitly taken into account via effective time-invariant potential and dielectric maps.1 This approximation represents the solvent (water) region as an ion-accessible high dielectric medium and a source of random diffusive force. The lipid membrane is represented as an ion-inaccessible low dielectric medium. Finally, the channel protein is represented as a rigid ion-inaccessible low dielectric region of irregular shape containing a fixed distribution of partial atomic charges. The boundary of the irregular molecular pore region is constructed from the molecular structure of the channel protein. In biological systems, the protein channel usually provides the permeation pathway between the intra- and extra-cellular regions, and the bulk solutions away from the channel on both sides of the membrane have constant ionic concentrations. In addition, there can be a net potential difference across the membrane generated by the function of other channels and transporters in the living cell or by electrodes imposed in biophysical experiments. The boundary conditions consistent with the membrane potential and bulk ion concentrations are modeled using the GCMC algorithm in which the process of insertion and annihilation of ions is regulated according to thermodynamic probabilities.
Alternate approaches for simulating a reduced model of a transmembrane molecular pore with explicit mobile ions and continuum dielectric solvent include the dynamic lattice Monte Carlo dynamics of Graf et al.18 and the Boltzmann transport Monte Carlo simulation of Ravaioli and co-workers (BioMOCA).11 These methods are based on similar physical approximations to GCMC/BD. The GCMC/BD method differs from these methods in that it rigorously separates the electrostatic forces into static and reaction field contributions for enhanced computational efficiency, allows off-lattice dynamics of the explicit mobile ions, and imposes the proper thermodynamic boundary conditions on ion concentrations using a GCMC algorithm.1
Assuming that the dynamics of the mobile ions is overdamped due to high friction in solvent, the ion trajectory is generated via the BD equation,12,19
 |
(1) |
where rα denotes the position of an ion α,
 is the multi-ion potential of mean force (PMF), D is the diffusion constant, and ζ is the random Gaussian noise representing water collision to mobile ions. The forces acting on the mobile ions are calculated from the spatial gradient of the multi-ion PMF,
,
is the multi-ion potential of mean force (PMF), D is the diffusion constant, and ζ is the random Gaussian noise representing water collision to mobile ions. The forces acting on the mobile ions are calculated from the spatial gradient of the multi-ion PMF,
,
| (2) |
where φsf is the electrostatic potential from protein charges and transmembrane potential, φrf is the reaction field potential arising from the dielectric hetero-junction between solvent, protein, and lipid, Ucore is the core-repulsive steric potential from ion-inaccessible region (protein and lipid), and uαγ is the ion-ion potential including the dielectric-screened Coulombic electrostatic, Lennard-Jones, and water-mediated short-range terms.14 The ion-ion interactions are updated at every BD time-step while the other potential terms, Ucore, φsf, and φrf, are calculated from lookup tables computed before the GCMC/BD simulation.
Step-by-step illustration for the GCMC/BD web interface
While the GCMC/BD program is standalone and freely available, a web interface to generate the necessary input files is implemented in CHARMM-GUI,20 http://www.charmm-gui.org, in order to take advantage of various functional utilities in CHARMM-GUI. As shown in Fig. 1, the GCMC/BD module consists of five steps: STEP 1 for ion channel PDB structure file reading; STEP 2 for channel re-orientation (if necessary); STEP 3 for generation of atomic radii and charge maps of the protein; STEP 4 for calculations of look-up potential maps; and STEP 5 for GCMC/BD trajectory generation.
Figure 1.

Work flow of the GCMC/BD web interface, consisting of 5 steps for the preparation of GCMC/BD simulation.
STEP 1 reads in the ion channel PDB structure file either from the public-accessible databases such as RCSB Protein Data Bank21 (PDB, http://www.rcsb.org) and Orientations of Proteins in Membranes database22 (OPM, http://opm.phar.umich.edu), or from the user’s specification. STEP 2 manipulates the placement of the input PDB file in the membrane according to user-specified orientation (the Z-axis as the membrane normal by definition). STEP 3 generates the protein fixed charge map, atomic radii map, and Stern radii map, which are merged in the next step to calculate the potential map calculations in the next step. For example, the atomic radii and charge maps are used to calculate the electrostatic potential map by solving the Poisson-Boltzmann (PB) equation with appropriate dielectric boundary setup, and the Stern radii map is used to calculate the repulsive (steric) potential map to define the ion-accessible region in the system. STEP 4 calculates the grid-based potential maps PHIV (Ucore), PHIX (φsf), and RFPAR (φrf). The user can also specify bath concentration and transmembrane potential in this step. STEP 5 generates the input file for the GCMC/BD simulation. The user can specify the location of the constant concentration regions (buffer) and assign the space-dependent diffusion profile along the conducting direction (see the next section). The web interface executes input files and provides the corresponding outputs for the first three steps using CHARMM,23,24 while STEP 4 and STEP 5 must be performed on the user’s local computer. The source codes and the user manual for STEP 4 (PB/PNP) and STEP 5 (GCMC/BD) are also downloadable at the GCMC/BD web interface.
The main outputs from GCMC/BD simulations are the ionic currents and the time-averaged ion number profiles along Z. In addition, the user can produce ion coordinate files (CHARMM-format CRD) for ion trajectory analysis. The current-voltage (I-V) relation can be translated into channel conductance (G = I/V), and the current ratio between cation and anion can be computed to quantify ion selectivity. The average ion number profile at zero transmembrane potential (Vmp = 0) can be converted to the one-dimensional (1D) multi-ion PMF (
 ),17 which represents the mean potential acting on an ion along the channel axis (Z), including the contributions from protein-ion, ion-ion, and ion-solvent interactions, and the volume exclusion effect (i.e., variation in ion accessible cross-sectional area).
is expressed as
),17 which represents the mean potential acting on an ion along the channel axis (Z), including the contributions from protein-ion, ion-ion, and ion-solvent interactions, and the volume exclusion effect (i.e., variation in ion accessible cross-sectional area).
is expressed as
| (3) |
where α is the ion type and Cref is the arbitrary reference concentration that is set to the bulk concentration to make
 (Z) → 0 as |Z| → ∞.
The I-V curve from an asymmetric solution can be used for the calculation of ion selectivity by measuring the reversal potential (Vrev). The permeability ratio (p) for ion selectivity (anion over cation) can be calculated from Vrev using the Goldman-Hodgkin-Katz (GHK) current equation2:
| (4) |
By convention, the cis-side (top, Z > 0) corresponds to the extracellular region and the trans-side (bottom, Z < 0) to the intracellular region. The conversion of Vrev into p using the GHK current equation has been traditionally used for quantifying ion selectivity from experiments because it is experimentally impractical to separate each ion current from total current.
Diffusion Profile
The diffusion constant of mobile ions is an important physical parameter in Langevin or BD simulations; the ionic flux is proportional to the diffusion constant. While ion diffusion constants in bulk solution have been measured, there exists no generally accepted space-dependent diffusion constant model in the vicinity of or inside the pore. We have implemented/compared two types of space-dependent diffusion profiles. The first is based on MD simulations (single-valued inside the pore), and the second is the hydrodynamic (HD) model.25,26 The single-valued diffusion model assumes a uniform diffusion constant inside the pore that is connected to the bulk value using a switching function.14 The HD model is derived from the assumption of a rigid sphere moving through a rigid cylindrical pore. The Z-dependent diffusion constant is related to the bulk diffusion constant by the scale factor:
| (5) |
where β denotes the ratio between the ion radius and the pore radius (Rion/Rpore) at each value of Z. The scale factor decreases as the ionic radii increases. The Lennard-Jones radii were used as the ionic radii. In the GCMC/BD web interface (STEP 5), the user can assign the diffusion constant in the system using (i) the bulk value, (ii) the single-valued model inside the pore, (iii) the HD model, or (iv) a user-generated profile.
Three β-barrel pores and other physical parameters
To test the GCMC/BD web interface and illustrate its efficacy, we selected three β-barrel pores (VDAC, α-HL, and PA) and performed GCMC/BD simulations using the inputs from the web interface (Table 1 and Fig. 2); a brief introduction of each selected channel is provided in RESULTS AND DISCUSSION. Each channel was placed in a 30 Å-thick implicit lipid membrane, and 5 Å-thick top and bottom (constant concentration) buffer regions were located at 20 Å away from the protein in the Z direction. The relative dielectric constants for water, protein, and lipid were set to 80, 2, and 2, following the conventional values in the previous studies.14,17 The grid spacing for look-up potential maps (STEP 4: PHIV, PHIX, and RFPAR) was set to 0.5 Å.
Table 1.
Structural information of the selected β-barrel pores
| Channel | PDB | Pore size [Å] (outer radius) | Protein net charge* | System dimension [Å3] |
|---|---|---|---|---|
| hVDAC1 | 2JK4 | 18.5 | +5e | 80×80×95 |
| α-HL | 7AHL | 14.5 | +7e | 62×62×142 |
| φ | 1V36 | 13 | −70e (HSD) −21e (HSP) |
70×70×220 |
Using CHARMM PARAM27 force field38
Figure 2.

(A) Side and top views of the selected pore structures, hVDAC1, α-HL, and PA (the symmetric PROF model) and (B) their ion-accessible cross-sectional area (inverse) profiles along the Z-axis. The positions of Lys147’s in α-HL and Phe427’s in PA are also marked in (A) for their importance in the transport properties (see RESULTS AND DISCUSSION).
All GCMC/BD simulations were performed in KCl solution. The ionic radii were set to 1.57 Å (RK) and 2.02 Å (RCl) and their bulk diffusion constants (Dbulk) were set to 0.196 Å2/ps (K+) and 0.203 Å2/ps (Cl−).14 The previous diffusion constant calculations using MD simulations of OmpF27 and NMR hVDAC128 yielded D ≈ 0.5Dbulk in the pore region. Based on these studies, the single-valued diffusion model was set to D = 0.5Dbulk inside the pore (the 0.5Dbulk model). The 0.5Dbulk model assumes similar diffusion constants for K+ and Cl− because their bulk diffusion constants are nearly equal. However, in the HD model, the diffusion constant for K+ is larger than that for Cl− because RK < RCl. The impacts of the diffusion constant models were compared for VDAC and α-HL. As shown in Fig. 3, the HD model generally predicts larger diffusion constants (and therefore larger conductances) than the 0.5Dbulk model. It is also expected that the HD model slightly reduces the anion selectivity due to the larger K+ diffusion constant.
Figure 3.

Comparison of diffusion constant (diffusion scaling factor) profiles for the selected pores: (A) hVDAC1, (B) α-HL, and (C) PA using PDB and the symmetric PROF model. 0.5Dbulk and the HD models are compared for hVDAC1 and α-HL. Shaded area denotes the transmembrane region.
Single channel conductances were obtained under a symmetric solution of 1.0 M KCl with the transmembrane potentials of ±100 mV for VDAC and PA and ±150 mV for α-HL. Reversal potentials were calculated from I-V curves with a 5 mV bias step under 10-fold asymmetric KCl conditions for VDAC (Ccis:Ctrans = 0.1:1.0 or 1.0:0.1 M) and 5-fold KCl conditions for α-HL (Ccis:Ctrans = 0.2:1.0 or 1.0:0.2 M). Ten independent runs for each simulation condition were carried out to reduce the possible contribution from anomalous initial condition and obtain statistically well-converged results. Also, the simulation time was chosen to ensure sufficient number of ion crossing events (>100) for stable statistical analysis. Simulation condition and parameters are summarized in Table 2.
Table 2.
GCMC/BD simulation conditions
| Channel | Bath concentration [M] | Transmembrane potential§ [mV] | Diffusion model | Simulation time† [μs] | |
|---|---|---|---|---|---|
| hVDAC1 | Sym. | 1.0 | ±100 | 0.5Dbulk and HD | 0.25 |
| Asym* | 0.1:1.0/1.0:0.1 | −50~10/−10~50 | 1.25 | ||
| α-HL | Sym. | 1.0 | −150~150 | 1.00 | |
| Asym* | 0.2:1.0/1.0:0.2 | −50~10/−10~50 | 1.25 | ||
| PA | Sym. | 1.0 | ±100 | 0.5Dbulk | 1.00 |
Ccis:Ctrans
Transmembrane potential reference is the cis-side bath.
BD time-step is 10 fs.
RESULTS AND DISCUSSION
Voltage Dependent Anion Channel
VDAC provides a permeation pathway for metabolites and electrolytes between cell cytosol and the mitochondria. Among three isoforms found in many eukaryotic cells, the prototype isoform, VDAC1, shares a sequence identity up to 75% and the characteristic electrophysiological features.29 The reconstructed human VDAC1 (hVDAC1) consists of 19 β strands and bears positive net charge. The channel has been reported to be open and anion-selective when |Vmp| is low and becomes cation-selective with reduced conductance (half-open) when |Vmp| exceeds a threshold of ~30 mV. The measured open-state ion selectivity (anion over cation) ranges from 1.4 to 2.0 in terms of permeability ratio. We used the hVDAC1 structure from X-ray and NMR hybrid study (PDB:2JK4)30 in OPM,22 where hVDAC1 was oriented with N- and C-termini facing the cis side. Previously, we examined ion permeation mechanism and selectivity of NMR hVDAC1 (PDB:2K4T)31 using both MD28 and GCMC/BD17 simulations.
Table 3 summarizes the conduction properties obtained from the GCMC/BD simulations and Fig. 4A shows an ion trajectory snapshot for 1.0 M KCl solution. Fig. 5 shows the I-V curves for the asymmetric solution cases. The single channel conductances and anion selectivity are close to the experimental range, and similar to our NMR hVDAC1 study. Slightly different conductances between the two diffusion models (0.5Dbulk and HD) are observed. As expected from Fig. 3, BD simulations using the HD model resulted in larger conductances (~30%), better reflecting the experimental conductance range. Current asymmetries around Vmp = 0 mV are observed for both diffusion profile models. Compared to Vmp = +100 mV, ~20% and ~30% higher total conductance is observed at Vmp = −100 mV for the 0.5Dbulk model and the HD model, respectively. Negative Vmp also resulted in higher ionic conductance than positive Vmp of the same magnitude (Table 3). Similar current asymmetry was also reported in our previous studies on NMR hVDAC1 using both MD and GCMC/BD simulations.17,28
Table 3.
Ion conduction properties of hVDAC1: Conductance (G), ion selectivity from current ratio (GCl/GK), and current asymmetry (G−/G+)
| hVDAC1 | G [nS] | GCl/GK | G−/G+ (±100 mV) | |||
|---|---|---|---|---|---|---|
| −100 mV | +100 mV | −100 mV | +100 mV | |||
| 0.5Dbulk | Total | 3.77±0.11 | 3.15±0.09 | 1.92 | 1.94 | 1.20±0.07 |
| K+ | 1.29±0.05 | 1.07±0.08 | ||||
| Cl− | 2.48±0.12 | 2.08±0.12 | ||||
|
| ||||||
| HD | Total | 4.85±0.03 | 4.06±0.07 | 1.69 | 1.60 | 1.30±0.03 |
| K+ | 1.80±0.04 | 1.56±0.03 | ||||
| Cl− | 3.05±0.03 | 2.50±0.08 | ||||
|
| ||||||
| Exp.30 | Total | 3.9~4.5 | - | - | ||
Figure 4.

Snapshots of ion trajectories from the BD simulations of (A) hVDAC1, (B) α-HL, and (C) PA (PROF) bathed in 1.0 M KCl symmetric solutions.
Figure 5.

I-V curves for hVDAC1 in asymmetric 0.1:1.0 M (black) and 1.0:0.1 M (red) KCl solutions are compared between the 0.5Dbulk model (solid) and the HD model (dashed). The reversal potential is measured from the I-V curves to calculate the permeability ratio using the GHK current equation (Eq. 4).
The ion selectivity can be estimated from either the current ratio between anion and cation or the reversal potential (Eq. 4) in the form of permeability ratio (p). As shown in Table 4, the average current ratios are 1.65 (HD) and 1.93 (0.5Dbulk) and the permeability ratios are 1.81 (HD) and 1.96 (0.5Dbulk). These two measures of ion selectivity agree well with experimental ranges of 1.4–2.0.31,32 The ion selectivity measured from both the current ratio and the reversal potential using the HD model is slightly smaller than the selectivity calculated using the 0.5Dbulk model. This arises from the larger K+ diffusion constant in the HD model (Fig. 3) due to ion size difference in diffusion constant scaling factor calculation in Eq. 5. Regardless of the diffusion model, the direction of the bath asymmetry also affects the calculated ion selectivity. In the current protein orientation, systems bathed in 0.1:1.0 M KCl resulted in larger anion selectivity with about 10 mV difference in the calculated reversal potentials compared to those under inverted bath condition (selectivity asymmetry). This observation indeed echoes the aforementioned current asymmetry. In Ccis:Ctrans = 0.1:1.0 M, the higher concentration on the trans side drives both K+ and Cl− to the cis side through the channel. This is equivalent to K+ and Cl− movements from the trans to the cis side with a negative Vmp. In a given time interval with Vmp < 0, the number of Cl− (K+) going through the channel from the trans to the cis side is larger (smaller) than that with Vmp > 0, resulting in the elevated anion selectivity.
Table 4.
Reversal potential* (Vrev) and permeability ratio (p) of hVDAC1
| hVDAC1 | 0.1:1.0 M KCl | 1.0:0.1 M KCl | ||
|---|---|---|---|---|
| Vrev [mV] | p | Vrev [mV] | p | |
| 0.5Dbulk | −24.2±0.4 | 3.28 | 14.1±0.4 | 1.96 |
| HD | −20.1±0.6 | 2.65 | 12.4±0.2 | 1.81 |
| Exp.39 | - | 10.2±0.2 | 1.62 | |
An exponential curve fitting (V=(a + b)ecI − b; a, b, and c are fitting coefficients.) was used to calculate Vrev (coefficient a) and the standard error of Vrev from the I–V curve.
The present study shows that the NMR/X-ray hybrid hVDAC1 model also represents the anion-selective open-state, much like the NMR hVDAC1 model. In addition, the single channel conductance and the ion selectivity from GCMC/BD simulations are in good agreement with experimental measurements. It can be deduced from the current and selectivity asymmetries that the transport of Cl− (K+) from the trans (cis) to the cis (trans) side occurs at higher rate than that of opposite direction under current orientation of hVDAC1. The HD model better reproduces experimental conductance and selectivity than the 0.5Dbulk model.
α-Hemolysin
α-HL is a bacterial exotoxin protein involved in many diseases including urinary infection in human body.33 It makes a heptameric pore with a +7e net charge in the host cell membrane, and serves as draining hole of cell content, leading to irreversible cell content outflux and eventually cell lysis. Wildtype α-HL, as well as a modified structure with a molecular adaptor (covalently or non-covalently attached β-cyclodextrin) placed at the constriction region have been extensively studied using experiments5,34 and simulations.15,16,35,36 α-HL is mildly anion-selective and its conduction properties are known to be asymmetric around Vmp = 0, i.e., showing rectification effect. The protein structure (PDB:7AHL)33 used in the current simulations was also obtained from OPM.22
BD simulation results of α-HL are summarized in Table 5. Fig. 6 compares the I-V curves under symmetric and asymmetric solution conditions; an ion trajectory snapshot is shown in Fig. 4B. Similar to the hVDAC1 case, the HD model yielded slightly larger conductances than the 0.5Dbulk model. As the conductance is predominantly determined by the diffusion constant inside the narrow transmembrane region, the larger cross-section in the cap region has only a small effect on the total conductance level. There is current asymmetry under transmembrane potentials of different signs, but its extent is smaller than the experimental measurement as seen in Table 5. Compared with the 0.5Dbulk model, the HD diffusion model results in slightly smaller anion selectivity of the channel based on current ratio calculations, although the permeability ratios calculated from the reversal potentials are quite similar (Table 6 and Fig. 6B). In contrast to hVDAC1, the selectivity asymmetry of α-HL is not so prominent. This is likely related to the weak current asymmetry for the ionic currents.
Table 5.
Ion conduction properties of α-HL: Conductance (G), ion selectivity from current ratio (GCl/GK), and current asymmetry (G−/G+)
| α-HL | G [nS] | GCl/GK | G−/G+ | |||
|---|---|---|---|---|---|---|
| Vmp < 0 | Vmp > 0 | Vmp < 0 | Vmp > 0 | |||
| 0.5Dbulk | Total | 0.76±0.01 | 0.81±0.01 | 2.13±0.32 | 1.96±0.23 | 0.93±0.03 |
| K+ | 0.23±0.02 | 0.30±0.01 | ||||
| Cl− | 0.53±0.02 | 0.51±0.02 | ||||
|
| ||||||
| HD | Total | 0.87±0.01 | 0.97±0.02 | 2.01±0.24 | 1.67±0.23 | 0.89±0.03 |
| K+ | 0.29±0.02 | 0.38±0.02 | ||||
| Cl− | 0.58±0.02 | 0.58±0.02 | ||||
|
| ||||||
| Exp.5 | Total | 0.80±0.04 | 1.00±0.05 | - | 0.80 | |
Figure 6.

I-V curves for α-HL in (A) a symmetric 1.0 M KCl solution and (B) asymmetric 0.2:1.0 M (black) and 1.0:0.2 M (red) KCl solutions. Solid lines are for the 0.5Dbulk model and the dashed lines are for the HD model.
Table 6.
Reversal potential* (Vrev) and permeability ratio (p) of α-HL
| α-HL | 0.2:1.0 M KCl | 1.0:0.2 M KCl | ||
|---|---|---|---|---|
| Vrev [mV] | p | Vrev [mV] | p | |
| 0.5Dbulk | −13.4±0.6 | 2.23 | 12.9±0.7 | 2.16 |
| HD | −13.4±0.5 | 2.23 | 12.0±0.7 | 2.04 |
| Exp.32,40 | −3.7 | 1.24 | 9.2 | 1.72 |
An exponential curve fitting (V=(a + b)ecI − b; a, b, and c are fitting coefficients.) was used to calculate Vrev (coefficient a) and the standard error of Vrev from the I–V curve.
Fig. 7 compares the 1D multi-ion PMFs (Eq. 4) for K+ and Cl− under equilibrium condition. The PMF profile shows that the nature of α-HL anion selectivity mainly arises from the elevated K+ PMF barriers in 10 Å < Z < 40 Å, which corresponds to the narrowest constriction region (Z ≈ 32 Å, Fig. 2A). There are seven Lys147 residues forming a ring in this region, which may be responsible for the larger K+ barrier. Instead of adopting a symmetric bell shape, the K+ PMF barrier is asymmetric, possibly due to the presence of negatively charged Asp111 residues located above Lys147 (Z > 32 Å). Hence, the K+ PMF is asymmetric around its maximum at Z = 32 Å; the PMF drops more sharply in Z > 32 Å than in Z < 32 Å due to the screening from Asp111 as shown in Fig. 7. In addition, the anion selectivity is mainly the result of the positively charged constriction zone rather than the transmembrane pore region where the PMF barrier difference is small.
Figure 7.

1D multi-ion K+ and Cl− PMFs for α-HL in a symmetric 1.0 M KCl solution under equilibrium condition (Vmp = 0 mV). The maximum PMF barrier for K+ is found at Z = 32 Å in the cap region of α-HL. Shaded area denotes the transmembrane region.
The present study shows that reasonable diffusion profile models produce similar conduction properties in α-HL channels. The BD simulations using the GCMC/BD web interface successfully reproduced the previous BD simulation results15,16 and the results from both diffusion models are in line with the experimentally measured properties. In addition, the 1D multi-ion PMF profile reveals that the anion selectivity arises from the ring of positively charged residues (Lys147) in the constriction region. Again, the HD model shows better agreement with experimental measurement, however, the differences of conducting properties between the HD model and 0.5Dbulk model is smaller than in the hVDAC1 case. The smaller difference is due to the similarity in diffusion constant in the constriction region which determines the total conductance of the pore.
Protective Antigen Pore of Anthrax Toxin
Protective antigen of anthrax toxin (PA) makes a heptameric pore providing pathways for the lethal factor and the edema factor.37 Each monomer of the channel contains 7 His residues and the net charge of the channel can be either −70e with all unprotonated His (denoted by HSD) or −21e with all protonated His (HSP). Low pH condition used to enhance the pore formation in the experiment may protonate His near the trans-side bath, but the exact protonation state of each His is yet to be determined. Currently, only a computational model structure (PDB:1V36)38 has been reported. In this study, we used two model PA structures, the reported structure (hereinafter, PDB) and another model structure constructed by the 7-fold rotational symmetry. The sixth monomer in PDB:1V36 (PROF) was chosen to generate the symmetric model (hereinafter, PROF), based on the experimentally suggested hydrophobic Phe427 ring (φ-clamp) formation around the pore (Fig. 8). The φ-clamp is found in 80 Å < Z < 95 Å, which is near the junction between the narrow stem region and the wide cap region (Fig. 2A).
Figure 8.

Comparison of the Phe427 φ-clamp in PA: PDB:1V36 and the symmetric PROF model in 80 Å < Z < 95 Å (viewed from Z > 0).
When the 0.5Dbulk model is used (Fig. 3 and Table 7), the PA simulation results for both PDB (Fig. 4C for ion trajectory snapshot) and PROF show 1.5 to 7 times higher conductances than the experimental data,39 depending on His protonation state and Vmp. The HD model was not compared for PA as it would result in even larger conductance than the 0.5Dbulk model (Fig. 3C) due to its similar diffusion profile in the stem region and larger diffusion profile in the cap region. Interestingly, the current asymmetry (±100 mV) is very high compared to the other channel cases. The formation of the φ-clamp, similar to the ring of Lys147 in α-HL, greatly affects the total conductance as it acts as a steric bottleneck. As a result, the symmetric model structure (PROF) with an apparent φ-clamp results in smaller conductance than the original computational model (PDB:1V36).
Table 7.
Ion conduction properties of PA: Conductance (G), ion selectivity from current ratio (GCl/GK), and current asymmetry (G−/G+)
| PA | G [nS] | GK/GCl | G−/G+ | ||||
|---|---|---|---|---|---|---|---|
| −100 mV | +100 mV | −100 mV | +100 mV | ||||
| 1V36 | HSD | Total | 0.93±0.04 | 1.48±0.05 | 22.3 | 13.8 | 0.62 |
| K+ | 0.89±0.04 | 1.38±0.06 | |||||
| Cl− | 0.04±0.01 | 0.10±0.01 | |||||
|
| |||||||
| HSP | Total | 0.65±0.03 | 0.31±0.01 | 2.25 | 2.10 | 2.10 | |
| K+ | 0.45±0.03 | 0.21±0.01 | |||||
| Cl− | 0.20±0.01 | 0.10±0.01 | |||||
|
| |||||||
| PROF | HSD | Total | 0.66±0.02 | 1.17±0.03 | 21.0 | 12.0 | 0.56 |
| K+ | 0.63±0.03 | 1.08±0.04 | |||||
| Cl− | 0.03±0.01 | 0.09±0.01 | |||||
|
| |||||||
| HSP | Total | 0.49±0.02 | 0.38±0.01 | 2.50 | 3.75 | 1.29 | |
| K+ | 0.35±0.02 | 0.30±0.01 | |||||
| Cl− | 0.14±0.01 | 0.08±0.01 | |||||
|
| |||||||
| Exp.37,41 | Total | 0.17~0.20 | - | - | |||
The protonation state significantly affects the conduction properties, as shown in Table 7. When all His residues are protonated (HSP), the electrostatic potential energy well depth for K+ is greatly reduced (Fig. 9) and thus the K+ current is substantially decreased, compared to the unprotonated histidine model (HSD). However, the Cl− current with positive Vmp is relatively independent of the protonation states while in the negative Vmp, the increase in the Cl− current is drastic (Table 7). In contrast, the reduction in the K+ current is very large for positive Vmp compared to negative Vmp. The opposite reduction trends for the K+ and Cl− current result in greatly reduced current ratio between K+ and Cl− for HSP, which is also amplified for negative Vmp. The total current is smaller in the HSP case, resulting from the reduction of the K+ current, which is larger than the increase of the Cl− current (Table 7).
Figure 9.
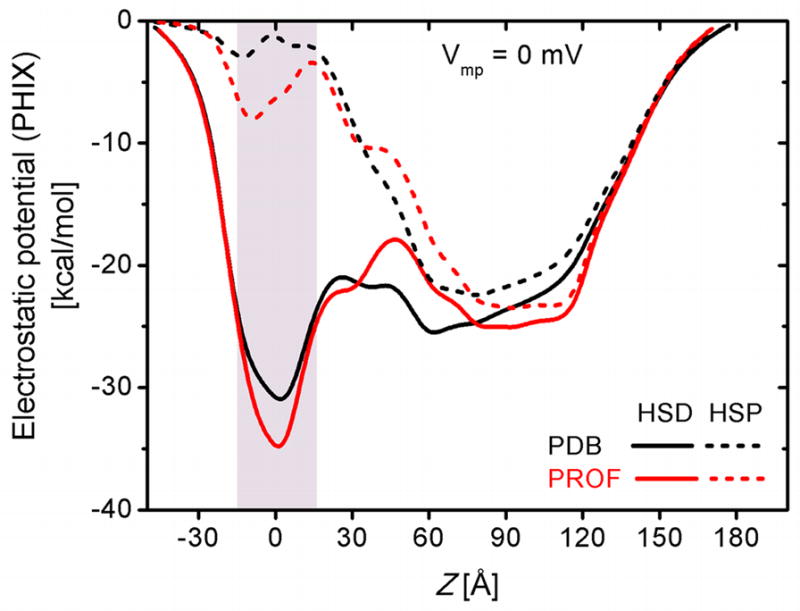
Comparison of electrostatic potential energy (PHIX) profiles along PA: PDB:1V36 (black) and the symmetric PROF model (red). The impact of His protonation (HSP, dashed) over unprotonated His (HSD, solid) is prominent at the transmembrane region (shaded area).
Because the calculated electrophysiological properties substantially deviate from available experimental data, the present study suggests that further structural refinement and determination of His protonation state are required for PA. Such structural refinement will facilitate the understanding of the channel conducting mechanism.
CONCLUSION
The GCMC/BD web interface provides the systematic system setup and input preparation for GCMC/BD ion transport simulations. GCMC/BD simulation enables examination of the channel conduction properties in a feasible simulation time because of its efficiency and robustness, as previously illustrated by comparative studies with MD simulations.14,17,28 Using the setup from the GCMC/BD web interface developed in the current study, we carried out GCMC/BD simulations for three selected β-barrel pores (hVDAC1, α-HL, and PA). The results from these simulations provide important physiological insights into the channels. They also offer directions for further studies in computational transport studies.
The GCMC/BD simulation results capture the important ion permeation properties such as channel conductance (Tables 3, 5, and 7) and ion selectivity (Figs. 5 and 6/Tables 4 and 6) observed in experimental studies. Also, the origin of selectivity can be explained using the structural information and the 1D multi-ion PMF using time-averaged ion density profile (Fig. 7). Comparison of conduction properties for three illustration examples shows the importance of diffusion constant model and structural information in GCMC/BD simulations. Generally, the HD model resulted in conductance and ion selectivity that show better agreements with experimental measurements than the single-valued effective diffusion profile (0.5Dbulk). Hence, the HD model represents the diffusion profile inside the pore more accurately by including the variation of pore size effect. Nevertheless, the 0.5Dbulk model is a reasonable approximation for pores of similar sizes to current studies. Finally, the GCMC/BD simulations of PA suggests that further structural refinement of the channel is required for proper analysis of the system, especially regarding the channel conformation at the constriction region and protonation states of His residues.
Acknowledgments
This work was supported in part by institutional funding from the University of Kansas General Research Fund allocation #2301388-003, Kansas-COBRE NIH P20 RR-17708, the National Science Foundation (NSF OCI-0503992) through TeraGrid resources provided by Purdue University (to W.I.), a research fellowship from the German Research Foundation (to B.E.), a NIH GM062342 grant (to B.R.), and the Intramural Research Program of the National Heart, Lung, and Blood Institute in the National Institutes of Health (to R.W.P).
References
- 1.Im W, Seefeld S, Roux B. Biophys J. 2000;79(2):788–801. doi: 10.1016/S0006-3495(00)76336-3. [DOI] [PMC free article] [PubMed] [Google Scholar]
- 2.Aidley DJ, Stanfield PR. Ion channels: molecules in action. Cambridge University Press; Cambridge; New York: 1996. [Google Scholar]
- 3.Bennett PB, Guthrie HRE. Trends Biotechnol. 2003;21(12):563–569. doi: 10.1016/j.tibtech.2003.09.014. [DOI] [PubMed] [Google Scholar]
- 4.Catterall WA. Neuron. 2010;67(6):915–928. doi: 10.1016/j.neuron.2010.08.021. [DOI] [PMC free article] [PubMed] [Google Scholar]
- 5.Wu HC, Astier Y, Maglia G, Mikhailova E, Bayley H. J Am Chem Soc. 2007;129(51):16142–16148. doi: 10.1021/ja0761840. [DOI] [PubMed] [Google Scholar]
- 6.Mathe J, Aksimentiev A, Nelson DR, Schulten K, Meller A. P Natl Acad Sci USA. 2005;102(35):12377–12382. doi: 10.1073/pnas.0502947102. [DOI] [PMC free article] [PubMed] [Google Scholar]
- 7.Robertson JWF, Rodrigues CG, Stanford VM, Rubinson KA, Krasilnikov OV, Kasianowicz JJ. P Natl Acad Sci USA. 2007;104(20):8207–8211. doi: 10.1073/pnas.0611085104. [DOI] [PMC free article] [PubMed] [Google Scholar]
- 8.Roux B, Allen T, Berneche S, Im W. Q Rev Biophys. 2004;37(1):15–103. doi: 10.1017/s0033583504003968. [DOI] [PubMed] [Google Scholar]
- 9.Chung SH, Corry B. Soft Matter. 2005;1(6):417–427. doi: 10.1039/b512455g. [DOI] [PubMed] [Google Scholar]
- 10.Kuyucak S, Andersen OS, Chung SH. Rep Prog Phys. 2001;64(11):1427–1472. [Google Scholar]
- 11.van der Straaten TA, Kathawala G, Trellakis A, Eisenberg RS, Ravaioli U. Mol Simulat. 2005;31(2–3):151–171. [Google Scholar]
- 12.Ermak DL, Mccammon JA. J Chem Phys. 1978;69(4):1352–1360. [Google Scholar]
- 13.Saxton MJ. Methods in Molecular Biology. 2007;400:295–321. doi: 10.1007/978-1-59745-519-0_20. [DOI] [PubMed] [Google Scholar]
- 14.Im W, Roux B. J Mol Biol. 2002;322(4):851–869. doi: 10.1016/s0022-2836(02)00778-7. [DOI] [PubMed] [Google Scholar]
- 15.Noskov SY, Im W, Roux B. Biophys J. 2004;87(4):2299–2309. doi: 10.1529/biophysj.104.044008. [DOI] [PMC free article] [PubMed] [Google Scholar]
- 16.Egwolf B, Luo Y, Walters DE, Roux B. J Phys Chem B. 2010;114(8):2901–2909. doi: 10.1021/jp906791b. [DOI] [PMC free article] [PubMed] [Google Scholar]
- 17.Lee KI, Rui HA, Pastor RW, Im W. Biophys J. 2011;100(3):611–619. doi: 10.1016/j.bpj.2010.12.3708. [DOI] [PMC free article] [PubMed] [Google Scholar]
- 18.Graf P, Kurnikova MG, Coalson RD, Nitzan A. J Phys Chem B. 2004;108(6):2006–2015. [Google Scholar]
- 19.Chandrasekhar S. Rev Mod Phys. 1943;15(1):0001–0089. [Google Scholar]
- 20.Jo S, Kim T, Iyer VG, Im W. J Comput Chem. 2008;29(11):1859–1865. doi: 10.1002/jcc.20945. [DOI] [PubMed] [Google Scholar]
- 21.Berman HM, Battistuz T, Bhat TN, Bluhm WF, Bourne PE, Burkhardt K, Iype L, Jain S, Fagan P, Marvin J, Padilla D, Ravichandran V, Schneider B, Thanki N, Weissig H, Westbrook JD, Zardecki C. Acta Crystallogr D. 2002;58:899–907. doi: 10.1107/s0907444902003451. [DOI] [PubMed] [Google Scholar]
- 22.Lomize MA, Lomize AL, Pogozheva ID, Mosberg HI. Bioinformatics. 2006;22(5):623–625. doi: 10.1093/bioinformatics/btk023. [DOI] [PubMed] [Google Scholar]
- 23.Brooks BR, Bruccoleri RE, Olafson BD, States DJ, Swaminathan S, Karplus M. J Comput Chem. 1983;4(2):187–217. [Google Scholar]
- 24.Brooks BR, Brooks CL, Mackerell AD, Nilsson L, Petrella RJ, Roux B, Won Y, Archontis G, Bartels C, Boresch S, Caflisch A, Caves L, Cui Q, Dinner AR, Feig M, Fischer S, Gao J, Hodoscek M, Im W, Kuczera K, Lazaridis T, Ma J, Ovchinnikov V, Paci E, Pastor RW, Post CB, Pu JZ, Schaefer M, Tidor B, Venable RM, Woodcock HL, Wu X, Yang W, York DM, Karplus M. J Comput Chem. 2009;30(10):1545–1614. doi: 10.1002/jcc.21287. [DOI] [PMC free article] [PubMed] [Google Scholar]
- 25.Paine PL, Scherr P. Biophys J. 1975;15(10):1087–1091. doi: 10.1016/S0006-3495(75)85884-X. [DOI] [PMC free article] [PubMed] [Google Scholar]
- 26.Haberman WL, Sayre RM. David Talor Model Basin. Department of the Navy; 1958. [Google Scholar]
- 27.Im W, Roux B. J Mol Biol. 2002;319(5):1177–1197. doi: 10.1016/S0022-2836(02)00380-7. [DOI] [PubMed] [Google Scholar]
- 28.Rui HA, Lee KI, Pastor RW, Im W. Biophys J. 2011;100(3):602–610. doi: 10.1016/j.bpj.2010.12.3711. [DOI] [PMC free article] [PubMed] [Google Scholar]
- 29.Colombini M. Adv Chem Ser. 1994;235:245–258. [Google Scholar]
- 30.Bayrhuber M, Meins T, Habeck M, Becker S, Giller K, Villinger S, Vonrhein C, Griesinger C, Zweckstetter M, Zeth K. P Natl Acad Sci USA. 2008;105(40):15370–15375. doi: 10.1073/pnas.0808115105. [DOI] [PMC free article] [PubMed] [Google Scholar]
- 31.Hiller S, Garces RG, Malia TJ, Orekhov VY, Colombini M, Wagner G. Science. 2008;321(5893):1206–1210. doi: 10.1126/science.1161302. [DOI] [PMC free article] [PubMed] [Google Scholar]
- 32.Colombini M. J Membrane Biol. 1989;111(2):103–111. doi: 10.1007/BF01871775. [DOI] [PubMed] [Google Scholar]
- 33.Song LZ, Hobaugh MR, Shustak C, Cheley S, Bayley H, Gouaux JE. Science. 1996;274(5294):1859–1866. doi: 10.1126/science.274.5294.1859. [DOI] [PubMed] [Google Scholar]
- 34.Gu LQ, Bayley H. Biophys J. 2001;80(1):494A–494A. [Google Scholar]
- 35.Aksimentiev A, Schulten K. Biophys J. 2005;88(6):3745–3761. doi: 10.1529/biophysj.104.058727. [DOI] [PMC free article] [PubMed] [Google Scholar]
- 36.Luo Y, Egwolf B, Walters DE, Roux B. J Phys Chem B. 2010;114(2):952–958. doi: 10.1021/jp906790f. [DOI] [PMC free article] [PubMed] [Google Scholar]
- 37.Kobiler D, Weiss S, Levy H, Fisher M, Mechaly A, Pass A, Altboum Z. Infect Immun. 2006;74(10):5871–5876. doi: 10.1128/IAI.00792-06. [DOI] [PMC free article] [PubMed] [Google Scholar]
- 38.Nguyen TL. J Biomol Struct Dyn. 2004;22(3):253–265. doi: 10.1080/07391102.2004.10531226. [DOI] [PubMed] [Google Scholar]
- 39.Karginov VA, Nestorovich EM, Moayeri M, Leppla SH, Bezrukov SM. P Natl Acad Sci USA. 2005;102(42):15075–15080. doi: 10.1073/pnas.0507488102. [DOI] [PMC free article] [PubMed] [Google Scholar]
- 40.MacKerell AD, Banavali N, Foloppe N. Biopolymers. 2000;56(4):257–265. doi: 10.1002/1097-0282(2000)56:4<257::AID-BIP10029>3.0.CO;2-W. [DOI] [PubMed] [Google Scholar]
- 41.Peng S, Blachlydyson E, Forte M, Colombini M. Biophys J. 1992;62(1):123–135. doi: 10.1016/S0006-3495(92)81799-X. [DOI] [PMC free article] [PubMed] [Google Scholar]
- 42.Gu LQ, Cheley S, Bayley H. J Gen Physiol. 2001;118(5):481–493. doi: 10.1085/jgp.118.5.481. [DOI] [PMC free article] [PubMed] [Google Scholar]
- 43.Blaustein RO, Koehler TM, Collier RJ, Finkelstein A. P Natl Acad Sci USA. 1989;86(7):2209–2213. doi: 10.1073/pnas.86.7.2209. [DOI] [PMC free article] [PubMed] [Google Scholar]