Abstract
Background/Aims
Studies concerning red cell distribution width (RDW) for use in the assessment of inflammatory bowel disease (IBD) activity are limited. We investigated whether RDW is a marker of active disease in patients with IBD.
Methods
In total, 61 patients with ulcerative colitis (UC) and 56 patients with Crohn's disease (CD) were enrolled in the study group, and 44 age- and-sex-matched healthy volunteers were included as the control group. A CD activity index >150 in patients with CD indicated active disease. Patients with moderate and severe disease based on the Truelove-Witts criteria were considered to have active UC. In addition to RDW, serum C-reactive protein levels, erythrocyte sedimentation rates, and platelet counts were measured.
Results
Twenty-nine (51.7%) patients with CD and 35 (57.4%) patients with UC had active disease. The RDW was significantly higher in patients with CD and UC than in controls (p<0.001 and p<0.001, respectively). A subgroup analysis indicated that for a RDW cut-off of 14%, the sensitivity for detecting active CD was 79%, and the specicity was 93% (area under curve [AUC], 0.935; p<0.001). RDW was the most sensitive and specific marker for active CD. However, it was not valid for UC, as the ESR at a cutoff of 15.5 mm/hr showed a sensitivity of 83% and a specicity of 76% (AUC, 0.817; p<0.001), whereas the RDW at a cutoff of 14% showed 17% sensitivity and 84% specicity for detecting active UC.
Conclusions
RDW was elevated in IBD in comparison with healthy controls and increased markedly in active disease. RDW may be a sensitive and specific marker for determining active CD, whereas ESR is an important marker of active UC.
Keywords: Red cell distribution width, Inflammatory bowel disease, Activity
INTRODUCTION
Inflammatory bowel disease (IBD) encompasses a group of chronic inflammatory diseases with unknown etiology that are characterized by recurring remission and exacerbation periods. Recent studies have demonstrated that both the prevalence of IBD and the hospitalization of IBD patients are increasing.1 For the determination of disease activity in IBD patients, both noninvasive laboratory parameters and endoscopic procedures are currently used to diagnose the disease and to determine the extent of disease involvement and activation.2 However, endoscopic procedures are both expensive and invasive.3 Other assays used to determine inflammation in IBD patients that have been assessed in previous studies include alterations in the erythrocyte sedimentation rate (ESR), C-reactive protein (CRP) levels, albumin levels, hemoglobin (Hgb) levels and platelet counts (PLT) as well as the measurement of serum concentrations of interleukin-6, interleukin-1, soluble interleukin-2 receptor and soluble intercellular adhesion molecule-1 (ICAM-1). However, the sensitivity and specificity of these tests for monitoring IBD disease activity are low.4-8 For the determination of mucosal inflammation, the use of a highly sensitive, highly specific radioactively labeled leukocyte assay on feces is impractical and exposes patients to radiation.9 As revealed in recent studies, high-sensitivity and high-specificity tests, such as fecal calprotectin, lactoferrine and polymorphonuclear neutrophil elastase tests, are expensive and are not available at many medical centers.10,11 Therefore, there is a need for a new way to test for IBD disease activity that is highly specific yet cost-effective and not overly invasive or potentially harmful to patients. Previous studies in patients with normal hemoglobin levels have demonstrated that the red cell distribution width (RDW) is a valuable assay for the diagnosis of celiac disease and for the monitoring of celiac patients on a gluten-free diet.12,13 The purpose of this study was to determine whether the RDW could also be used as a marker to assess disease activation in IBD patients.
MATERIALS AND METHODS
1. Selection of study participants
This is a cross sectional observational cohort study performed in Department of Gastroenterology, Haydarpaşa Numune Education and Research Hospital. A total of 117 consecutive IBD patients with ages ranging from 18 to 70 years participated in the study. These patients were diagnosed with IBD that was clinically, endoscopically, radiologically and histopathologically confirmed. Furthermore, the clinical and laboratory parameters of these patients were reviewed to confirm their diagnosis. In addition to the IBD patients, 44 healthy control subjects, who were matched with the patients in terms of age and gender, participated in the study. For the selection of the control group, subjects were chosen who had no known disease, did not use medication or transfusion treatments and did not have any immediate family members with IBD. All participants were inqueried for any constitutional symptoms those may be confused with IBDs and any participant positive for these symptoms were exluded from this study. Subjects with any inflammatory diseases, anemia, or malignancies were carefully excluded from the present study. All subjects included in the control group were judged to be in good health, with normal results on liver function tests, acute phase reactants (such as CRP, ESR) and confirmed as having normal findings by transabdominal ultrasound. Subjects who were taking any medication were not included in the control group. The study protocol was approved by our local Ethics Committee and all subjects gave their written informed consent to participate in the study.
Patients were diagnosed with IBD (ulcerative colitis [UC] or Crohn's disease [CD]) and further divided into 2 subgroups based on their disease activation state (either "active" or "in remission"). The UC patients were categorized using the Truelove-Witts criteria, and patients with CD were categorized using the CD activity index (CDAI) criteria. Patients were considered to be in the "active" disease state if they had medium-severe activity based on Truelove-Witts criteria or a CDAI greater than 150 for UC and CD, respectively.
Hematological parameters, including Hgb (range, 14 to 18 g/dL for men, 12 to 16 g/dL for women), white blood cell count (WBC; range, 4,000 to 10,000/mm), PLT count (range, 150,000 to 450,000/mm), and RDW (range, 11% to 14%), were analyzed by standard methods. ESR was estimated by Westergen method. The threshold levels for ESR, and CRP were 20 mm/hr, and 0.8 mg/dL, respectively.
The age, gender, disease location and duration, and disease activity of each patient were determined. All enrolled patients were asked to take hemogram tests. Routine hemogram parameters, CRP and ESR values and inflammatory markers were assessed. First, comparisons of the RDW values from the IBD patients were made between the UC, CD, and healthy control groups. Then, the patients were grouped based on their disease activation states, and the RDW levels were compared between the active and remission period subgroups within each disease. Finally, ESR and CRP levels were compared among the groups and crosswise with the control group.
2. Statistical evaluation
SPSS for Windows version 15.0 (SPSS Inc, Chicago, IL, USA) was used for the statistical analyses. For the evaluation of the study data, in addition to descriptive statistical methods (mean±standard deviation), Student's t-test and the Mann-Whitney U Test were used to establish potential differences between the averages of 2 independent groups for parameters with and without normal distributions, respectively. Variance analysis of intergroup values was performed using the Kruskal-Wallis test. The one-way ANOVA test was used for normal distribution, one-way variance analysis. Tukey/Bonferroni correction was applied to obtain the right group making the difference. Statistically significant differences were also analyzed with the Dunnett test. To determine the potential correlation of RDW with PLT, CRP or ESR between multiple groups, Spearman's rank correlation coefficient was used. Receiver operating characteristic (ROC) curve analysis was used to calculate sensitivity and specificity levels. For comparisons of qualitative data, the chi-squared test was used. The results in the 95% confidence interval and pvalues of less than 0.05 were considered to be significant.
RESULTS
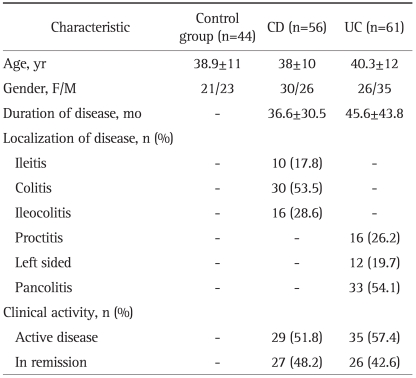
A diagnosis of UC was made in 61 of the 117 IBD patients enrolled in the study, and a diagnosis of CD was given to the other 56 patients. No significant differences were found between the IBD patients or their subgroups enrolled in the study compared with the control group subjects in terms of age or gender. Demographic and clinical characteristics of the controls and the patients with IBD were shown in Table 1.
Table 1.
Demographic and Clinical Characteristics of the Controls and the Patients with IBD
IBD, inflammatory bowel disease; CD, Crohn's disease; UC, ulcerative colitis.
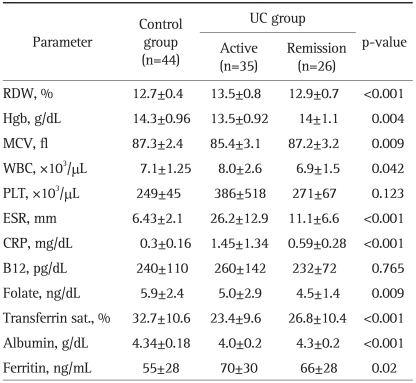
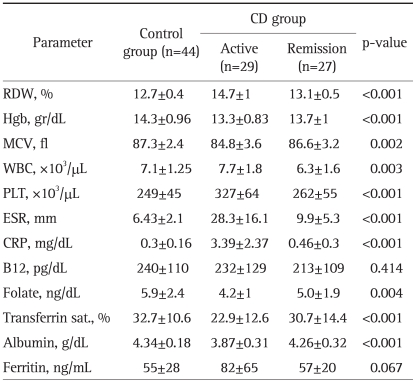
The lab test findings from patients with UC or CD compared to those from the control group are presented in Tables 2 and 3. When the IBD patients were compared based on their disease state, active disease versus in remission, we observed the following: 1) regardless of the disease state, the RDW level in CD (13.9±1.1) patients was statistically higher than that in UC (13.3±0.8) patients (p<0.001); 2) during the remission period, the RDW percentages in UC (12.9±0.7) and CD (13.1±0.5) patients were not significantly different (p=0.29); 3) the RDW percentage in active CD (14.7±1) patients was significantly higher than that in patients with active UC (13.5±0.8) (p<0.001); 4) the RDW percentage in active CD patients (14.7±1) was significantly higher than that in CD patients in remission (13.1±0.5) (p<0.001); and 5) the RDW percentage in active UC patients (13.5±0.8) was significantly higher than that in UC patients in remission (12.9±0.7) (p<0.001).
Table 2.
Comparison of Laboratory Parameters in UC Patients and Controls (One-Way ANOVA Test)
UC, ulcerative colitis; RDW, red cell distribution width; Hgb, hemoglobin; WBC, white blood cell count; PLT, platelet counts; ESR, erythrocyte sedimentation rate; CRP, C-reactive protein.
Table 3.
Comparison of Laboratory Parameters in CD Patients and Controls (One-Way ANOVA Test)
CD, Crohn's disease; RDW, red cell distribution width; Hgb, hemoglobin; WBC, white blood cell count; PLT, platelet counts; ESR, erythrocyte sedimentation rate; CRP, C-reactive protein.
The CRP and ESR levels in patients with active CD were found to be significantly higher than those in the CD patients in remission or in the controls. Similar results were observed in patients with active UC versus UC patients in remission. No statistically significant differences were found between the CRP and ESR levels of UC patients in remission and CD patients in remission. The Spearman correlation (Table 4) showed that increased inflammatory parameters, such as ESR, CRP and PLT, were significantly correlated with an elevated RDW level in the patients with active phase of their disease. In addition, the inflammatory parameters themselves were significantly correlated. These data suggest that RDW levels increase in the presence of inflammation in a similar fashion to other inflammatory parameters; thus, RDW can be considered to be an indicator of active inflammation.
Table 4.
Correlation of RDW with Other Inflammatory Parameters (Spearman Correlation)
RDW, red cell distribution width; PLT, platelet counts; ESR, erythrocyte sedimentation rate; CRP, C-reactive protein.
*p<0.001, values are statistically significant.
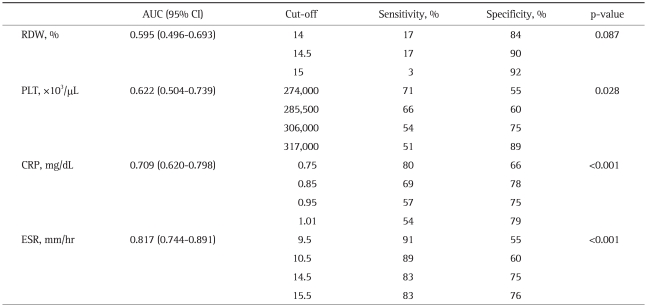
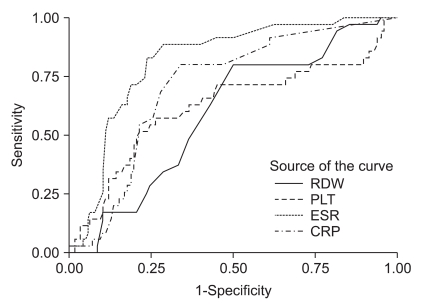
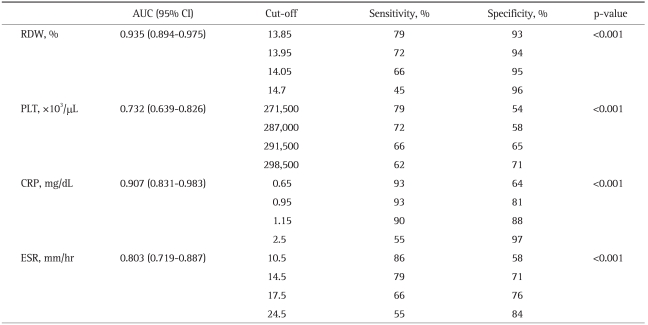
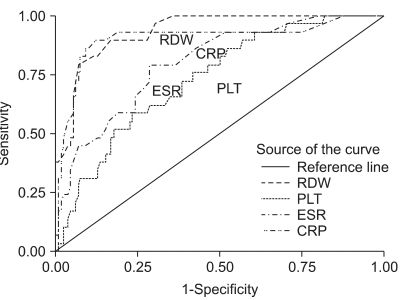
Comparisons of the RDW with other inflammatory parameters (ESR, CRP, and PLT) in UC patients and the corresponding ROC curves are shown in Table 5 and Fig. 1, respectively. For the determination of disease activation in UC patients, the specificity for using the RDW as an indicator of active disease in UC patients was calculated to be 84%, with 17% sensitivity. The most sensitive indicator for the active disease state in UC patients was ESR (91%), and its specificity was 55%. Overall, in UC patients, RDW and PLT levels were not significant indicators of the active disease state in terms of sensitivity and specificity, whereas CRP and ESR values were statistically significant. In contrast, RDW was found to be the most specific test for the determination of active disease in CD patients, with 93% specificity and 79% sensitivity (Table 6, Fig. 2). The CRP level was the most sensitive indicator (93%) for CD patients, but this parameter had only 64% specificity. Of the inflammatory markers, the sensitivity of ESR was found to be 86% for assessing the disease activation state in CD patients, with a specificity of 58%. In addition, the PLT level was significant in terms of both sensitivity and specificity. Overall, we found that the determination of the RDW was a significantly sensitive and specific method for the assessment of the disease activation state of CD, similar to sensitivity and specificity of other established inflammatory parameters.
Table 5.
Statistical Data for RDW, PLT, CRP, and ESR in the Active UC Group
RDW, red cell distribution width; PLT, platelet counts; ESR, erythrocyte sedimentation rate; CRP, C-reactive protein; AUC, area under curve; CI, confidence interval; UC, ulcerative colitis.
Fig. 1.
ROC curves for PLT, CRP, ESR, and RDW compared with the activity level of UC (the area under the curve for RDW is 0.595, p=0.087).
ROC, receiver operating characteristic; PLT, platelet counts; CRP, C-reactive protein; ESR, erythrocyte sedimentation rate; RDW, red cell distribution width; UC, ulcerative colitis.
Table 6.
Statistical Data for RDW, PLT, CRP, and ESR in the Active CD Group
RDW, red cell distribution width; PLT, platelet counts; ESR, erythrocyte sedimentation rate; CRP, C-reactive protein; AUC, area under curve; CI, confidence interval; CD, Crohn's disease.
Fig. 2.
ROC curves for PLT, CRP, ESR, and RDW compared with the activity level of CD (CDAI below or above 150; area under the curve for RDW is 0.935; p<0.001).
ROC, receiver operating characteristic; PLT, platelet counts; CRP, C-reactive protein; ESR, erythrocyte sedimentation rate; RDW, red cell distribution width; CD, Crohn's disease; CDAI, CD activity index.
DISCUSSION
The aim of an IBD treatment plan is to induce remission and to ensure that the remission is maintained. Currently, research in this field is directed toward the identification of tests for the assessment of the active disease that are easy to perform, affordable, noninvasive and compatible with the equipment available in the clinic and laboratory. In our study, the potential use of RDW as an indicator for the IBD active state and the correlation of RDW with ESR and CRP during active disease were investigated. Additionally, a control group was included in the study to assess alterations in RDW between these controls and the IBD patients. RDW sensitivity and specificity analyses were performed on patients with active disease. Significant increases in RDW, ESR, and CRP were observed in all groups compared to the control group. We also observed a significant increase in RDW, ESR and CRP in the active disease periods of both CD and UC groups compared to the control group. This therefore demonstrates that there is a correlation between ESR, CRP and RDW in IBD.
Testing for RDW values in IBD patients would be an affordable method that would not require any additional costs both for patient and clinic. Modern hemogram devices automatically measure the size of red blood cells and analyze their distribution volume. Of the standard, measured lab parameters, RDW has the highest sensitivity for diagnosing IDA.14 Some studies have suggested that the impairment of intestinal iron absorption in CD patients correlates with disease activity and inflammatory markers.15 RDW is also a sensitive indicator for the assessment of nutritional factors that are critical for the generation and maturation of red blood cells. Nutritional deficiencies result in impaired formation of red blood cells, which leads to a heterogeneous red blood cell population and an increase in RDW.16 Accordingly, for this study, efforts were made to prevent iron deficiency and to select patients who did not have anemia to prevent misevaluation of the RDW, the first parameter to increase in the case of iron deficiency; therefore, we measured serum iron, total iron binding capacity and ferritin levels, and we calculated transferring saturation levels in the enrolled patients. In addition, the folic acid and B12 levels of the patients were also determined, and patients with levels lower than the reference values were excluded from the study. Thus, hematological patients who would likely have an elevated RDW were eliminated from this study to the greatest extent possible.
In recent years, many studies have investigated alterations in RDW in association with cardiac death (especially heart failure) and noncardiac death.17-22 These studies have reported a correlation of RDW with ESR and CRP, such that RDW increases during inflammation, similar to the increase seen in other inflammatory parameters, and have suggested that RDW might increase due to chronic inflammation. Lee and Kim23 investigated the potential correlation of RDW with ESR and CRP in patients with the inflammatory disease rheumatoid arthritis and found that there was indeed a correlation between RDW and CRP in both the anemic and the nonanemic groups. Lippi et al.24 conducted a large-scale cohort study on 3,845 subjects and investigated the correlation of RDW with ESR and CRP; it was concluded that RDW increased during inflammation, similar to the increase seen in other inflammatory parameters.
Although there is a strong precedent for a correlation between RDW and chronic inflammation, this relationship has not been thoroughly examined in the case of IBD, as there is currently only one study on this subject in the scientific literature. In this particular study, conducted by Cakal et al.,25 the correlation between IBD disease activation state and RDW was investigated. This study included a total of 96 patients (74 UC patients and 22 CD patients) and found that RDW was significantly increased during active disease in both UC and CD patients compared to the RDW in patients in remission of these diseases. In addition, a correlation between elevated RDW levels and CRP and ESR levels was found. Sensitivity and specificity analysis for the RDW test showed that there was 75% sensitivity and 86% specificity observed in UC patients and 63% sensitivity and 92% specificity observed in CD patients. Thus, it was concluded that RDW was significantly higher in active IBD patients and that an increase in RDW was the most sensitive and most specific test for the determination of active disease in UC patients.
The specificity and sensitivity values determined for active UC disease in the study by Cakal et al.25 were different from those observed in our study. The Hgb levels of patients in either an active or remission period enrolled in the previous study were lower than those of the patients in our study. As rectal bleeding and the presence of blood in the feces are often seen in UC patients, the occurrence of IDA in these patients is more frequent (81%). In the Cakal et al. study, ferritin, transferrin saturation, serum iron and MCV levels, which we used as criteria for the elimination of patients with anemia and IDA, were not investigated. Therefore, elevated RDW in UC patients with clear IDA and/or as an early finding of IDA might have been more easily determined in the former study. Furthermore, the small number of CD patients enrolled in that study (22 patients, with 14 active and 8 in remission) and the probable B12-folate deficiency might also account for the differences observed between their study and ours.
In their study, Clarke et al.26 observed a significant difference in RDW values in CD and UC groups without categorizing the patients as having active disease or as being in remission. In our study, when RDW was investigated in the UC and CD groups, and all patients or all active patients were considered, the RDW levels of CD patients were significantly higher than those of the UC group however, no significant difference was observed between the groups of patients in remission. If, as presented in previous studies, we consider RDW as an indicator of the systemic inflammatory response, then it may be that the significant increase in RDW observed in CD patients is indicating that there is systemic involvement in CD, including systemic inflammation, which could contribute to the increased frequency of extra-intestinal inflammatory events. In addition, there is a correlation between systemic inflammatory events and the disease involvement area in UC; that is, there are more systemic symptoms in patients with ulcerative pancolitis.
Although inflammation was present in the UC and CD patients in remission, the inflammation was minimal and under control, as indicated by the values of RDW, ESR and CRP; no significant differences in these values were observed between the groups. This finding supports the correlation of the current inflammation state with the RDW. Moreover, the increase in RDW occurred before alterations in MCV and Hgb, suggesting that increased RDW can be used as an early indicator of active disease in IBD patients. In both CD and UC patients with active disease, the RDW levels were significantly higher than in the patients in remission periods for each disease. The significant increase in RDW observed in active disease patients could have been due to intestinal blood loss that occurs in the active period, nutritional deficiencies (absorption, emission and intake deficiencies), an elevated cytokine load during inflammation, or a decrease in erythropoiesis due to increased interleukin-6.
RDW had statistically significant specificity and sensitivity for the determination of active CD, but it did not have a similar significance for the determination of active UC. When the upper limit for defining the RDW as elevated was set at 14%, it was determined that RDW levels were elevated in 32% of active UC patients and in 61% of active CD patients. When the sensitivity and specificity were calculated using the ROC curve, the sensitivity was 17% with 84% specificity for the determination of active UC and 79% with 93% specificity for the determination of active CD. Compared to the other evaluated inflammatory markers, the RDW test exhibited the highest specificity for the determination of CD activation.
When the RDW cutoff value was set at 14%, the RDW could be used as a specific indicator for determining the disease activity in UC and CD patients. Although the sensitivity of this assay was low in the UC patients in our study, there was a high specificity observed in UC patients, and both sensitivity and specificity were high in CD patients; therefore, when the RDW level has increased by 14%, this assay is useful for the determination of disease activation. We also demonstrated that increases in CRP, ESR and PLT levels in both UC and CD patients with active disease correlated with a concurrent increase in RDW. Thus, similar to other parameters such as CRP and ESR, the determination of the RDW will also help clinicians to determine the presence of active disease. Nutritional deficiencies and their related anemias are frequently observed in the IBD patient group, and due to replacement therapies and transfusions, elevated RDW levels are also frequently present. Although hemograms are routinely performed in nearly all patients, sufficient attention is often not paid to the RDW, except for its use in the evaluation of anemia. In our study, we showed that an increased RDW is an indicator of inflammation in IBD patients and that it increases even more clearly during active disease phases. Thus, clinicians should include an evaluation of the RDW parameter during their assessments of IBD patients.
In conclusion, our study has established that RDW can be used to determine the disease activity state of IBD. Without any additional cost requirements or effort, a careful clinician can evaluate a hemogram acquired at any time throughout the course of a patient's disease and can gain valuable data on the disease state. Furthermore, as RDW is a routine hemogram parameter that can be determined using an automatic blood counting device, it is an easy, accessible and affordable test. Future studies are needed to better understand the importance of the increased RDW observed in IBD patients with active disease. In addition, studies conducted on a greater number of active IBD patients will help to better determine the magnitude of RDW increase that indicates disease activation and to evaluate early stage disease response to treatment and clinical follow-up.
Footnotes
No potential conflict of interest relevant to this article was reported.
References
- 1.Nguyen GC, Tuskey A, Dassopoulos T, Harris ML, Brant SR. Rising hospitalization rates for inflammatory bowel disease in the United States between 1998 and 2004. Inflamm Bowel Dis. 2007;13:1529–1535. doi: 10.1002/ibd.20250. [DOI] [PubMed] [Google Scholar]
- 2.Tibble JA, Bjarnason I. Non-invasive investigation of inflammatory bowel disease. World J Gastroenterol. 2001;7:460–465. doi: 10.3748/wjg.v7.i4.460. [DOI] [PMC free article] [PubMed] [Google Scholar]
- 3.Canani RB, de Horatio LT, Terrin G, et al. Combined use of noninvasive tests is useful in the initial diagnostic approach to a child with suspected inflammatory bowel disease. J Pediatr Gastroenterol Nutr. 2006;42:9–15. doi: 10.1097/01.mpg.0000187818.76954.9a. [DOI] [PubMed] [Google Scholar]
- 4.Vermeire S, Van Assche G, Rutgeerts P. Laboratory markers in IBD: useful, magic, or unnecessary toys? Gut. 2006;55:426–431. doi: 10.1136/gut.2005.069476. [DOI] [PMC free article] [PubMed] [Google Scholar]
- 5.Solem CA, Loftus EV, Jr, Tremaine WJ, Harmsen WS, Zinsmeister AR, Sandborn WJ. Correlation of C-reactive protein with clinical, endoscopic, histologic, and radiographic activity in inflammatory bowel disease. Inflamm Bowel Dis. 2005;11:707–712. doi: 10.1097/01.mib.0000173271.18319.53. [DOI] [PubMed] [Google Scholar]
- 6.Cabrera-Abreu JC, Davies P, Matek Z, Murphy MS. Performance of blood tests in diagnosis of inflammatory bowel disease in a specialist clinic. Arch Dis Child. 2004;89:69–71. [PMC free article] [PubMed] [Google Scholar]
- 7.Beattie RM, Walker-Smith JA, Murch SH. Indications for investigation of chronic gastrointestinal symptoms. Arch Dis Child. 1995;73:354–355. doi: 10.1136/adc.73.4.354. [DOI] [PMC free article] [PubMed] [Google Scholar]
- 8.Nielsen OH, Vainer B, Madsen SM, Seidelin JB, Heegaard NH. Established and emerging biological activity markers of inflammatory bowel disease. Am J Gastroenterol. 2000;95:359–367. doi: 10.1111/j.1572-0241.2000.t01-1-01790.x. [DOI] [PubMed] [Google Scholar]
- 9.Nelson RL, Schwartz A, Pavel D. Assessment of the usefulness of a diagnostic test: a survey of patient preference for diagnostic techniques in the evaluation of intestinal inflammation. BMC Med Res Methodol. 2001;1:5. doi: 10.1186/1471-2288-1-5. [DOI] [PMC free article] [PubMed] [Google Scholar]
- 10.Tibble JA, Sigthorsson G, Bridger S, Fagerhol MK, Bjarnason I. Surrogate markers of intestinal inflammation are predictive of relapse in patients with inflammatory bowel disease. Gastroenterology. 2000;119:15–22. doi: 10.1053/gast.2000.8523. [DOI] [PubMed] [Google Scholar]
- 11.Langhorst J, Elsenbruch S, Koelzer J, Rueffer A, Michalsen A, Dobos GJ. Noninvasive markers in the assessment of intestinal inflammation in inflammatory bowel diseases: performance of fecal lactoferrin, calprotectin, and PMN-elastase, CRP, and clinical indices. Am J Gastroenterol. 2008;103:162–169. doi: 10.1111/j.1572-0241.2007.01556.x. [DOI] [PubMed] [Google Scholar]
- 12.Sategna Guidetti C, Scaglione N, Martini S. Red cell distribution width as a marker of coeliac disease: a prospective study. Eur J Gastroenterol Hepatol. 2002;14:177–181. doi: 10.1097/00042737-200202000-00012. [DOI] [PubMed] [Google Scholar]
- 13.Brusco G, Di Stefano M, Corazza GR. Increased red cell distribution width and coeliac disease. Dig Liver Dis. 2000;32:128–130. doi: 10.1016/s1590-8658(00)80399-0. [DOI] [PubMed] [Google Scholar]
- 14.van Zeben D, Bieger R, van Wermeskerken RK, Castel A, Hermans J. Evaluation of microcytosis using serum ferritin and red blood cell distribution width. Eur J Haematol. 1990;44:106–109. doi: 10.1111/j.1600-0609.1990.tb00359.x. [DOI] [PubMed] [Google Scholar]
- 15.Semrin G, Fishman DS, Bousvaros A, et al. Impaired intestinal iron absorption in Crohn's disease correlates with disease activity and markers of inflammation. Inflamm Bowel Dis. 2006;12:1101–1106. doi: 10.1097/01.mib.0000235097.86360.04. [DOI] [PMC free article] [PubMed] [Google Scholar]
- 16.Mitchell RM, Robinson TJ. Monitoring dietary compliance in coeliac disease using red cell distribution width. Int J Clin Pract. 2002;56:249–250. [PubMed] [Google Scholar]
- 17.Felker GM, Allen LA, Pocock SJ, et al. Red cell distribution width as a novel prognostic marker in heart failure: data from the CHARM Program and the Duke Databank. J Am Coll Cardiol. 2007;50:40–47. doi: 10.1016/j.jacc.2007.02.067. [DOI] [PubMed] [Google Scholar]
- 18.Tonelli M, Sacks F, Arnold M, et al. Relation between red blood cell distribution width and cardiovascular event rate in people with coronary disease. Circulation. 2008;117:163–168. doi: 10.1161/CIRCULATIONAHA.107.727545. [DOI] [PubMed] [Google Scholar]
- 19.Deswal A, Petersen NJ, Feldman AM, Young JB, White BG, Mann DL. Cytokines and cytokine receptors in advanced heart failure: an analysis of the cytokine database from the Vesnarinone trial (VEST) Circulation. 2001;103:2055–2059. doi: 10.1161/01.cir.103.16.2055. [DOI] [PubMed] [Google Scholar]
- 20.Chiari MM, Bagnoli R, De Luca PD, Monti M, Rampoldi E, Cunietti E. Influence of acute inflammation on iron and nutritional status indexes in older inpatients. J Am Geriatr Soc. 1995;43:767–771. doi: 10.1111/j.1532-5415.1995.tb07047.x. [DOI] [PubMed] [Google Scholar]
- 21.Pierce CN, Larson DF. Inflammatory cytokine inhibition of erythropoiesis in patients implanted with a mechanical circulatory assist device. Perfusion. 2005;20:83–90. doi: 10.1191/0267659105pf793oa. [DOI] [PubMed] [Google Scholar]
- 22.Perlstein TS, Weuve J, Pfeffer MA, Beckman JA. Red blood cell distribution width and mortality risk in a community-based prospective cohort. Arch Intern Med. 2009;169:588–594. doi: 10.1001/archinternmed.2009.55. [DOI] [PMC free article] [PubMed] [Google Scholar]
- 23.Lee WS, Kim TY. Relation between red blood cell distribution width and inflammatory biomarkers in rheumatoid arthritis. Arch Pathol Lab Med. 2010;134:505–506. doi: 10.5858/134.4.505.c. [DOI] [PubMed] [Google Scholar]
- 24.Lippi G, Targher G, Montagnana M, Salvagno GL, Zoppini G, Guidi GC. Relation between red blood cell distribution width and inflammatory biomarkers in a large cohort of unselected outpatients. Arch Pathol Lab Med. 2009;133:628–632. doi: 10.5858/133.4.628. [DOI] [PubMed] [Google Scholar]
- 25.Cakal B, Akoz AG, Ustundag Y, Yalinkilic M, Ulker A, Ankarali H. Red cell distribution width for assessment of activity of inflammatory bowel disease. Dig Dis Sci. 2009;54:842–847. doi: 10.1007/s10620-008-0436-2. [DOI] [PubMed] [Google Scholar]
- 26.Clarke K, Sagunarthy R, Kansal S. RDW as an additional marker in inflammatory bowel disease/undifferentiated colitis. Dig Dis Sci. 2008;53:2521–2523. doi: 10.1007/s10620-007-0176-8. [DOI] [PubMed] [Google Scholar]


