

Non-technical summary
Calcium ions flowing through the type 1 ryanodine receptor (RyR1) calcium channel trigger contraction of skeletal muscle cells. Close to 300 mutations of the gene encoding RyR1 are responsible for several muscular diseases in human. Properties of pathological mutant RyR1s have so far been essentially assessed from studies in cultured cells and in differentiated native muscle fibres from a few available transgenic mouse models. We show that functional properties of mutant RyR1s can be reliably assessed following in vivo expression in adult mouse muscles. The Y523S, R615C and R2163H RyR1 mutants produce a similar over-sensitive activation of the calcium flux whereas I4897T RyR1 mutants are responsible for a depressed Ca2+ flux. The alterations appear to result from inherent modifications of RyR1 channel function and not from indirect changes in the muscle fibre homeostasis. The present strategy will help understand the physio-pathological defects underlying alterations of muscle function in affected patients.
Abstract
Abstract
Mutations of the gene encoding the type 1 ryanodine receptor (RyR1) are associated with skeletal muscle disorders including malignant hyperthermia susceptibility (MHS) and central core disease (CCD). We used in vivo expression of EGFP-RyR1 constructs in fully differentiated mouse muscle fibres to characterize the function of several RyR1 mutants. Wild-type and Y523S, R615C, R2163H and I4897T mutants of RyR1 were separately expressed and found to be present within restricted regions of fibres with a pattern consistent with triadic localization. Confocal measurements of voltage-clamp-activated myoplasmic Ca2+ transients demonstrated alterations of sarcoplasmic reticulum (SR) Ca2+ release spatially correlated with the presence of exogenous RyR1s. The Y523S, R615C and R2163H RyR1 MHS-related mutants were associated with enhanced peak Ca2+ release for low and moderate levels of depolarization, whereas the I4897T CCD mutant produced a chronic reduction of peak SR Ca2+ release. For example, peak Ca2+ release in response to a depolarization to –20 mV in regions of fibres expressing Y523S and I4897T was 2.0 ± 0.3 (n = 9) and 0.46 ± 0.1 (n = 5) times the corresponding value in adjacent, non-expressing regions of the same fibre, respectively. Interestingly no significant change in the estimated total amount of Ca2+ released at the end of large depolarizing pulses was observed for any of the mutant RyR1 channels. Overall, results are consistent with an ‘inherent’ increase in RyR1 sensitivity to activation by the voltage sensor for the MHS-related RyR1 mutants and a partial failure of voltage-gated release for the CCD-related I4897T mutant, that occur with no sign of change in SR Ca2+ content. Furthermore, the results indicate that RyR1 channel density is tightly regulated even under the present conditions of forced exogenous expression.
Introduction
Mammalian skeletal muscle contraction is triggered by a rise in cytoplasmic Ca2+ due to Ca2+ release from the sarcoplasmic reticulum (SR) through the type 1 ryanodine receptor (RyR1). RyR1 is a massive homo-tetrameric protein, each monomer being constituted of ∼5000 residues. RyR1 channels are located in the SR membrane that faces transverse invaginations of the sarcolemma constituting the transverse (t-) tubule system. Excitation–contraction (E-C) coupling occurs within this junctional region where RyR1 gating is driven by the dihydropyridine receptor (DHPR) protein Cav1.1, which senses the changes in voltage across the t-tubule membrane (see Dulhunty, 2006). Given the primary role of RyR1 in E-C coupling, any defect of its functional properties is expected to compromise muscle force production, and thus proper motor function.
Close to 300 mutations of the human RYR1 encoding gene have been identified (for review see Lyfenko et al. 2004; Treves et al. 2005; Robinson et al. 2006; Treves et al. 2008; MacLennan & Zvaritch, 2011). RYR1 gene mutations are associated in humans with malignant hyperthermia susceptibility (MHS), central core disease (CCD), multiminicore disease (MmD), centronuclear myopathy (Wilmshurst et al. 2010), atypical periodic paralysis syndromes (Zhou et al. 2010) and core-rod myopathy (Hernandez-Lain et al. 2011). Thus, there is a pressing need to better understand the mechanisms through which a given mutation alters the Ca2+ release channel function and how these defects, in turn, lead to such a diverse array of clinically distinct entities.
Understanding the physiological consequences of pathological mutant forms of the RyR1 Ca2+ release channel requires the proteins to be expressed in a skeletal muscle environment where their opening and closing is controlled by the t-tubule DHPR voltage sensor. This so far has been made possible through the combined use of electrophysiology and intracellular Ca2+ measurements in the context of two main experimental strategies: expression in cultured myotubes and generation of knock-in mouse models, keeping aside (but in mind) complementary studies performed on muscle preparations from the pig model of MHS (Dietze et al. 2000; Melzer & Dietze, 2001) and from MHS patients (Struk et al. 1998). Studies of the consequences of mutant RyR1 expression in cultured RyR1-deficient (dyspedic) myotubes have led to comprehensive and widely accepted physio-pathological models of related muscle dysfunction. In brief, certain mutations render the RyR1 channel hypersensitive to activation (a hallmark of MHS) that lead to either compensated (MH in the absence of CCD) or non-compensated (MH+CCD) SR Ca2+ leak. Conversely, mutations associated with a CCD-only phenotype are proposed to reduce SR Ca2+ release independent of a change in RyR1 sensitivity or SR Ca2+ content (Avila et al. 2001, 2003; Dirksen & Avila, 2002, 2004; Lyfenko et al. 2007).
In comparison with cultured myotubes, knock-in animal models offer the advantage of assessing the consequences of the mutations in fully differentiated adult muscle fibres. Mouse models are currently available for three mutant forms of RyR1: Y522S (Chelu et al. 2006), R163C (Yang et al. 2006) and I4897T (Zvaritch et al. 2007) and intracellular Ca2+ transients under voltage-clamp conditions have so far been investigated in adult muscle fibres isolated from the heterozygous Y522S and I4897T models (Andronache et al. 2009; Loy et al. 2011). Some of the results from these studies confirmed previous data from expression in myotubes, but also highlighted features specific to adult muscle fibres.
In the present work we characterized the functional consequences of expressing several pathological mutant forms of RyR1 in fully differentiated normal adult mouse muscle fibres, using in vivo electroporation of cDNA constructs. As compared to the knock-in mouse models available, the present strategy was designed to bypass possible complications due to effects of the mutant channels on muscle development and maturation, to limit any masking of defects due to compensatory mechanisms, and thus, to better emphasize the primary functional deficits of the mutant channel on Ca2+ release during E-C coupling. Using a combination of voltage-clamp and confocal imaging of transfected fibres, we provide insights into the function of four different RyR1 disease mutants by directly comparing their activity with that of the endogenous wild-type RyR1s present in non-expressing regions of the same cell.
Methods
Ethical approval
All experiments and procedures were conducted in accordance with the guidelines of the local animal ethics committee of University Lyon 1, of the French Ministry of Agriculture (87/848) and of the European Community (86/609/EEC). Our experiments comply with the policies and regulations of The Journal of Physiology (Drummond, 2009) and UK regulations on animal experimentation.
EGFP-RyR1 plasmids and in vivo transfection
cDNA constructs encoding rabbit wild-type (WT) and mutant I4897T RyR1 N-terminally tagged with EGFP as well as constructs encoding the corresponding untagged R615C, Y523S and R2163H mutant of RyR1 were obtained from R. T. Dirksen's laboratory. The R615C and Y523S mutations were ligated into the WT RyR1-EGFP construct using Mlu1/Age1 restriction sites. The R2163H mutation was introduced into the WT RyR1-EGFP construct using Age1/BSiW1 restriction sites.
Exogenous expression by electroporation (Trollet et al. 2006) was performed in the flexor digitorum brevis (FDB) and interosseus muscles of 4- to 6-week-old Swiss OF1 male mice using a procedure similar to the one described in detail by Di Franco et al. (2009). Mice were anaesthetized by isoflurane inhalation (3% in air, 300 ml min−1) using a commercial delivery system (Univentor 400 Anaesthesia Unit, Uninventor, Zejtun, Malta). Twenty five microlitres of a solution containing 2 mg ml-1 hyaluronidase dissolved in sterile saline was then injected into the footpads of each hind paw. Forty minutes later the mouse was re-anaesthetized by isoflurane inhalation. Plasmid DNA was then injected into the footpads of the animal at a concentration of 30 μg μl-1 in standard Tyrode solution. A 20 μl total volume of this solution was injected in different locations so as to target both the FDB and the interosseus muscles. Following the injection, two gold-plated stainless steel acupuncture needles connected to the electroporation apparatus were inserted under the skin, near the proximal and distal portion of the foot. The standard protocol used consisted in 20 pulses of 110 V cm-1 amplitude and 20 ms duration delivered at a frequency of 2 Hz by a BTX ECM 830 square wave pulse generator (Harvard Apparatus, Holliston, MA, USA). Experimental observations and measurements were carried out 2 weeks later.
Preparation of isolated muscle fibres
Single fibres were isolated from FDB and interosseus muscles using a previously described procedure (Jacquemond, 1997). In brief, mice were killed by cervical dislocation before removal of the muscles. Muscles were treated with collagenase (Sigma, type 1) for 60 min at 37°C. Single fibres were then obtained by triturating the muscles within the experimental chamber. For standard observations performed in the absence of voltage-clamp, fibres were bathed in Tyrode solution. They were dispersed on the glass bottom of either a single-well Lab-Teck chamber (Nalge Nunc, Naperville, IL, USA) or of a 50 mm wide culture μ-dish (ibidi, Munich, Germany). For intracellular Ca2+ measurements fibres were first partially insulated with silicone grease as described previously (Jacquemond, 1997). Briefly, fibres were embedded within silicone so that only a portion of the fibre extremity was left out of the silicone. Under these conditions fibres remained well maintained on the bottom of the chamber and this allowed whole-cell voltage clamp to be achieved on the silicone-free extremity of the fibre. Expressing fibres were handled with silicone so that the fibre region exhibiting EGFP fluorescence was left out of the silicone. It should be stressed that not all EGFP-positive fibres were eligible for this procedure, especially when the region of expression was within the central portion of the fibre. Once partially embedded within silicone, rhod-2 free acid was introduced into the myoplasm through local pressure micro-injection with a micropipette containing 1 mm of the dye dissolved in a solution containing 100 mm EGTA and 40 mm CaCl2 (see Solutions). Microinjection was always performed within the silicone-embedded part of the fibre, away from the silicone-free end portion under study. Following diffusion and equilibration within the cytoplasm, this was believed to achieve a final cytoplasmic concentration of rhod-2 and EGTA within the 100 μm and 10 mm range, respectively (for details concerning micro-injections see Csernoch et al. 1998). All experiments were performed at room temperature (20–22°C).
Confocal fluorescence measurements on isolated fibres
The initial series of experiments were performed with a Zeiss LSM 510 laser scanning confocal microscope available at the Centre Technologique des Microstructures of University Lyon 1. The microscope was equipped with a 63× oil immersion objective (numerical aperture 1.4). Thereafter, all experiments were conducted using a Zeiss LSM 5 Exciter confocal microscope equipped with a similar 63× oil immersion objective (numerical aperture 1.4). In both cases, the EGFP excitation was provided by the 488 nm line of an argon laser and a 505 nm long pass filter was used on the detection channel. For detection of rhod-2 fluorescence, excitation was from the 543 nm line of a He–Ne laser and fluorescence was collected above 560 nm. One major aim of the experiments was to simultaneously record intracellular rhod-2 Ca2+ signals in both an EGFP-positive fibre region (enriched in exogenous RyR1s) and an adjacent EGFP-deprived region where the contribution of exogenous RyR1s should be much less. For this we specifically worked on imaging silicone-free portion of fibres locally yielding a large and restricted EGFP signal. An illustrative example is presented in Fig. 1, which shows confocal rhod-2 (top) and EGFP (middle) images from an expressing fibre with the EGFP fluorescence profile (bottom) along the yellow line superimposed to the EGFP frame. Intracellular Ca2+-related fluorescence changes were imaged by using the line-scan mode of the system with the line parallel to the longitudinal fibre axis. The majority of images were taken with a scanning frequency of 1.53 ms per line. Image processing and analysis was performed using Image/J (NIH, USA) and Origin (OriginLab Corp., Northampton, MA, USA).
Figure 1. Confocal line-scan distribution of EGFP-tagged RyR1 channels expressed in an adult mouse muscle fibre.

Confocal x,y frames of rhod-2 Ca2+ indicator fluorescence (top) and from locally expressed EGFP-tagged RyR1 channels (middle) in a mouse muscle fibre. The graph depicts the fluorescence intensity distribution along the line shown in the middle panel (bottom). The scale bar on the rhod-2 image stands for the three panels.
Ca2+ release calculation
Changes in rhod-2 fluorescence were expressed as F/F0 where F0 is the resting (or baseline) fluorescence level. Changes in [Ca2+] were calculated from the rhod-2 signals using the previously described pseudo-ratio equation (Cheng et al. 1993), assuming a basal [Ca2+] of 100 nm and a Kd of rhod-2 for Ca2+ of 1.2 μm. An estimation of the Ca2+ release flux underlying the calculated global [Ca2+] transients was performed according to a previously described procedures (Collet et al. 2004; Pouvreau et al. 2006). In brief, the SR calcium release flux was calculated from the time derivative of the total myoplasmic Ca2+ obtained from the occupancy of intracellular calcium binding sites. The model included troponin C binding sites with a total concentration of sites (TNtotal) of 250 μm, an ‘on’ rate constant (kon,CaTN) of 0.0575 μm−1 ms−1 and an ‘off’ rate constant (koff,CaTN) of 0.115 ms−1; Ca–Mg binding sites on parvalbumin with a total concentration of sites (PVtotal) of 2000 μm, ‘on’ rate constant for Ca2+ (kon,CaPV) of 0.125 μm−1 ms−1, ‘off’ rate constant for Ca2+ (koff,CaPV) of 5.10−4 ms−1, ‘on’ rate constant for Mg2+ (kon,MgPV) of 3.3.10−5μm−1 ms−1, ‘off’ rate constant for Mg2+ (koff,MgPV) of 3.10−3 ms−1. Calcium transport across the SR membrane was included with a rate assumed to be proportional to the fractional occupancy of the SR pump sites with a dissociation constant (Kd,Capump) of 2 μm and a maximum pump rate of 10 μm ms−1. Resting [Mg2+] was assumed to be 1.5 mm. The model also included Ca2+-binding sites on EGTA at a concentration of 10 mm, an ‘on’ rate constant (kon,CaEGTA) of 0.056 μm−1 ms−1 and an ‘off’ rate constant (koff,CaEGTA) of 0.002 ms−1. Under the present conditions calcium binding to EGTA obviously made a predominant contribution to the calculated Ca2+ release flux as compared to intrinsic Ca2+-buffering and -removal components of the model.
It should be stressed that under the present conditions where fibres were micro-injected with the dye and EGTA containing solution, it was impossible to certify that the exact same concentration of EGTA was present in all fibres. To some extent, an inherent variability in the absolute values for peak rhod-2 transients and calculated Ca2+ release flux was thus expected from fibre to fibre. For this reason we focussed our analysis on comparing the properties of Ca2+ transients and Ca2+ release within a given line-scan image, between regions of the same fibre with and without detectable EGFP-RyR1s channels. Indeed, throughout an entire given fibre identical concentrations of EGTA as well as other intrinsic mobile buffers were expected. We also implicitly assumed that the level of intrinsic immobile Ca2+-binding proteins, pumps and channel proteins involved in Ca2+ homeostasis were spatially homogeneous throughout the fibre.
Electrophysiology
An RK-400 patch-clamp amplifier (Bio-Logic, Claix, France) was used in whole-cell voltage-clamp configuration. Fibres were bathed in a TEA-containing extracellular solution (see Solutions). In the series of experiments performed with the Zeiss LSM 510 microscope, command voltage pulse generation was achieved with an SMP300 voltage pulse generator (Bio-Logic). For the experiments with the Zeiss LSM 5 Exciter microscope, an analog–digital converter (Digidata 1440A, Axon Instruments, Union City, CA, USA) controlled by pCLAMP 9 software (Axon Instruments) was used. Voltage-clamp was performed with a microelectrode filled with a solution that mimics ionic conditions of the intracellular environment (see Solutions). The tip of the microelectrode was inserted through the silicone, within the insulated part of the fibre. Analog compensation was systematically used to decrease the effective series resistance. Membrane depolarizing steps of 0.5 s duration were applied from a holding command potential of –80 mV.
Immunofluorescence
FDB and interosseus muscles were electroporated with the EGFP-I4897T-RyR1 construct. Two weeks later, single fibres were isolated using collagenase treatment as described above. Muscles were triturated in Tyrode solution onto glass slides. The presence of EGFP-positive fibres on the slides was checked by fluorescence microscopy. Slides were air-dried and muscle fibres were fixed in cold methanol (–20°C) for 10 min. Slides were then stored at –80°C. Slides were re-hydrated in phosphate-buffered saline (PBS), blocked for 50 min at room temperature (M.O.M. blocking kit, Vector Laboratories) and incubated overnight with a mouse anti-RyR monoclonal antibody (34C). Slides were washed for 5 min in PBS, incubated for 1 h with an anti-mouse Cy3-conjugated secondary antibody and then washed 6 times in PBS before being mounted with a coverslip. Observations were made with a Zeiss LSM 5 Exciter confocal microscope using a 63× oil immersion objective (numerical aperture 1.4). The EGFP excitation was provided by the 488 nm line of an argon laser and a 505–530 nm band-pass filter was used on the detection channel, while Cy3 fluorescence was excited with the 543 nm line of a He–Ne laser and fluorescence was collected above 560 nm.
Solutions
The intracellular pipette solution contained (in mm) 120 potassium glutamate, 5 Na2-ATP, 5 Na2-phosphocreatine, 5.5 MgCl2, 5 glucose, 5 Hepes. The injection solution contained (in mm) 100 EGTA, 40 CaCl2 and 1 rhod-2 (tripotassium salt). The extracellular solution used in whole-cell voltage-clamp recordings contained (in mm) 140 TEA-methanesulfonate, 2.5 CaCl2, 2 MgCl2, 10 TEA-Hepes and 0.002 tetrodotoxin. All solutions were adjusted to pH 7.20.
Statistics
Least-squares fits were performed using a Marquardt–Levenberg algorithm routine included in Origin. Data values are presented as means ± SEM for n fibres. Statistical significance was determined using Student's t test assuming significance for P < 0.05.
Results
Expression of exogenous RyR1 channels
EGFP fluorescence images revealed that all exogenous RyR1s tested in the present study exhibited similar properties in terms of subcellular localization when expressed in adult skeletal muscle fibres: they were present locally within one or a few spatially restricted regions, near a nucleus, as previously reported and illustrated for RyR3 channels under similar expression conditions (see Fig. 1 in Legrand et al. 2008). In terms of transverse distribution, the GFP-tagged channels were found to occupy a very substantial volume of the fibre interior, commonly covering a distance of several tens of micrometres inside the fibre. The yield of expressing fibres was always low with the number of EGFP-RyR1 positive fibres rarely exceeding 20–30 in a given FDB or interosseus muscle. Although no systematic quantification was made, this number did not appear to change depending on the construct; in other words none of the RyR1 mutants seemed to be expressed in a specifically more or less frequent manner. Figure 2 presents illustrative confocal (x,y) images of rhod-2 (left) and EGFP (right) fluorescence collected from separate muscle fibres expressing (from top to bottom) the WT-RyR1, Y523S-RyR1, R615C-RyR1, R2163H-RyR1 and I4897T-RyR1 construct, respectively. The pair of graphs for each construct depicts average EGFP (top) and rhod-2 (bottom) fluorescence profiles along the horizontal axis of the area highlighted by a box in each EGFP image. Fluorescence profiles are shown normalized to the maximum value. For each construct, EGFP yields a succession of double rows separated by a region of lower fluorescence, the distance between two consecutive double-row peaks being ∼2 μm. This distribution is consistent with physiological positioning of the expressed RyR1 channels at the triad and indicates that any observed alteration in SR Ca2+ release was unlikely to be related to severe RyR1 channel mis-targeting. The rhod-2 fluorescence also exhibited a distinct repetitive striated pattern throughout the entire fibres, irrespective of the presence of expressed RyR1s; rhod-2 fluorescence was maximal near the centre of the EGFP double peaks, corresponding to the position of the Z-line. This is likely to result from rhod-2 binding to structural sarcomeric proteins but also, to some extent, from rhod-2 accumulation into mitochondria. Possible related complications regarding the interpretation of the voltage-activated fluorescence transients were not considered. Rhod-2 was also readily detected within nuclei where it appeared to distinctively stain nucleoli, as illustrated in the image from the fibre expressing wild-type RyR1 channels.
Figure 2. Pattern of EGFP-tagged WT and mutant RyR1 channel expression in mouse muscle fibres.

Representative examples of the expression pattern of (from top to bottom) WT-RyR1, Y523S-RyR1, R615C-RyR1, R2163H-RyR1 and I4897T-RyR1. For each example, the images correspond to the rhod-2 and EGFP fluorescence in the expressing fibre. The top and bottom traces in the graphs on the right show the normalized fluorescence intensity profiles within the boxed region shown in the corresponding EGFP image.
Wild-type RyR1 channels
One critical issue of the present experimental strategy was whether exogenous RyR1 expression per se would alter the functional properties of SR Ca2+ release. This could be thought to occur if, for instance, an unphysiologically large population of RyR1s were present and active in the SR membrane of the transfected fibres. Therefore we quantified the effect of expressing wild-type RyR1 channels under the present conditions.
Figure 3A shows rhod-2 line-scan images recorded in a fibre expressing EGFP-WT-RyR1 channels; the fibre was depolarized by 0.5 s-long steps from –80 mV to the indicated potentials. The EGFP fluorescence profile along the scanned line is shown on the right side of each image; the black and the red double-arrows near the top profile indicate the x position where the rhod-2 fluorescence signals were measured in order to generate the traces shown in Fig. 3B. The rhod-2 signal was averaged over 50 adjacent rows centred at these two positions. The left panel in Fig. 3B shows the corresponding rhod-2 F/F0 signals: the red F/F0 traces were from the region of highest expression (red arrow) of EGFP-WT-RyR1 channels whereas the black traces were from the region of lowest expression (black arrow). The right panel in Fig. 3B shows the corresponding Ca2+ release flux traces calculated as described in Methods. The flux exhibits a peak followed by a more or less complex decay phase leading to a low steady level, in agreement with recent observations in mouse FDB muscle fibres stimulated by long-lasting voltage-clamp depolarizations (Royer et al. 2010). Figure 3B shows that traces recorded from the high-expression line region (red) yielded a time course very similar to the one of the low-expression region but their amplitude was slightly depressed. The voltage dependences of peak F/F0 and peak Ca2+ release flux from that fibre are shown in Fig. 3C and D while Fig. 3E shows the voltage dependence of the estimated total released Ca2+ (expressed in terms of myoplamic volume) calculated from the time integral of the Ca2+ release flux traces. Values for this parameter also tended to be slightly depressed in the region of highest expression of exogenous wild-type RyR1s.
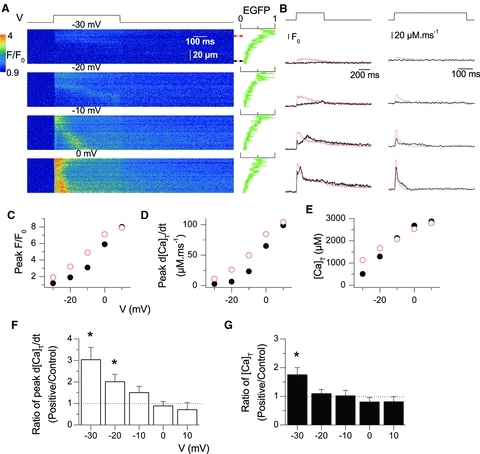
Figure 3. Voltage-activated SR Ca2+ release in EGFP-tagged WT-RyR1-expressing fibres.

A, confocal (x,t) line-scan images of rhod-2 fluorescence taken from a region of a muscle fibre that included an area of high-expression of EGFP-tagged WT-RyR1 channels. The fibre was depolarized by 0.5 s-long test pulses from –80 mV to the indicated potentials. The graph on the right of each image shows the EGFP fluorescence intensity profile along the line. The red and the black double-arrows indicate the region of the line from which the red and black traces shown in B were calculated. B, time course of rhod-2 F/F0 fluorescence (left) and of the corresponding calculated Ca2+ release flux (right) for the two regions indicated by double-arrows in A. The thick black and thin red traces are from the low-expression and high-expression regions, respectively. C, voltage dependence of the initial peak F/F0 rhod-2 fluorescence in the high-expression (open circles) and low-expression (filled circles) regions of the same fibre. D and E corresponding voltage dependence of the peak Ca2+ release flux and total released Ca2+, respectively. F and G comparison of peak Ca2+ release flux and of the total released Ca2+ in regions of a muscle fibre exhibiting high and low WT-RyR1 expression. Values for the two parameters were measured from traces as shown in Fig. 3B. F, voltage dependence of the average (±SEM) ratio of peak Ca2+ release measured in the high-expression region to the corresponding value in the low-expression region of a same line-scan image. G, voltage dependence of the average (±SEM) ratio of total released Ca2+ in the high-expression region to the corresponding value in the low-expression region of a same line-scan image. For depolarization to potentials from –30 to +10 mV, number of fibres is 7, 11, 10, 10 and 8, respectively. Fibres were from 5 distinct mice. Statistical significance indicates that the mean ratio value is significantly different from 1 (*P < 0.05).
It should be stressed that throughout the present work, one reproducible feature of the Ca2+ release flux time course was that the decay phase tended to be globally faster as the pulse amplitude was increased. This resulted in the voltage dependence of total released Ca2+ tending to reach a plateau level for lower levels of membrane depolarization than the peak Ca2+ release flux. Although changes in SR Ca2+ permeability and/or SR buffering power may influence the exact time course of the Ca2+ release flux (and thus the total amount of released Ca2+) during these long pulses (see for instance Royer et al. 2010), the late phase of SR Ca2+ release decay is believed to depend largely upon SR Ca2+ depletion. Thus, SR Ca2+ content should have a strong influence on the estimated total released Ca2+. As a simplifying approximation, we assumed that any severe change in the SR Ca2+ content due to the specific conditions tested here would be reflected as an alteration of the plateau value of total released Ca2+ measured for large levels of depolarization.
As discussed in Methods, a comparison of mean values for Ca2+ transient parameters between distinct batches of fibres was complicated by potential fibre to fibre differences in intracellular EGTA concentration. Thus, we essentially restricted the statistical analysis of effects of exogenous RyR1 channels to the value of the ratio between peak Ca2+ release flux in EGFP-rich and EGFP-poor regions of a same line-scan image and to the corresponding ratio value for total released Ca2+. The ratio should be equal to unity if the value for peak Ca2+ release (or total released Ca2+) is identical in the two different regions of the line-scan. Statistical difference was tested versus the hypothesis of the ratio being 1. These ratio values were only evaluated when there was a clear Ca2+ transient in the EGFP-rich and EGFP-poor regions of the scanned line.
Figure 3F shows the voltage dependence of the mean (±SEM) ratio for peak Ca2+ release flux in the region of highest expression of wild-type RyR1s relative to the corresponding value in the region of lowest RyR1 expression along the same line. Figure 3G shows the corresponding voltage dependence of the mean ratio for estimated total released Ca2+. For voltages more positive than –20 mV, peak Ca2+ release tended to be somewhat smaller in regions yielding the largest EGFP signal, though this was statistically significant only at +10 mV. Conversely, ratio values for total released Ca2+ were significantly smaller than unity (by ∼10–15%) for all potentials greater than –30 mV. Overall, results in Fig. 3 indicate that expression of wild-type EGFP-RyR1 channels was not entirely without consequence on voltage-activated SR Ca2+ release: a tendency for a modest reduction in peak rate and total amount of released Ca2+ was observed in fibre regions yielding the highest expression level of exogenous WT RyR1s.
Y523S-RyR1 channels
Mutation of tyrosine to serine at position 522 of human RyR1 is associated with increased susceptibility to malignant hyperthermia, a high incidence of central cores and type I fibre predominance (Quane et al. 1994). Functional properties of the equivalent Y523S rabbit RyR1 mutant were studied using expression in dyspedic myotubes (Avila & Dirksen, 2001) and properties of myotubes and muscle fibres from knock-in mice have also been characterized (Chelu et al. 2006; Durham et al. 2008; Andronache et al. 2009). Considering the amount of information available from these models, it was of considerable interest to determine the functional impact of this RyR1 disease mutant following transient regional expression in adult murine muscle fibres in our system.
A highly reproducible feature of adult fibres expressing the Y523S-RyR1 mutant was that voltage-activated SR Ca2+ release was significantly increased at low and moderate (–50 to –20) levels of depolarization in the regions of high exogenous channel expression (Fig. 4). Analysis and presentation of the data were performed as detailed above for results obtained with WT RyR1s. Figure 4A shows representative rhod-2 F/F0 line-scan images taken during application of 0.5 s-long depolarizing steps to the indicated potentials in a fibre expressing Y523S-RyR1 channels. Figure 4B shows corresponding F/F0 and calculated Ca2+ release flux traces at the line positions indicated by the arrows. The line-scan images, rhod-2 F/F0 traces and corresponding calculated Ca2+ release flux traces clearly show that SR Ca2+ release is enhanced at negative membrane potentials (e.g. –30 mV and –20 mV) in regions of the fibre endowed with Y523S-RyR1 channels. This difference was attenuated at 0 mV for which the time course of the F/F0 and release flux traces tended to be more similar in the expressing and non-expressing regions of the fibre. The voltage dependences of peak F/F0, peak Ca2+ release flux and total released Ca2+ for this fibre are shown in Fig. 4C, D and E, respectively. The results indicate a clear leftward shift of the voltage dependence of Ca2+ release activation in the region of the fibre endowed with mutant RyR1 channels whereas peak Ca2+ release was uniform across the fibre for strong depolarizing pulses.
Figure 4. Voltage-activated SR Ca2+ release in EGFP-tagged Y523S-RyR1-expressing fibres.
A, confocal (x,t) line-scan images of rhod-2 fluorescence taken from a region of a muscle fibre that included an area of high-expression of EGFP-tagged Y523S-RyR1 channels. The fibre was depolarized by 0.5 s-long test pulses from –80 mV to the indicated potentials. The graph on the right of each image shows the EGFP fluorescence intensity profile along the line. The red and the black double-arrows indicate the region of the line from which the red and black traces shown in B were calculated. B, time course of rhod-2 F/F0 fluorescence (left) and of the corresponding calculated Ca2+ release flux (right) for the two regions indicated by double-arrows in A. The thick black and thin red traces are from the low-expression and high-expression regions, respectively. C, voltage dependence of the initial peak F/F0 rhod-2 fluorescence in the high-expression (open circles) and low-expression (filled circles) regions of the same fibre. D and E, corresponding voltage dependence of the peak Ca2+ release flux and total released Ca2+, respectively. F and G comparison of peak Ca2+ release flux and of total released Ca2+, respectively, in regions of a muscle fibre exhibiting high and low Y523S-RyR1 expression. Values for the two parameters were measured from traces as shown in Fig. 4B. F, voltage dependence of the average (±SEM) ratio of peak Ca2+ release measured in the high-expression region to the corresponding value in the low-expression region of a same line-scan image. G, voltage dependence of the average (±SEM) ratio of total released Ca2+ in the high-expression region to the corresponding value in the low-expression region of a same line-scan image. For depolarization to potentials from –30 to +10 mV, number of fibres is 9, 9, 9, 5, and 3, respectively. Fibres were from 4 distinct mice. Statistical significance indicates that the mean ratio value is significantly different from 1 (*P < 0.05).
Figure 4F shows the voltage dependence of the mean (±SEM) ratio of peak Ca2+ release flux between regions of high and low Y523S-RyR1 channel expression. Figure 4G shows the corresponding voltage dependence of the mean ratio of total released Ca2+. On average, peak Ca2+ release in regions of mutant channel expression was significantly larger for depolarizations to –30 and –20 mV while the estimated total released Ca2+ was increased only at –30 mV.
From records shown in panels D of Figs 3, 4, 7 and 8, it can be seen that the Ca2+ release flux commonly tended to reach a quite low level by the end of the pulses, especially for the largest levels of depolarization. Considering the uncertainty regarding the exact EGTA concentration, any related inaccuracy regarding the amplitude of this late component of Ca2+ release could critically hamper our estimation of total released Ca2+. This particular issue is examined more carefully in Fig. 5. Figure 5B shows the mean (±SEM) rhod-2 fluorescence transient elicited by a pulse from –80 to –10 mV (Fig. 5A) in the low- (left) and high-expression (right) regions of fibres expressing the Y523S mutant. Mean traces were calculated from the individual traces obtained in the nine fibres used in Fig. 4F and G. Figure 5C shows the corresponding mean (±SEM) Ca2+ release flux calculated from the individual flux traces in each fibre. This provides an average view of the release waveform in the two situations while reducing the noise inherent to single traces. Figure 5D shows the corresponding net Ca2+ release flux: for this, the SR Ca2+ uptake component by the pump was not included in the calculation. It shows that, even though the –10 mV voltage level did not elicit the maximum peak Ca2+ release, the Ca2+ release flux near the end of the pulse tended, on average, to stabilize near the zero level in both the low- and high-expression regions of the fibres. This is consistent with a balance being reached between Ca2+ release through open RyR1s and SR Ca2+ uptake by the pump.
Figure 7. Voltage-activated SR Ca2+ release in EGFP-tagged R615C-RyR1-expressing fibres.

A, confocal (x,t) line-scan images of rhod-2 fluorescence taken from a region of a muscle fibre that included an area of high-expression of EGFP-tagged R615C-RyR1 channels. The fibre was depolarized by 0.5 s-long test pulses from –80 mV to the indicated potentials. The graph on the right of each image shows the EGFP fluorescence intensity profile along the line. The red and the black double-arrows indicate the region of the line from which the red and black traces shown in B were calculated. B, time course of rhod-2 F/F0 fluorescence (left) and of the corresponding calculated Ca2+ release flux (right) for the two regions indicated by double-arrows in A. The thick black and thin red traces are from the low-expression and high-expression regions, respectively. C, voltage dependence of the average (±SEM) ratio of peak Ca2+ release (left) and total released Ca2+ (right) measured in the high-expression region to the corresponding value in the low-expression region of a same line-scan image. The number of fibres was 11 for depolarizations from –20 to +10 mV and 9 for –30 mV. Fibres were from 6 distinct mice. D, dependence of the initial peak Ca2+ transient amplitude on the EGFP signal for different values of test depolarization. Analysis was performed as described in Fig. 5.
Figure 8. Voltage-activated SR Ca2+ release in EGFP-tagged R2163H-RyR1-expressing fibres.

A, confocal (x,t) line-scan images of rhod-2 fluorescence taken from a region of a muscle fibre that included an area of high-expression of EGFP-tagged R2163H-RyR1 channels. The fibre was depolarized by 0.5 s-long test pulses from –80 mV to the indicated potentials. The graph on the right of each image shows the EGFP fluorescence intensity profile along the line. The red and the black double-arrows indicate the region of the line from which the red and black traces shown in B were calculated. B, time course of rhod-2 F/F0 fluorescence (left) and of the corresponding calculated Ca2+ release flux (right) for the two regions indicated by double-arrows in A. The thick black and thin red traces are from the low-expression and high-expression regions, respectively. C, voltage dependence of the average (±SEM) ratio of peak Ca2+ release (left) and total released Ca2+ (right) measured in the high-expression region to the corresponding value in the low-expression region of a same line-scan image. The number of fibres was 10, 11, 12, 12 and 11 for depolarizations from –30 to +10 mV, respectively. Fibres were from 8 distinct mice. D, dependence of the initial peak Ca2+ transient amplitude on the EGFP signal for different values of test depolarization. Analysis was performed as described in Fig. 5.
Figure 5. Average Ca2+ release flux elicited by a depolarization from –80 to –10 mV in the low- and high-expression regions of fibres expressing EGFP-Y523S-RyR1 channels.
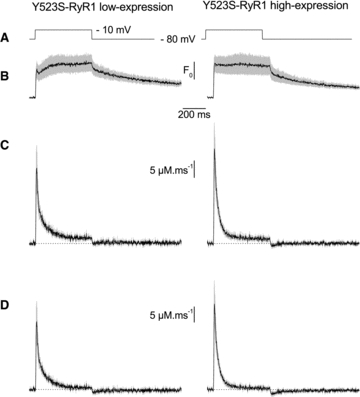
A, voltage pulse protocol. B, mean rhod-2 F/F0 signal. C, corresponding mean Ca2+ release flux. D, corresponding mean net Ca2+ release flux. Data are from the same fibres as in Fig. 4F and G. The grey shading superimposed to the F/F0 and Ca2+ release flux traces corresponds to the SEM.
Using the same set of traces we then tested how a drastic change in the assumed EGTA concentration would affect the result from the comparison of total released Ca2+ between the low- and high-expression regions of the fibres. For this we made the calculations assuming 0 mm EGTA, which of course had a profound effect on the amplitude and waveform of Ca2+ release (not illustrated). Under these conditions the mean total released Ca2+ (calculated as the time integral over the pulse duration of the Ca2+ release flux traces) from the low- and high-expression region of the fibres was 982 ± 175 μm and 994 ± 188 μm (n = 9), respectively, whereas mean corresponding values with the standard parameters were 2068 ± 293 μm and 2004 ± 321 μm, respectively. The mean ratio of total released Ca2+ in the high-expression region to the corresponding value in the low-expression region was 1.05 ± 0.18 with the standard parameters and 1.08 ± 0.19 if EGTA was assumed to be absent. It shows that the assumption regarding EGTA concentration made very little change in the result from the comparison of total released Ca2+ in the low- and high-expression regions of the fibres, strengthening the inference that SR content was likely to be similar in the two regions.
The correlation between the regional expression level of Y523S-RyR1 channels and the hyperpolarizing shift in activation of SR Ca2+ release was more directly examined in Fig. 6. Figure 6A shows a representative rhod-2 F/F0 line-scan image taken from a fibre expressing Y523S-RyR1 channels. The fibre was depolarized by a step from –80 to –50 mV. This depolarization produced a severely non-homogeneous fluorescence transient along the line with the largest increase occurring in the region of the fibre where the EGFP signal was maximal. This finding is also illustrated in Fig. 6B, which shows the corresponding F/F0 transient recorded at the two positions indicated by the double-arrows in Fig. 6A. Figure 6C shows the dependence of the initial peak F/F0 value on the relative amplitude of the spatially defined EGFP fluorescence signal. The initial peak F/F0 value was calculated from the average of 15 consecutive values in time around the peak of the global transient, at each x position of the scanned line. A strong correlation was observed between the measured initial amplitude of the Ca2+ transient and the EGFP signal intensity. Fitting a linear function to these data (shown as a superimposed line) resulted in a correlation coefficient of 0.87. Assuming the EGFP signal is proportional to the density of Y523S-RyR1 channels, the results establish a compelling correlation between the density of mutant RyR1 channels and the initial amplitude of the Ca2+ transient. Figure 6D presents the same results, but pairs of F/F0–EGFP values were sorted and averaged according to values falling within a given range of EGFP amplitudes (with an increment arbitrarily set to 0.1 unit of relative EGFP signal); the result shows that the relationship between the initial peak F/F0 and the EGFP signal amplitude was not strictly linear as peak F/F0 clearly levelled off at high EGFP intensities.
Figure 6. Dependence of the initial peak Ca2+ transient amplitude on the relative density of expressed Y523S-RyR1 channels.

A, rhod-2 (x,t) line-scan image taken from a region of a muscle fibre that included an area of high-expression of EGFP- tagged Y523S-RyR1 channels. The fibre was depolarized by a 0.5 s-long test pulse from –80 mV to –50 mV. The graph on the right shows the normalized EGFP fluorescence intensity profile along the line. B, rhod-2 F/F0 signal measured in the high and low expression regions of the scanned line. C, dependence of the initial peak F/F0 in the line-scan image shown in A on the corresponding relative EGFP intensity; initial peak F/F0 was taken as the average of 15 consecutive values over the same time interval at each x location. The superimposed line corresponds to the result from a linear fit. D, initial peak F/F0 values were averaged according to the relative EGFP signal intensity values with an increment arbitrarily set to 0.1. E, mean relationships between the normalized initial peak F/F0 amplitude and the corresponding relative EGFP intensity for different values of test depolarization in Y523S-RyR1- (upper) and WT-RyR1-expressing (lower) fibres. Relationships were established in each line-scan image as described in C and D. Data are from the same fibres as in Fig. 6 (Y523S) and Fig. 4 (WT).
The top series of panels in Fig. 6E show mean (±SEM) plots of the normalized initial peak F/F0 (normalized ΔF/F0) against relative binned EGFP intensity across a range of test potentials for Y523S-RyR1-expressing fibres. The results highlight two main features of the functional consequences from expressing EGFP-tagged Y523S-RyR1 channels. (1) Ca2+ release was critically dependent upon the EGFP signal for more negative test potentials, consistent with Y523S-RyR1 channels exhibiting an increased sensitivity for activation by t-tubule voltage, while the density and functional properties of overall ‘activated’ RyR1 channels was uniform across fibres for large depolarizing steps. (2) The amplitude of Ca2+ release at negative potentials increased approximately linearly with EGFP intensity at lower EGFP levels, but reached a saturating level at high EGFP intensity levels. As a comparison, the bottom panel in Fig. 6E shows the result from a similar analysis performed with data collected from WT-RyR1 expressing fibres. In contrast with that observed for Y523S-RyR1 the Ca2+ signal in WT-RyR1-expressing fibres was moderately reduced as relative EGFP intensity increased.
R615C-RyR1 channels
Substitution of arginine to cysteine at position 614 of human RyR1 is associated with increased susceptibility to malignant hyperthermia (Hogan et al. 1992). Properties of the corresponding R615C-RyR1 mutant have previously been characterized following expression in dyspedic myotubes (Yang et al. 2003, 2007a,b; Dirksen & Avila, 2004) and from myotubes derived from pigs homozygous for the R615C mutation (Dietze et al. 2000) and MHS patients possessing this RyR1 mutation (Struk et al. 1998).
Figure 7 shows results obtained following expression of EGFP-tagged R615C-RyR1 channels in mouse muscle fibres. Analysis and presentation of the data were performed as detailed above for both WT-RyR1 and Y523S-RyR1. Figure 7A shows illustrative examples of rhod-2 F/F0 line-scan images taken during application of 0.5 s-long depolarizing steps to the indicated potentials in a fibre expressing R615C-RyR1 channels. Figure 7B shows the corresponding F/F0 and Ca2+ release flux traces taken from the positions of the line indicated by the arrows in Fig. 7A. Similar to the results observed for Y523S-RyR1 channels, Ca2+ release was also increased at negative test potentials in regions of high R615C-RyR1 channel expression. Figure 7C shows the voltage dependence of the mean (±SEM) ratio for peak Ca2+ release (left) and total released Ca2 (right) between regions of high and low R615C-RyR1 channel expression. Ratio values for peak Ca2+ release were significantly larger than unity at –30 and –20 mV while total released Ca2+ was significantly lower than unity at 0 and +10 mV. Figure 7D shows the mean relationships between the normalized initial peak ΔF/F0 and the relative EGFP signal intensity. As for Y523S-RyR1 channels, a positive saturating correlation was observed between the two parameters. Overall, effects of R615C-RyR1 expression on voltage-activated Ca2+ release were qualitatively very similar to those observed for Y523S-RyR1, though somewhat less pronounced.
R2163H-RyR1 channels
The R2163H RyR1 mutation is associated with either MHS or MHS with cores in humans (Manning et al. 1998). The functional properties of the R2163H rabbit RyR1 channels have been studied through expression in cultured dyspedic myotubes (Avila & Dirksen, 2001; Dirksen & Avila, 2004), but no information is available with regard to the impact of this mutation in adult muscle. Figure 8 shows the results from expression of EGFP-tagged R2163H-RyR1 channels in adult mouse muscle fibres under our conditions. Representative line-scan images (Fig. 8A) and corresponding F/F0 and Ca2+ release flux traces (Fig. 8B) show that the magnitude of Ca2+ release is also increased at negative test depolarizations in regions of the fibre endowed with high R2163H-RyR1 channel expression. In the fibre shown in Fig. 8A, depolarization to –30 mV elicited significant Ca2+ release in the region of the fibre with high channel expression, but no detectable Ca2+ release in the adjacent region with low expression. Figure 8C summarizes the average (±SEM) ratio of peak Ca2+ release and total released Ca2+ between regions of high and low channel expression. Figure 8D shows the relationship between the normalized initial ΔF/F0 signal and the relative EGFP intensity. Overall, results obtained in R2163H-RyR1-expressing fibres are quantitatively similar to those obtained in Y523S-RyR1- and R615C-RyR1-expressing fibres, though a significant decrease in peak Ca2+ release was only observed in R2163H-RyR1 expressing fibres.
I4897T-RyR1 channels
The substitution of isoleucine 4898 for threonine in the C-terminal domain of RyR1 results in CCD in humans (Lynch et al. 1999; Davis et al. 2003) and was also recently found to be associated with a lethal form of congenital core-rod myopathy (Hernandez-Lain et al. 2010). Functional studies with this mutation have been conducted in human myotubes isolated from patients (Ducreux et al. 2004), in dyspedic myotubes expressing rabbit RyR1 with the equivalent mutation (Avila et al. 2001; 2003;), and in myotubes and muscle fibres isolated from a mouse knock-in model (Zvaritch et al. 2007, 2009; Boncompagni et al. 2010; Loy et al. 2011).
In stark contrast to results observed with the MHS mutants described above, expression of I4897T-RyR1 channels in adult muscle fibres was specifically associated with a depression of voltage-activated Ca2+ release (Fig. 9). Figure 9A–C shows that the presence of EGFP-tagged I4897T-RyR1 channels was associated with a reduced initial magnitude of the Ca2+ transient and rate of Ca2+ release. Importantly, peak Ca2+ release was reduced by ∼50% for all tested potential values (Fig. 9C, left panel). Interestingly the total amount of released Ca2+ remained similar between both high and low-expression regions of the fibre (Fig. 9C, right panel). Finally, the relationship between the normalized initial ΔF/F0 signal and EGFP intensity exhibited a non-saturating negative slope (Fig. 9D).
Figure 9. Voltage-activated SR Ca2+ release in the presence of EGFP-tagged I4897T-RyR1 channels.
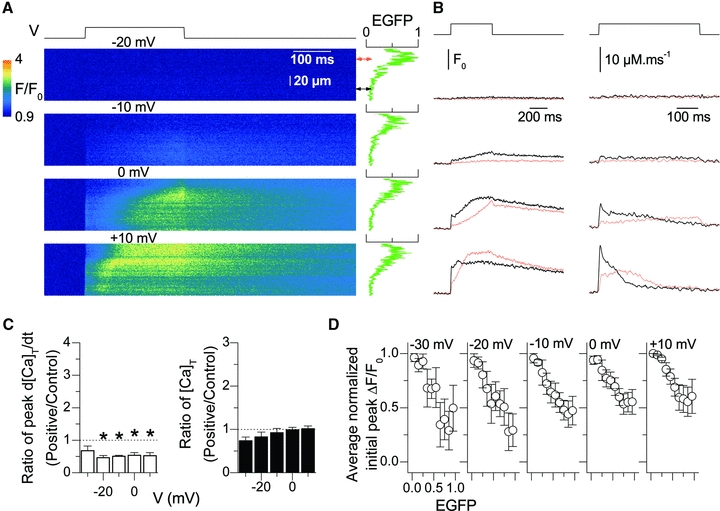
A, confocal (x,t) line-scan images of rhod-2 fluorescence taken from a region of a muscle fibre that included an area of high-expression of EGFP-I4897T-RyR1 channels. The fibre was depolarized from –80 mV to the indicated values. The graph on the right of each image shows the intensity profile of the EGFP fluorescence along the line. The red and the black double-arrows indicate the region of the line from which the red and black traces shown in B were calculated, respectively. B, time course of rhod-2 F/F0 fluorescence (left) and of the corresponding calculated Ca2+ release flux (right) within the two regions of the scanned line. The thick black and thin red traces are from the low-expression and high-expression line regions, respectively. C, comparison of the peak Ca2+ release flux (left) and of the total released Ca2+ (right) in regions of the same muscle fibre respectively yielding a high-expression (positive) and a low-expression (control) level of I4897T-RyR1 channels. From –30 to +10 mV the number of fibres is 3, 5, 6, 5 and 4, respectively. Fibres were from 3 distinct mice. D, dependence of the initial peak Ca2+ transient upon the relative EGFP signal for different values of membrane depolarization. Analysis was performed as described in Fig. 5.
The observed reduction in the rate of Ca2+ release observed in presence of EGFP-tagged I4897T-RyR1 channels could potentially be explained by a net reduction in RyR1 channel density within regions of high expression. Therefore, we set out to determine whether exogenous RyR1 expression results in a severely inhomogeneous RyR1 distribution across the region of expression. To quantify total RyR1 distribution across regions of exogenous channel expression, we examined RyR1 immunostaining in fibres expressing EGFP-tagged I4897T-RyR1 channels. Figure 10 shows an illustrative result from one of these fibres: in Fig. 10A the left image corresponds to the EGFP fluorescence of the expressed I4897T-RyR1 channels and the image on the right corresponds to total RyR1 immunolocalization with monoclonal antibody 34C. In this example, expression of the I4897T-RyR1 channels was maximal near the top left corner of the image and decreased progressively moving away from that area. The graphs in Fig. 10B plot average EGFP and Cy3 fluorescence intensity along the boxed region shown in the frame on the right in Fig. 10A. The two profiles exhibit a repeating series of synchronized double rows of peak fluorescence with a periodicity of ∼2 μm, consistent with both endogenous and expressed RyR1s localized to the triad junction. However, whereas the EGFP fluorescence decreased progressively from left to right, total RyR1 expression as indicated by the bottom signal remained fairly uniform throughout the entire fibre length. Similar results were observed for a total of six I4897T-RyR1 expressing fibres; no reproducible correlation was observed between EGFP and Cy3 fluorescence intensities.
Figure 10. Immunofluorescence labelling of RyR1 in a fibre expressing EGFP-tagged I4897T-RyR1 channels.

A, confocal (x,y) image of EGFP fluorescence (left) and RyR1 immunofluorescence using a Cy3-conjugated secondary antibody (right) from a EGFP-tagged I4897T-RyR1-expressing muscle fibre. B, EGFP (upper) and Cy-3 (lower) fluorescence intensity profiles along the boxed region shown in panel A.
Discussion
This work demonstrates that the functional properties of RyR1 mutants can be readily and reliably assessed following in vivo expression of cDNA constructs in adult mouse muscle fibres. Although not comparable in several aspects to the use of knock-in animal models, the strategy offers a simpler way to study the physio-pathological consequences of mutant RyR1s in fully differentiated adult muscle. Of specific interest is also the fact that acute expression does not subject the animal to changes during development. Since more than 300 disease mutations have been identified in the human RYR1 gene, this approach provides a more affordable and higher-throughput alternative for characterizing functional effects of new mutants in adult muscle than the generation of multiple lines of RyR1 knock-in mice.
The exogenous RyR1s were found expressed locally in fibres with a pattern consistent with physiological targeting at the triad. This localized expression pattern is advantageous as it offers the unique possibility of simultaneously assessing the function of wild-type endogenous and expressed mutant RyR1s within the same field of the same fibre.
The transient in vivo muscle expression approach used here in combination with voltage-clamp and confocal Ca2+ imaging leads to the stupendous ability to compare responses induced by the same individual depolarizing pulse between regions so close that their SR may be arguably connected and Ca-equilibrated at rest. The presence of a large concentration of intracellular EGTA, a slowly equilibrating Ca2+ buffer expected to minimally affect the time course of the Ca2+ release flux (see for instance Rios & Pizarro, 1991; Pape et al. 1995) allowed us to investigate the properties of Ca2+ release during long-lasting depolarizing pulses applied throughout the full range of voltage sensitivity of the process. The results allowed direct visualization of either an increase or a decrease in Ca2+ release within a local region of a muscle fibre, depending on the RyR1 mutant expressed, thus providing a straightforward determination of the functional consequences of each mutation. With this approach, we provide a side-by-side characterization of multiple RyR1 mutants in adult muscle and compare this behaviour with endogenous WT channels in the same fibre.
The results confirm that the functional defects of MHS (Y523S, R615C and R2163H) and CCD (I4897T) RyR1 mutants in adult muscle are fundamentally and mechanistically distinct, consistent with earlier studies conducted in immature myotubes (Avila & Dirksen, 2001; Avila et al. 2001, 2003; Dirksen & Avila, 2004). Our results further highlight the over-sensitivity to activation by the voltage sensor of the Y523S MHS-associated mutant form of RyR1 and the depressed activity of the I4897T CCD-associated one, in agreement with recent measurements on differentiated muscle fibres isolated from corresponding heterozygous knock-in mouse models (Andronache et al. 2009; Loy et al. 2011). In addition, we demonstrate that both the R615C and R2163H RyR1 mutants produce an E-C coupling phenotype in adult muscle similar to the Y523S-RyR1 mutant, though less pronounced. As effects were detected within local regions of muscle fibres transiently expressing the mutant RyR1s, the results provide compelling evidence that the observed alterations in Ca2+ release result from inherent modifications of RyR1 channel function and not from indirect global changes in the muscle cell homeostasis. Interestingly we also found that the estimated total amount of Ca2+ released by the end of the depolarizing pulses appeared to be little affected by any of the four RyR1 mutants tested here, suggesting no severe change in global SR Ca2+ content in all cases.
Expression of exogenous RyR1 channels in adult muscle fibres
Analysis of RyR1 mutant channels following forced expression in adult muscle fibres could be complicated by non-physiological levels of exogenous RyR1 channels that could exhibit varying degree of control by a limited number of endogenous voltage-sensing DHPRs. Interestingly, this was not the case. First, in contrast to what was observed when expressing RyR3 channels (Legrand et al. 2008), no spontaneous Ca2+ release activity was found following expression of exogenous WT or mutant RyR1 channels and depolarization-induced Ca2+ release was always well controlled by the t-tubule membrane voltage. Altogether, the basic regulation of intracellular Ca2+ homeostasis appeared reasonably well maintained even in regions of fibres endowed with the largest expression levels of exogenous WT or mutant RyR1s.
Furthermore specific features of voltage-activated Ca2+ transients in the presence of certain RyR1 mutants argue against severe non-physiological modifications of SR Ca2+ release due to over-expression of RyR1 proteins per se. Particularly convincing in this sense was the fact that, for low levels of membrane depolarization, significant spatial gradients of Ca2+ release correlated well with the local expression of MHS-associated RyR1 mutants. On the other hand, these gradients vanished for strong depolarizations, indicating that once activated, mutant and endogenous RyR1 channels exhibit similar functional properties. In other words, it is very unlikely that the conditions used here produced a severely enhanced density of RyR1s within the fibre regions exhibiting exogenous RyR1 expression.
Noteworthy, for the same reason it is unlikely that severe local gradients in the expression level of other proteins involved in Ca2+ regulation occurred in parallel with the spatial gradient of the expressed RyR1s. If this was the case, functional consequences would also be expected throughout the entire range of voltage-dependent activation. It remains though possible that expression of other proteins was affected within a fibre volume larger than that occupied by the exogenously expressed RyR1s and that the spatial domain of changes in expression of those other proteins would overlap the low-expression region of exogenous RyR1s. Still, the interpretation of the differences in Ca2+ signals based on the spatial distribution of expressed RyR1s would still perfectly stand, even though the level of other proteins may be changed both in the high- and low-expression regions of RyR1. In any case, since we did not attempt to take measurements of the expression levels of such other proteins, we cannot draw any definite conclusion regarding this particular issue.
Modest changes in RyR1 Ca2+ release were observed following forced RyR1 expression. Specifically, there was a slight reduction in both peak Ca2+ release flux (significant only at +10 mV) and the total amount of Ca2+ released (Fig. 3F and G) following expression of wild-type RyR1 channels. Reasons for these modest effects are not entirely clear, but could be related to subtle functional differences due to either the presence of an N-terminal EGFP tag or inherent differences between rabbit versus mouse RyR1. Nevertheless, these subtle effects need to be considered when interpreting the functional impact of the RyR1 disease mutations on Ca2+ release. Thus, the modest reductions in total Ca2+ released observed following expression of Y523S-, R615C-, and R2163H-RyR1s may in part reflect differences due to forced expression, rather than a specific defect due to the mutation.
In contrast, since expression properties of the four mutant EGFP-RyR1s in terms of yield, spatial distribution and pattern did not differ from expression of the EGFP-WT ones, and because total RyR1 density appeared to remain homogeneous in and out of the expression area (Fig. 10), the specific functional effects of the four RyR1 mutants observed in the present work have to result from altered behaviour of the expressed channel molecules and not from various levels of displacement of the normal native RyR1s by the exogenously expressed ones.
Specific functional features of RyR1 disease mutant channels
RYR1 mutations associated with MHS render the channel over-sensitive to activation by agonists, which translates into a left-shift in the voltage dependence of DHPR-induced SR Ca2+ release when expressed in a muscle cell environment (for reviews see MacCarthy et al. 2000; Melzer & Dietze, 2001; Lyfenko et al. 2004). In addition, data following homotypic expression in dyspedic myotubes suggest that mutations responsible for a mixed MHS/CCD phenotype result in uncompensated SR Ca2+ leak, and thus, a reduction in SR Ca2+ content. This was shown to be the case for the Y523S-RyR1 mutant (Avila & Dirksen, 2001) and subsequently confirmed in myotubes derived from the corresponding homozygous Y522S knock-in mouse model (Chelu et al. 2006).
However, little or no sign of SR Ca2+ depletion was observed at room temperature in both cultured myotubes and differentiated adult fibres from heterozygous WT-Y522S knock-in mice (Chelu et al. 2006; Andronache et al. 2009), whereas resting Ca2+ increased and SR content decreased when these cells were equilibrated to warmer temperatures (e.g. above 32°C, Durham et al. 2008). Similarly, here we found that fibre regions expressing the Y523S-RyR1 mutant also clearly yielded a left-shift in the voltage dependence of Ca2+ release that occurred in the seeming absence of any obvious change in total released Ca2+ in experiments conducted at room temperature. We cannot exclude possible changes in resting Ca2+ and store content at more physiological temperatures following transient expression of MHS mutants. Further work will be needed to test this possibility as well as whether such changes depend on the mutant expressed and whether they occur only within the restricted region where the mutant channels are expressed or if they would extend to adjacent regions consisting of primarily endogenous RyRs.
The R2163H-RyR1 mutant is associated with a MHS (or MHS with cores) phenotype (Manning et al. 1998) and was also found to exhibit a left-shifted voltage dependence of Ca2+ release activation and reduced SR Ca2+ content following homotypic expression in dyspedic myotubes (Avila et al. 2001). As there is no knock-in mouse or other animal model for R2163H-RyR1, the activity of this channel in adult muscle fibres had not yet been described. As was observed for Y523S-RyR1, we found that R2163H-RyR1 channels also exhibited a left-shifted voltage dependence of Ca2+ release, though somewhat more limited than that observed for Y523S channels (Fig. 8C). Indeed, the smaller ratio of peak Ca2+ release between high and low expression regions of R2163H-RyR1 channels for small depolarization (e.g. –30 mV) as compared to the corresponding ratio for Y523S-RyR1 channels is consistent with a less negative shift in the voltage dependence of Ca2+ release activation. Interestingly, for stronger levels of depolarization (e.g. –10 to +10 mV), a significant reduction in peak SR Ca2+ release ratio was observed, consistent with some extent of SR depletion. However, this interpretation needs to be taken with caution considering the similarity of this trend to that observed following expression of WT-RyR1 (see above).
The R615C-RyR1 mutant is associated with MHS only; homotypic expression in dyspedic myotubes results in a left-shifted voltage dependence of Ca2+ release (Dirksen & Avila, 2004). Similar conclusions were reached in cultured myotubes from pigs homozygous for the R615C mutation (Dietze et al. 2000), whereas Struk et al. (1998) showed that muscle fibres from MHS human patients yielded no shift in voltage dependence, but an increased in peak SR Ca2+ release. Our results showed that R615C-RyR1 expression resulted in effects similar to those observed for R2163H-RyR1. Indeed, we found no systematic or distinguishing characteristic between the consequences of this pure MHS-associated RyR1 mutation (R615C) and the two mixed ‘MHS with cores’ RyR1 mutants (Y523S and R2163H), as assessed from studies in cultured myotubes. While we cannot exclude the possibility that the approach used here lacks adequate resolution of specific properties of Ca2+ release due to the mutant RyR1s, functional differences between MHS and ‘MHS with cores’ RyR1 mutants in adult fibres may rely on more subtle mechanisms than so far presumed.
The I4898T-RyR1 mutant is associated with CCD in humans. A reduced intracellular Ca2+ response to membrane depolarization due to a reduction in SR Ca2+ content was reported in myotubes from patients with this mutation (Ducreux et al. 2004). In contrast, results from expression studies in cultured dyspedic myotubes suggested a reduction in voltage-activated SR Ca2+ release in the absence of store depletion, thus resulting in a form of excitation–contraction uncoupling (Avila & Dirksen, 2001; Avila et al. 2001). Regarding the situation in adult muscle fibres, data available from heterozygous I4898T knock-in mice confirmed a reduction in the rate of voltage-activated SR Ca2+ release with preserved SR Ca2+ content (Loy et al. 2011). These results are entirely consistent with our finding of reduced SR Ca2+ release channel function independent of any obvious sign of change in SR Ca2+ content (Fig. 9C). Furthermore, results from immunostaining demonstrate that this deficiency is not related to a loss of RyR1 channels in the SR membrane (Fig. 10), further highlighting an inherent functional failure of the Ca2+ release following expression of I4897T-RyR1s, likely to be through defective Ca2+ permeation (Loy et al. 2011). On average, peak Ca2+ release was maximally reduced by ∼50% (Fig. 9C) and never appeared to completely fail. According to single channel measurements of purified RyR1 channels following co-expression of WT and I4897T mutant subunits (Loy et al. 2011), RyR1 channel conduction is normal in tetrameric channels containing less than two mutant subunits, abolished when containing three or more mutant subunits whereas RyR1 channels containing two WT and two mutant monomers exhibit a 12.5% reduction in Ca2+ conduction (Loy et al. 2011). Given this model and assuming p to be the probability of an endogenous RyR1 WT monomer to be replaced by a mutant monomer and incorporation of any monomer being equally determined for all tetrameric channel configurations, one can calculate the relative global Ca2+ flux for every value of p according to the following equation:
 |
Figure 11 shows the corresponding relationship between relative flux and p. According to this model, the 50% reduction in Ca2+ release flux observed in our experiments would indicate that the probability of replacement of WT monomers by mutant monomers never exceeded 0.6 even within regions of high mutant subunit expression. As our measurements were performed 2 weeks after transfection, the relatively slow turnover of RyR1 protein in muscle (∼8 days; Ferrington et al. 1998) may be limiting the degree of WT RyR1 replacement in these experiments.
Figure 11. Dependence of the relative Ca2+ release flux upon the probability that a mutant I4897T monomer replaces an endogenous WT monomer within a tetrameric channel.

Data were generated according to the model of Loy et al. (2011). See text for details.
Spatial gradients of expressed RyR1 channels
Two sets of data from the present work suggest that the density of RyR1 channels remained extremely well-controlled even under the present conditions of forced exogenous expression. First, as stressed above, spatial homogeneity of SR Ca2+ release for large levels of depolarization throughout fibre regions expressing MHS-associated RyR1 mutants is consistent with a uniform population of RyR1 channels responsive to t-tubule depolarization. Notice that this does not obligatorily mean that all RyR1s were necessarily directly activated by voltage sensors, but only that we could not make a difference in SR Ca2+ release properties between regions endowed with endogenous and mutant channels for these large pulses. The possibility that within the population of both types of channels some would be activated by a mechanism other than physical interaction with DHPRs (Ca2+ activation, concerted gating) is not precluded.
Second and quite remarkably, immunostaining data in fibres expressing I4897T-RyR1 channels suggest that total RyR1 expression remains uniform both within and outside regions of localized ectopic expression. Altogether, our data are consistent with a very tightly secured control of RyR1 channel density within the junctional SR membrane.
One final issue raised by the present work lies within the details of the correlation between the EGFP signal and the peak Ca2+ transient with regard to the MHS-associated RyR1 mutants (Figs 6E, 7D and 8D). Given that overall RyR1 density is relatively uniform within and outside regions of exogenous RyR1 expression, the EGFP gradient must reflect a change in the ratio of mutant to endogenous wild-type RyR1 subunits, including all possible subunit assemblies for a tetrameric channel. For each of three MHS-associated RyR1 mutants, the relationship between the peak Ca2+ transient and the EGFP signal approached a saturating level. This means that enhancement of Ca2+ release for a given (low or moderate) level of depolarization is sufficient to ensure a complete dominant gain-of-function effect on voltage-activated SR Ca2+ release.
Advantages and limits of the method
Although the present model of transiently expressed pathological RyR1s in adult muscle fibres does not reproduce a complete fair picture of the corresponding diseased cells, it offers a unique set of advantages over alternatively used approaches.
For one, the model allows functional characterization of the mutant channels in the adult muscle environment, without the need of a transgenic animal model. Expression in adult fibres is a definite benefit over expression studies in cultured myotubes, as those are far from featuring all aspects of structure, size, organizational anisotropy and organellar and molecular content of the adult muscle fibre. As compared to knock-in animal models, the in vivo expression used here is also expected to bypass or at least limit a number of possible adaptative changes that may occur during development and maturation of a transgenic animal.
Conversely the present model is limited by the low efficiency of transfection in terms of number of cells and because of the segmental distribution of expression within the transfected cells. Thus the model is certainly unable to reproduce long-term chronic consequences of the mutant channels on whole-cell homeostasis, including possible changes in whole-cell cytosolic and intra-SR Ca2+ concentration. For instance, the possibility that core-like structures would develop in these conditions is quite unlikely. Also, the possibility to detect consequences of the mutant channels on plasma membrane signals (for instance on store-operated Ca2+ entry or on DHPR function) is pretty much precluded.
Nevertheless the approach offers the unique opportunity to record simultaneously the activity of endogenous wild-type and of exogenous mutant RyR1s in the same muscle fibre, under the control of the same voltage pulse and with all channels facing the same unaltered environment, preserved from major direct and indirect consequences of the expression on cell properties, including Ca2+ gradient across the SR membrane. This is an important step towards full understanding of the mutant RyR1s related diseases
Conclusions
In vivo electroporation of cDNA constructs in combination with single muscle fibre electrophysiology and Ca2+ imaging provides a relatively rapid and efficient means for characterizing the functional properties of RyR1 disease mutants operating in fully differentiated adult muscle fibres. Our results provide important fundamental insights into the defects resulting from multiple RyR1 disease mutations, using an approach that minimizes effects due to changes in development, maturation or compensation that may occur in cultured myotubes and knock-in mouse models. Using this strategy, we confirmed the enhanced voltage sensitivity of MHS-related RyR1 mutants and the functional failure of a CCD-related RyR1 mutant. We find no evidence for a significant change in SR Ca2+ content at room temperature for any of the RyR1 disease mutants studied. The observed alterations in Ca2+ release were spatially confined within fibre regions expressing the mutant RyR1 channels, with a remarkable spatial correlation between the relative density of expressed RyR1s and the extent of the corresponding alterations in SR Ca2+ release. These findings demonstrate that the observed functional defects result from inherent changes in RyR1 channel properties and not from more indirect alterations in cell homeostasis. Finally, adult muscle fibres were found to exquisitely control uniform RyR1channel density within the junctional SR membrane throughout the fibre, even under conditions of forced exogenous expression.
Acknowledgments
This work was supported by grants from Centre National de la Recherche Scientifique (CNRS), Université Lyon 1, Association Française contre les Myopathies (AFM) and by NIH grant AR44657 to R.T.D. E.G.R. was a recipient of a fellowship from the Spanish Ministry of Education and Science (MEC, José Castillejo Program). We are grateful to the anonymous Reviewing Editor who suggested the quantitative analysis described in Fig. 11. We also thank Bruno Allard for critical comments on the manuscript and Yves Tourneur for helpful discussion.
Glossary
Abbreviations
- Cav1.1
α1 subunit of the DHPR
- CCD
central core disease
- DHPR
dihydropyridine receptor
- E-C
excitation–contraction
- FDB
flexor digitorum brevis
- MHS
malignant hyperthermia susceptibility
- MmD
multiminicore disease
- RyR1
type 1 ryanodine receptor
- SR
sarcoplasmic reticulum
Author contributions
R.T.D. and L.G. generated the mutant plasmid constructs and L.G. and C.L. generated EGFP-tagged versions of the constructs. R.L., C.L., E.G.R. and V.J. performed experiments, and collected and analysed data. R.L., C.L., E.G.R., L.G., R.T.D. and V.J. contributed to data interpretation and discussion. V.J. and R.T.D. designed and supervised the study and wrote the paper. This work is part of the PhD thesis of R.L., under the supervision of V.J. All authors approved the final version of the manuscript. Experiments were performed in the corresponding author's laboratory at Université Lyon 1.
References
- Andronache Z, Hamilton SL, Dirksen RT, Melzer W. A retrograde signal from RyR1 alters DHP receptor inactivation and limits window Ca2+ release in muscle fibers of Y522S RyR1 knock-in mice. Proc Natl Acad Sci U S A. 2009;106:4531–4536. doi: 10.1073/pnas.0812661106. [DOI] [PMC free article] [PubMed] [Google Scholar]
- Avila G, Dirksen RT. Functional effects of central core disease mutations in the cytoplasmic region of the skeletal muscle ryanodine receptor. J Gen Physiol. 2001;118:277–290. doi: 10.1085/jgp.118.3.277. [DOI] [PMC free article] [PubMed] [Google Scholar]
- Avila G, O'Connell KM, Groom LA, Dirksen RT. Ca2+ release through ryanodine receptors regulates skeletal muscle L-type Ca2+ channel expression. J Biol Chem. 2001;276:17732–17738. doi: 10.1074/jbc.M009685200. [DOI] [PubMed] [Google Scholar]
- Avila G, O'Connell KM, Dirksen RT. The pore region of the skeletal muscle ryanodine receptor is a primary locus for excitation-contraction uncoupling in central core disease. J Gen Physiol. 2003;121:277–286. doi: 10.1085/jgp.200308791. [DOI] [PMC free article] [PubMed] [Google Scholar]
- Boncompagni S, Loy RE, Dirksen RT, Franzini-Armstrong C. The I4895T mutation in the type 1 ryanodine receptor induces fiber-type specific alterations in skeletal muscle that mimic premature aging. Aging Cell. 2010;9:958–970. doi: 10.1111/j.1474-9726.2010.00623.x. [DOI] [PMC free article] [PubMed] [Google Scholar]
- Chelu MG, Goonasekera SA, Durham WJ, Tang W, Lueck JD, Riehl J, Pessah IN, Zhang P, Bhattacharjee MB, Dirksen RT, Hamilton SL. Heat- and anesthesia-induced malignant hyperthermia in an RyR1 knock-in mouse. FASEB J. 2006;20:329–330. doi: 10.1096/fj.05-4497fje. [DOI] [PubMed] [Google Scholar]
- Cheng H, Lederer WJ, Cannell MB. Calcium sparks: elementary events underlying excitation-contraction coupling in heart muscle. Science. 1993;262:740–744. doi: 10.1126/science.8235594. [DOI] [PubMed] [Google Scholar]
- Collet C, Pouvreau S, Csernoch L, Allard B, Jacquemond V. Calcium signaling in isolated skeletal muscle fibers investigated under “Silicone Voltage-Clamp” conditions. Cell Biochem Biophys. 2004;40:225–236. doi: 10.1385/CBB:40:2:225. [DOI] [PubMed] [Google Scholar]
- Csernoch L, Bernengo JC, Szentesi P, Jacquemond V. Measurements of intracellular Mg2+ concentration in mouse skeletal muscle fibers with the fluorescent indicator mag-indo-1. Biophys J. 1998;75:957–967. doi: 10.1016/S0006-3495(98)77584-8. [DOI] [PMC free article] [PubMed] [Google Scholar]
- Davis MR, Haan E, Jungbluth H, Sewry C, North K, Muntoni F, Kuntzer T, Lamont P, Bankier A, Tomlinson P, Sánchez A, Walsh P, Nagarajan L, Oley C, Colley A, Gedeon A, Quinlivan R, Dixon J, James D, Müller CR, Laing NG. Principal mutation hotspot for central core disease and related myopathies in the C-terminal transmembrane region of the RYR1 gene. Neuromuscul Disord. 2003;13:151–157. doi: 10.1016/s0960-8966(02)00218-3. [DOI] [PubMed] [Google Scholar]
- Di Franco M, Quinonez M, Capote J, Vergara J. DNA transfection of mammalian skeletal muscles using in vivo electroporation. J Vis Exp. 2009;32:1520. doi: 10.3791/1520. [DOI] [PMC free article] [PubMed] [Google Scholar]
- Dietze B, Henke J, Eichinger HM, Lehmann-Horn F, Melzer W. Malignant hyperthermia mutation Arg615Cys in the porcine ryanodine receptor alters voltage dependence of Ca2+ release. J Physiol. 2000;526:507–514. doi: 10.1111/j.1469-7793.2000.t01-1-00507.x. [DOI] [PMC free article] [PubMed] [Google Scholar]
- Dirksen RT, Avila G. Altered ryanodine receptor function in central core disease: leaky or uncoupled Ca2+ release channels? Trends Cardiovasc Med. 2002;12:189–197. doi: 10.1016/s1050-1738(02)00163-9. [DOI] [PubMed] [Google Scholar]
- Dirksen RT, Avila G. Distinct effects on Ca2+ handling caused by malignant hyperthermia and central core disease mutations in RyR1. Biophys J. 2004;87:3193–3204. doi: 10.1529/biophysj.104.048447. [DOI] [PMC free article] [PubMed] [Google Scholar]
- Drummond GB. Reporting ethical matters in The Journal of Physiology: standards and advice. J Physiol. 2009;587:713–719. doi: 10.1113/jphysiol.2008.167387. [DOI] [PMC free article] [PubMed] [Google Scholar]
- Ducreux S, Zorzato F, Müller C, Sewry C, Muntoni F, Quinlivan R, Restagno G, Girard T, Treves S. Effect of ryanodine receptor mutations on interleukin-6 release and intracellular calcium homeostasis in human myotubes from malignant hyperthermia-susceptible individuals and patients affected by central core disease. J Biol Chem. 2004;279:43838–43846. doi: 10.1074/jbc.M403612200. [DOI] [PubMed] [Google Scholar]
- Dulhunty AF. Excitation-contraction coupling from the 1950s into the new millennium. Clin Exp Pharmacol Physiol. 2006;33:763–772. doi: 10.1111/j.1440-1681.2006.04441.x. [DOI] [PubMed] [Google Scholar]
- Durham WJ, Aracena-Parks P, Long C, Rossi AE, Goonasekera SA, Boncompagni S, Galvan DL, Gilman CP, Baker MR, Shirokova N, Protasi F, Dirksen R, Hamilton SL. RyR1 S-nitrosylation underlies environmental heat stroke and sudden death in Y522S RyR1 knockin mice. Cell. 2008;133:53–65. doi: 10.1016/j.cell.2008.02.042. [DOI] [PMC free article] [PubMed] [Google Scholar]
- Ferrington DA, Krainev AG, Bigelow DJ. Altered turnover of calcium regulatory proteins of the sarcoplasmic reticulum in aged skeletal muscle. J Biol Chem. 1998;273:5885–5891. doi: 10.1074/jbc.273.10.5885. [DOI] [PubMed] [Google Scholar]
- Hernandez-Lain A, Husson I, Monnier N, Farnoux C, Brochier G, Lacène E, Beuvin M, Mait Viou, Manéré L, Claeys KG, Fardeau M, Lunardi J, Voit T, Romero NB. De novo RYR1 heterozygous mutation (I4898T) causing lethal core-rod myopathy in twins. Eur J Med Genet. 2011;54:29–33. doi: 10.1016/j.ejmg.2010.09.009. [DOI] [PubMed] [Google Scholar]
- Hogan K, Couch F, Powers PA, Gregg RG. A cysteine-for-arginine substitution (R614C) in the human skeletal muscle calcium release channel cosegregates with malignant hyperthermia. Anesth Analg. 1992;75:441–448. doi: 10.1213/00000539-199209000-00022. [DOI] [PubMed] [Google Scholar]
- Jacquemond V. Indo-1 fluorescence signals elicited by membrane depolarization in enzymatically isolated mouse skeletal muscle fibers. Biophys J. 1997;73:920–928. doi: 10.1016/S0006-3495(97)78124-4. [DOI] [PMC free article] [PubMed] [Google Scholar]
- Legrand C, Giacomello E, Berthier C, Allard B, Sorrentino V, Jacquemond V. Spontaneous and voltage-activated Ca2+ release in adult mouse skeletal muscle fibres expressing the type 3 ryanodine receptor. J Physiol. 2008;586:441–457. doi: 10.1113/jphysiol.2007.145862. [DOI] [PMC free article] [PubMed] [Google Scholar]
- Loy RE, Orynbayev M, Xu L, Andronache Z, Apostol S, Zvaritch E, MacLennan DH, Meissner G, Melzer W, Dirksen RT. Muscle weakness in Ryr1I4895T/WT knock-in mice as a result of reduced ryanodine receptor Ca2+ ion permeation and release from the sarcoplasmic reticulum. J Gen Physiol. 2011;137:43–57. doi: 10.1085/jgp.201010523. [DOI] [PMC free article] [PubMed] [Google Scholar]
- Lyfenko AD, Ducreux S, Wang Y, Xu L, Zorzato F, Ferreiro A, Meissner G, Treves S, Dirksen RT. Two central core disease (CCD) deletions in the C-terminal region of RYR1 alter muscle excitation-contraction (EC) coupling by distinct mechanisms. Hum Mutat. 2007;28:61–68. doi: 10.1002/humu.20409. [DOI] [PubMed] [Google Scholar]
- Lyfenko AD, Goonasekera SA, Dirksen RT. Dynamic alterations in myoplasmic Ca2+ in malignant hyperthermia and central core disease. Biochem Biophys Res Commun. 2004;322:1256–1266. doi: 10.1016/j.bbrc.2004.08.031. [DOI] [PubMed] [Google Scholar]
- Lynch PJ, Tong J, Lehane M, Mallet A, Giblin L, Heffron JJ, Vaughan P, Zafra G, MacLennan DH, McCarthy TV. A mutation in the transmembrane/luminal domain of the ryanodine receptor is associated with abnormal Ca2+ release channel function and severe central core disease. Proc Natl Acad Sci U S A. 1999;30:4164–4169. doi: 10.1073/pnas.96.7.4164. [DOI] [PMC free article] [PubMed] [Google Scholar]
- McCarthy TV, Quane KA, Lynch PJ. Ryanodine receptor mutations in malignant hyperthermia and central core disease. Hum Mutat. 2000;15:410–417. doi: 10.1002/(SICI)1098-1004(200005)15:5<410::AID-HUMU2>3.0.CO;2-D. [DOI] [PubMed] [Google Scholar]
- McLennan DH, Zvaritch E. Mechanistic models for muscle diseases and disorders originating in the sarcoplasmic reticulum. Biochim Biophys Acta. 2011;1813:948–964. doi: 10.1016/j.bbamcr.2010.11.009. [DOI] [PubMed] [Google Scholar]
- Manning BM, Quane KA, Ording H, Urwyler A, Tegazzin V, Lehane M, O'Halloran J, Hartung E, Giblin LM, Lynch PJ, Vaughan P, Censier K, Bendixen D, Comi G, Heytens L, Monsieurs K, Fagerlund T, Wolz W, Heffron JJ, Muller CR, McCarthy TV. Identification of novel mutations in the ryanodine-receptor gene (RYR1) in malignant hyperthermia: genotype-phenotype correlation. Am J Hum Genet. 1998;62:599–609. doi: 10.1086/301748. [DOI] [PMC free article] [PubMed] [Google Scholar]
- Melzer W, Dietze B. Malignant hyperthermia and excitation-contraction coupling. Acta Physiol Scand. 2001;171:367–378. doi: 10.1046/j.1365-201x.2001.00840.x. [DOI] [PubMed] [Google Scholar]
- Pape PC, Jong DS, Chandler WK. Calcium release and its voltage dependence in frog cut muscle fibers equilibrated with 20 mM EGTA. J Gen Physiol. 1995;106:259–336. doi: 10.1085/jgp.106.2.259. [DOI] [PMC free article] [PubMed] [Google Scholar]
- Pouvreau S, Csernoch L, Allard B, Sabatier JM, De Waard M, Ronjat M, Jacquemond V. Transient loss of voltage control of Ca2+ release in the presence of maurocalcine in skeletal muscle. Biophys J. 2006;91:2206–2215. doi: 10.1529/biophysj.105.078089. [DOI] [PMC free article] [PubMed] [Google Scholar]
- Quane KA, Keating KE, Healy JM, Manning BM, Krivosic-Horber R, Krivosic I, Monnier N, Lunardi J, McCarthy TV. Mutation screening of the RYR1 gene in malignant hyperthermia: detection of a novel Tyr to Ser mutation in a pedigree with associated central cores. Genomics. 1994;23:236–239. doi: 10.1006/geno.1994.1483. [DOI] [PubMed] [Google Scholar]
- Rios E, Pizarro G. Voltage sensor of excitation-contraction coupling in skeletal muscle. Physiol Rev. 1991;71:849–908. doi: 10.1152/physrev.1991.71.3.849. [DOI] [PubMed] [Google Scholar]
- Robinson R, Carpenter D, Shaw MA, Halsall J, Hopkins P. Mutations in RYR1 in malignant hyperthermia and central core disease. Hum Mutat. 2006;27:977–989. doi: 10.1002/humu.20356. [DOI] [PubMed] [Google Scholar]
- Royer L, Sztretye M, Manno C, Pouvreau S, Zhou J, Knollmann BC, Protasi F, Allen PD, Ríos E. Paradoxical buffering of calcium by calsequestrin demonstrated for the calcium store of skeletal muscle. J Gen Physiol. 2010;136:325–338. doi: 10.1085/jgp.201010454. [DOI] [PMC free article] [PubMed] [Google Scholar]
- Struk A, Lehmann-Horn F, Melzer W. Voltage-dependent calcium release in human malignant hyperthermia muscle fibers. Biophys J. 1998;75:2402–2410. doi: 10.1016/S0006-3495(98)77684-2. [DOI] [PMC free article] [PubMed] [Google Scholar]
- Treves S, Anderson AA, Ducreux S, Divet A, Bleunven C, Grasso C, Paesante S, Zorzato F. Ryanodine receptor 1 mutations, dysregulation of calcium homeostasis and neuromuscular disorders. Neuromuscul Disord. 2005;15:577–587. doi: 10.1016/j.nmd.2005.06.008. [DOI] [PubMed] [Google Scholar]
- Treves S, Jungbluth H, Muntoni F, Zorzato F. Congenital muscle disorders with cores: the ryanodine receptor calcium channel paradigm. Curr Opin Pharmacol. 2008;8:319–326. doi: 10.1016/j.coph.2008.01.005. [DOI] [PubMed] [Google Scholar]
- Trollet C, Bloquel C, Scherman D, Bigey P. Electrotransfer into skeletal muscle for protein expression. Curr Gene Ther. 2006;6:561–578. doi: 10.2174/156652306778520656. [DOI] [PubMed] [Google Scholar]
- Wilmshurst JM, Lillis S, Zhou H, Pillay K, Henderson H, Kress W, Müller CR, Ndondo A, Cloke V, Cullup T, Bertini E, Boennemann C, Straub V, Quinlivan R, Dowling JJ, Al-Sarraj S, Treves S, Abbs S, Manzur AY, Sewry CA, Muntoni F, Jungbluth H. RYR1 mutations are a common cause of congenital myopathies with central nuclei. Ann Neurol. 2010;68:717–726. doi: 10.1002/ana.22119. [DOI] [PubMed] [Google Scholar]
- Yang T, Allen PD, Pessah IN, Lopez JR. Enhanced excitation-coupled calcium entry in myotubes is associated with expression of RyR1 malignant hyperthermia mutations. J Biol Chem. 2007a;282:37471–37478. doi: 10.1074/jbc.M701379200. [DOI] [PubMed] [Google Scholar]
- Yang T, Esteve E, Pessah IN, Molinski TF, Allen PD, López JR. Elevated resting [Ca2+]i in myotubes expressing malignant hyperthermia RyR1 cDNAs is partially restored by modulation of passive calcium leak from the SR. Am J Physiol Cell Physiol. 2007b;292:C1591–C1598. doi: 10.1152/ajpcell.00133.2006. [DOI] [PubMed] [Google Scholar]
- Yang T, Riehl J, Esteve E, Matthaei KI, Goth S, Allen PD, Pessah IN, Lopez JR. Pharmacologic and functional characterization of malignant hyperthermia in the R163C RyR1 knock-in mouse. Anesthesiology. 2006;105:1164–1175. doi: 10.1097/00000542-200612000-00016. [DOI] [PubMed] [Google Scholar]
- Yang T, Ta TA, Pessah IN, Allen PD. Functional defects in six ryanodine receptor isoform-1 (RyR1) mutations associated with malignant hyperthermia and their impact on skeletal excitation-contraction coupling. J Biol Chem. 2003;278:25722–25730. doi: 10.1074/jbc.M302165200. [DOI] [PubMed] [Google Scholar]
- Zhou H, Lillis S, Loy RE, Ghassemi F, Rose MR, Norwood F, Mills K, Al-Sarraj S, Lane RJ, Feng L, Matthews E, Sewry CA, Abbs S, Buk S, Hanna M, Treves S, Dirksen RT, Meissner G, Muntoni F, Jungbluth H. Multi-minicore disease and atypical periodic paralysis associated with novel mutations in the skeletal muscle ryanodine receptor (RYR1) gene. Neuromuscul Disord. 2010;20:166–173. doi: 10.1016/j.nmd.2009.12.005. [DOI] [PMC free article] [PubMed] [Google Scholar]
- Zvaritch E, Depreux F, Kraeva N, Loy RE, Goonasekera SA, Boncompagni S, Kraev A, Gramolini AO, Dirksen RT, Franzini-Armstrong C, Seidman CE, Seidman JG, Maclennan DH. An Ryr1I4895T mutation abolishes Ca2+ release channel function and delays development in homozygous offspring of a mutant mouse line. Proc Natl Acad Sci U S A. 2007;104:18537–18542. doi: 10.1073/pnas.0709312104. [DOI] [PMC free article] [PubMed] [Google Scholar]
- Zvaritch E, Kraeva N, Bombardier E, McCloy RA, Depreux F, Holmyard D, Kraev A, Seidman CE, Seidman JG, Tupling AR, MacLennan DH. Ca2+ dysregulation in Ryr1(I4895T/wt) mice causes congenital myopathy with progressive formation of minicores, cores, and nemaline rods. Proc Natl Acad Sci U S A. 2009;106:21813–21818. doi: 10.1073/pnas.0912126106. [DOI] [PMC free article] [PubMed] [Google Scholar]