

Non-technical summary
The property of excitability is conferred to specific cell types through the action of a host of ion channels. Two classes of ion channels which play crucial roles in cellular excitability are T-type calcium and hyperpolarization-activated cyclic-nucleotide (HCN) channels. Given that T-type and HCN channel availability is increased upon hyperpolarization, T-type- and HCN-mediated currents are critical determinants of rebound depolarizations in many cell types. Rebound responses have long been documented in deep cerebellar nuclear (DCN) neurons; however, the extent to which T-type- and HCN-mediated currents contribute to rebound depolarizations following physiological input has not been established. Using a combination of in vitro electrophysiological and in silico techniques, we define the roles of T-type- and HCN-mediated currents in controlling the frequency and latency of DCN rebound spike output. Our study demonstrates that T-type and HCN channels become sufficiently available during physiological levels of hyperpolarization to make distinct contributions to the frequency and latency of rebound responses.
Abstract
Abstract
The ability for neurons to generate rebound bursts following inhibitory synaptic input relies on ion channels that respond in a unique fashion to hyperpolarization. Inward currents provided by T-type calcium channels (IT) and hyperpolarization-activated HCN channels (IH) increase in availability upon hyperpolarization, allowing for a rebound depolarization after a period of inhibition. Although rebound responses have long been recognized in deep cerebellar nuclear (DCN) neurons, the actual extent to which IT and IH contribute to rebound spike output following physiological levels of membrane hyperpolarization has not been clearly established. The current study used recordings and simulations of large diameter cells of the in vitro rat DCN slice preparation to define the roles for IT and IH in a rebound response. We find that physiological levels of hyperpolarization make only small proportions of the total IT and IH available, but that these are sufficient to make substantial contributions to a rebound response. At least 50% of the early phase of the rebound spike frequency increase is generated by an IT-mediated depolarization. An additional frequency increase is provided by IH in reducing the time constant and thus the extent of IT inactivation as the membrane returns from a hyperpolarized state to the resting level. An IH-mediated depolarization creates an inverse voltage-first spike latency relationship and produces a 35% increase in the precision of the first spike latency of a rebound. IT and IH can thus be activated by physiologically relevant stimuli and have distinct roles in the frequency, timing and precision of rebound responses.
Introduction
The encoding of activity in a neural network depends on ion channels that shape the information transferred between pre- and postsynaptic neurons. While an excitatory input can directly increase the response of a postsynaptic cell, achieving an increase in postsynaptic output in response to inhibitory input requires specific ion channel mechanisms. An increase in postsynaptic firing following a period of inhibition most often occurs through a rebound depolarization that depends on the magnitude of the preceding period of inhibition (Jahnsen & Llinas, 1984; Steriade et al. 1993; Ulrich & Huguenard, 1997; Aizenman & Linden, 1999; Tadayonnejad et al. 2009; Pedroarena, 2010; Sangrey & Jaeger, 2010). Rebound depolarizations can provide a computational advantage by producing spike bursts (an increase in the rate and duration of spike output) but also by regulating first spike latency (Kepecs & Lisman, 2003; Heil, 2004; Person & Perkel, 2005; Sangrey & Jaeger, 2010) and spike precision (Person & Perkel, 2005). Yet the ion channel mechanisms that underlie neural coding through rebound responses have not been fully identified.
Two ion channels commonly believed to underlie rebound depolarizations are the low voltage-activated T-type (Cav3) calcium channels and hyperpolarization-activated HCN channels (Jahnsen & Llinas, 1984; McCormick & Pape, 1990; Muri & Knopfel, 1994; Huguenard, 1996; Molineux et al. 2008; Biel et al. 2009). Both channels are characterized by unique kinetic and voltage-dependent properties that allow their availability to increase in response to a membrane hyperpolarization. T-type channels generate a fast activating and inactivating current (IT) that is nearly fully inactivated at resting membrane potential, but which recovers during hyperpolarization (Perez-Reyes, 2003; Iftinca et al. 2006). HCN channels generate a non-inactivating inward current (IH) that activates with increasing levels of hyperpolarization (Biel et al. 2009). In cells that express these channels, a return to a depolarized level at the end of a hyperpolarizing stimulus may lead to a rebound depolarization through direct activation of IT and an inward tail current generated by deactivation of IH.
Cells of the deep cerebellar nuclei (DCN) were among the first cells identified to generate rebound bursts following membrane hyperpolarizations in vitro (Gardette et al. 1985a; Jahnsen, 1986; Llinas & Muhlethaler, 1988), with the activation of a rebound response to synaptic inputs recently confirmed in vivo (Rowland & Jaeger, 2008; Hoebeek et al. 2010; Bengtsson et al. 2011). The ionic contributions to a rebound response have been examined in numerous studies in vitro (Gardette et al. 1985a,b; Jahnsen, 1986; Muri & Knopfel, 1994; Aizenman & Linden, 1999; Czubayko et al. 2001; Gauck et al. 2001; Molineux et al. 2006, 2008; Pugh & Raman, 2008; Alvina et al. 2009; Zheng & Raman, 2009; Sangrey & Jaeger, 2010). From this work, IT and IH have emerged as key potential contributors to the rebound response in DCN cells. Thus, direct activation of IT at the end of a hyperpolarization has been proposed to mediate the spike frequency increase, with different rebound phenotypes correlated to the expression of specific T-type channel isoforms (Molineux et al. 2006, 2008). A recent study indicated that blockers of IH increase the first spike latency (FSL) of DCN cells and revealed an inverse relationship between membrane voltage and FSL that will act to control a temporal aspect of rebound firing (Sangrey & Jaeger, 2010).
Despite the progress made in the field, it is important to recognize that much of the work conducted in vitro has routinely incorporated steps to levels of hyperpolarization well below that expected to occur naturally. Even though DCN cells receive a massive inhibitory projection from cerebellar cortical Purkinje cells, GABAA receptor-mediated IPSPs do not extend below a value for ECl of ∼−72 mV (Aizenman & Linden, 1999; Alvina et al. 2008; Zheng & Raman, 2009). In fact, the level of hyperpolarization evoked by synaptic inputs was recently suggested to be less than that required to promote sufficient recovery of T-type channels from inactivation to contribute to rebound depolarizations (Alvina et al. 2008; Zheng & Raman, 2009). The reported voltage for activation of IH in DCN cells is also more negative than that expected to be reached during periods of synaptically evoked inhibition (Raman et al. 2000). These issues are magnified by the fact that Purkinje cell-evoked IPSPs in DCN cells depress during repetitive stimulation (Telgkamp & Raman, 2002; Pedroarena & Schwarz, 2003), further decreasing the extent of hyperpolarization available to remove IT inactivation and to activate IH. The specific roles for IT and IH in contributing to rebound responses thus remain to be defined in the context of physiologically relevant membrane hyperpolarizations.
A rebound response or spike burst can serve multiple roles in signal processing and circuit function, some of which may be implemented by DCN cells when responding to cerebellar cortical input. Thus, bursts of spike discharge have been shown capable of detecting the onset or features of a given stimulus (i.e. intensity) (Cattaneo et al. 1981; Eggermont, 1998; Sherman, 2001; Kepecs et al. 2002; Oswald et al. 2004, 2007). Spike timing plays a crucial role in neural coding (Kepecs & Lisman, 2003; Heil, 2004) emphasizing the importance of the reported role for IH in controlling FSL in DCN cells (Sangrey & Jaeger, 2010). An aspect of neural coding that has not yet been examined in DCN cells is the ability to generate rebound spike output with temporal precision, a feature that would be consistent with the known temporal processing requirements of cerebellar function (Timmann et al. 1999; Zackowski et al. 2002; Jacobson et al. 2009; De Zeeuw et al. 2011). The current study sought to fully delineate the roles for IT and IH in controlling rebound responses in DCN cells in relation to physiologically relevant stimuli. We find that IT and IH are sufficiently activated by physiological levels of membrane hyperpolarization to contribute to rebound responses, and exhibit distinct roles in controlling the frequency, FSL and precision of a rebound response.
Methods
Animal care and tissue preparation
Sprague–Dawley dams and pups were obtained from Charles River Canada and maintained according to the guidelines of the Canadian Council for Animal Care, and conform to the policies and regulations of The Journal of Physiology, as described in Drummond (2009). P12–P18 male pups were anaesthetized with halothane by inhalation and decapitated, and the cerebellum was removed in ice-cold artificial cerebrospinal fluid (aCSF) composed of 125 mm NaCl, 3.25 mm KCl, 1.5 mm CaCl2, 1.5 mm MgCl2, 25 mm NaHCO3 and 25 mm d-glucose that had been preoxygenated with carbogen gas (95% O2, 5% CO2). Parasagittal cerebellar tissue slices of 230 μm thickness were cut to include the interposed deep cerebellar nucleus and then warmed to 34°C for 1 h, stored at room temperature and finally recorded at 32–34°C.
Electrophysiology
Whole-cell somatic recordings were obtained using a Multiclamp 700A amplifier (Molecular Devices, Sunnyvale, CA, USA). Data were recorded with a DC–10 kHz bandpass, digitized at 20 kHz (pCLAMP 10; Molecular Devices) and data analysed using custom software (MatLab R2006a; The MathWorks, Natick, MA, USA). Borosilicate glass pipettes (1.5 mm o.d.) had resistances of 3–6 MΩ and access resistance of 6–12 MΩ. The internal solution for current clamp recordings consisted of 130 mm potassium gluconate, 0.1 mm EGTA, 10 mm Hepes, 7 mm NaCl, 0.3 mm MgCl2, 5 mm di(tris)-creatine phosphate, 2 mm Tris-ATP and 0.5 mm Na-GTP, pH 7.3 with KOH, establishing an ECl of −75.7 mV. A junction potential of 10 mV was subtracted from all records. The internal solution for isolating IT in voltage clamp was 100 mm Cs+, 10 mm EGTA, 10 mm Hepes and 3 mm MgCl2 and the external solution included 200 nm TTX, 30 μm Cd2+, 5 mm TEA, 5 mm 4-AP and 2 mm Cs+. The internal solution for isolating IH was 140 mm KCl, 10 mm Hepes, 2.5 mm MgCl2, 0.1 mm EGTA, and the external solution included 200 nm TTX, 500 μm Ni2+, 30 μm Cd2+, 5 mm TEA, and 5 mm 4-AP. Some of the recordings of IH were conducted with 5 mm di(tris)-creatine phosphate, 2 mm Tris-ATP and 0.5 mm Na-GTP in the pipette, but results were not significantly different from recordings without these compounds.
Synaptic blockers were bath perfused after obtaining the initial seal: picrotoxin (50 μm), dl-2-amino-5-phosphonopentanoic acid (dl-AP5; 25 μm) and 6,7-dinitroquinoxolinedione (DNQX; 10 μm) and in voltage clamp experiments CGP55845 (1 μm), except during stimulation when picrotoxin and CGP55845 were omitted. T-type calcium current was blocked with a low concentration of Ni2+ (300 μm) or mibefradil (1 μm) to target all three Cav3 isoforms (Zamponi et al. 1996; McDonough & Bean, 1998; Lee et al. 1999). External Cs+ (2 mm) was used to block IH in preference to ZD 7288, given the effects of this blocker on T-type calcium channels (Sanchez-Alonso et al. 2008).
DCN cell recordings
Recordings focused on large diameter cells (>15 μm) of the interpositus nucleus that displayed a fAHP, DAP and sAHP (n = 211) (Uusisaari et al. 2007; Uusisaari & Knopfel, 2011). Resting membrane potential in tonically active DCN cells was set through current injection to a nominal level of −60 mV (including junction potential) according to the peak trough of AHPs. DCN cells maintained at a resting potential of −60 mV tonically fired at a rate of 13.6 ± 6.1 Hz (n = 30) (Tadayonnejad et al. 2010). To calculate gain (Hz/100 pA), the frequency response to different levels of depolarizing current injection was measured and the slope of a linear fit was determined. Purkinje cell inputs to DCN cells were triggered using a stimulus isolation unit (0.1–0.2 ms) with a concentric bipolar electrode (Frederic Haer, Bowdoin, ME, USA) placed dorsal to the recording site and outside of the DCN nuclei. Where indicated, the baseline amplitude of evoked inhibitory synaptic responses was first assessed under whole-cell voltage clamp and the IPSC adjusted to ∼60% (214 ± 27 pA; n = 13) of the maximal stimulus intensity. For other current clamp measurements, stimulus intensity was set to 60% of that which evoked a maximal rebound frequency increase. Ramp depolarizations under voltage clamp designed to mimic IPSP depression during repetitive stimulation were delivered at a rate of 0.026 mV ms−1.
Rebound response measurements
The absolute membrane voltage attained during a hyperpolarization was measured 20 ms before the end of a current pulse or 20 ms after the last stimulus of a presynaptic stimulus train. Rebound bursts were statistically defined according to an elevation in firing frequency following a hyperpolarization that exceeded 2 standard deviations beyond the mean of tonic frequency determined over 1 s preceding the stimulus. This definition includes both an early peak of firing frequency (<100 ms) and a later phase of firing frequency increase (Sangrey & Jaeger, 2010; Tadayonnejad et al. 2010), but all work in the present study focused on the early phase of the rebound response. Mean burst frequencies were plotted as the maximum difference in firing frequency above initial tonic firing levels. FSL was defined as the time from the offset of a current-evoked hyperpolarizing stimulus or the final stimulus of a presynaptic train to the first spike of the rebound response, and expressed as a ratio of FSL to the mean interspike interval (ISI) of tonic firing determined over 1 s preceding the stimulus.
Statistical measurements
For comparison of two independent groups, statistical significance was assessed using Student's two-tailed t test. Statistical significance of paired recordings was assessed using Student's two-tailed paired t test. Multiple groups were compared using one-way ANOVA (repeated measures where indicated) and Tukey's HSD significant difference criterion, and non-parametric paired comparisons using the Wilcoxon signed ranks test. Averaged data are shown as the mean ± SEM and statistical significance assessed at P < 0.05 (*), P < 0.01 (**) and P < 0.001 (***).
Modelling
A two-compartment model of the DCN neuron was constructed and simulations were performed in Matlab R2007b using a fourth-order Runge–Kutta algorithm with a 0.01 ms time step (dt). Ion channel models followed the Hodgkin–Huxley formulism. The somatic compartment of the model included a voltage-gated sodium current, HCN current, delayed rectifier potassium current and leak current. The dendritic compartment included T-type calcium, a slow potassium current, leak current and synaptic conductances where applicable. IT was placed in the dendritic compartment given previous work indicating that low voltage-activated (LVA) calcium fluorescence can be recorded in DCN cell dendrites (Muri & Knopfel, 1994; Gauck et al. 2001; Zhang et al. 2004; Pugh & Raman, 2008), with IPSP bursts or rebound responses producing the largest calcium transients in distal dendritic regions (Zhang et al. 2004; Pugh & Raman, 2008).
Na+ activation:
Na+ inactivation:
 |
K+ activation:
Slow K+ activation:
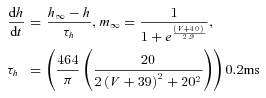
IH activation:
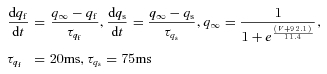 |
IT activation:
IT inactivation:
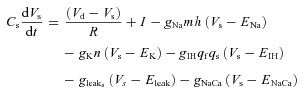
Somatic voltage:
 |
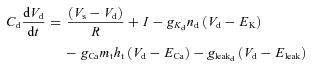
Dendritic voltage:
 |
For all simulations, the following constants were used:
Cs = 1.5 or 3 μF cm−2, Cd = 3 μF cm−2, R = 1/3, gNa = 58 mS cm−2, gK = 17.5 mS cm−2, gKd = 13 mS cm−2, gleaks = 0.1 mS cm−2, gleakd = 0.1 mS cm−2, gNaCa = 0.05 mS cm−2, EK = −97 mV, ENa = 55 mV, ECa = 128 mV, EIH = −20 mV, Eleak = −77 mV, ENaCa = −40 mV.
For simulations with IH and/or IT: gIH = 0.8 mS cm−2, gCa = 2.85 mS cm−2.
Background synaptic inputs were added to the dendritic compartment and modelled as stochastic conductances using an Ornstein–Uhlenbeck process (Uhlenbeck & Ornstein, 1930):
where τ is the correlation time constant, D is the ‘diffusion’ coefficient and ξ is a noise term (generated by Matlab's randn() function). To ensure no negative conductance values were used, gsyn was set to 0 if a negative value was detected. For inhibitory synaptic input, τ = 40 ms, D = 0.5 mS cm−2 and Einh = −77 mV. For excitatory synaptic input, τ = 20 ms, D = 0.1 mS cm−2 and Einh = 0 mV.
Results
Inhibitory input to DCN cells
DCN cells receive massive GABAergic inhibitory input from Purkinje cells of the overlying cerebellar cortex. The output of Purkinje cells is governed by either parallel fibre or climbing fibre input that can induce brief structured patterns of firing as well as subsequent pauses in the rate of firing (McKay et al. 2007; Shin et al. 2007; Steuber et al. 2007). Purkinje cell output can thus act to inhibit DCN cells and then relieve inhibition for a sufficient period of time to allow for rebound changes in DCN cell output.
The effects of repetitive trains of Purkinje cell inhibitory input on DCN cells have been well characterized (Aizenman et al. 1998; Aizenman & Linden, 1999; Tadayonnejad et al. 2009; Hoebeek et al. 2010; Pedroarena, 2010; Sangrey & Jaeger, 2010). Depending on the synchronicity of Purkinje cell inputs (IPSP amplitude), frequency, or number of presynaptic stimuli, trains of IPSPs can be followed by a rebound increase in firing frequency (De Schutter & Steuber, 2009; Hurlock et al. 2009; Hoebeek et al. 2010; Pedroarena, 2010; Sangrey & Jaeger, 2010; Tadayonnejad et al. 2010; Bengtsson et al. 2011). Shin et al. (2007) also reported that simple spike trains of Purkinje cells recorded in vivo can display patterns of firing, as determined by CV2 analysis. This study revealed a relationship between the number and frequency of simple spikes that comprise a pattern, with one of the most common patterns represented by 100 Hz output for durations of up to 30 spikes (Shin et al. 2007, their Fig. 4). Delivering 100 Hz trains of stimuli to Purkinje cell afferents in vitro evokes a period of GABAergic mediated inhibition that rapidly shifts membrane potential to near ECl (∼−72 mV) (Fig. 1A) (Jahnsen, 1986; Aizenman & Linden, 1999; Zheng & Raman, 2009). IPSP amplitude then exhibits a frequency-dependent depression within the first 10 stimuli, resulting in a slow depolarizing shift in membrane potential during a stimulus train (Fig. 1A) (Telgkamp & Raman, 2002; Pedroarena & Schwarz, 2003; Telgkamp et al. 2004; Pedroarena, 2010). This is important, in that full recovery of IT from inactivation and the reactivation of IH are both voltage and time dependent (Raman et al. 2000; Perez-Reyes, 2003; Iftinca et al. 2006; Biel et al. 2009; Zheng & Raman, 2009) and thus require a minimal level and duration of membrane hyperpolarization. The role for IT or IH in generating a rebound response is thus questionable given that the relatively small shift in membrane potential induced by IPSPs (from ∼−60 mV to −72 mV) may not substantially increase current availability (Iftinca et al. 2006; Zheng & Raman, 2009). Depression of the IPSP during repetitive stimulation also introduces a gradual depolarizing shift in membrane potential that will further inactivate any T-type current that does become available, and will deactivate IH. Thus, consideration of the hyperpolarization present during an input train needs to include the extent of IPSP depression. The duration of a hyperpolarizing stimulus is also important, in that the magnitude of a rebound response increases in relation to the duration of a hyperpolarizing current pulse or the number of presynaptic stimuli, even in the presence of a progressive decrease in IPSP amplitude during a stimulus train (Aizenman & Linden, 1999; De Schutter & Steuber, 2009; Pedroarena, 2010; Sangrey & Jaeger, 2010). Therefore we chose 100–300 ms as representative durations for hyperpolarizing stimuli that we could relate to the patterns of Purkinje cell firing described by Shin et al. (2007), invoked either as a 100 Hz train of 10–30 synaptic stimuli or as varying durations of voltage or current commands.
Figure 4. Purkinje cell-evoked IPSCs in DCN cells exhibit a differential sensitivity to HCN and calcium channel blockers.
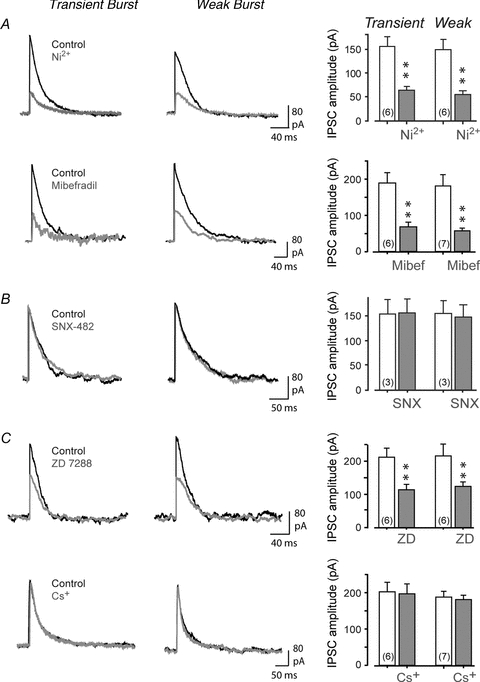
Shown on the left are representative and superimposed recordings of the effects of calcium or HCN channel blockers on evoked IPSCs in Transient or Weak Burst cells. Bar plots of drug effects on mean IPSC amplitudes are shown on the right. Stimulus intensities were set to ∼60% of that required to evoke a maximal IPSC. A, perfusion of Ni2+ (300 μm) or mibefradil (1 μm) significantly reduces the amplitude of the evoked IPSC. B, focal ejection of SNX-482 (200 nm) has no effect on IPSCs. C, perfusion of ZD-7288 (40 μm) significantly reduces IPSC amplitude while Cs+ (2 mm) has no effect. Sample numbers for mean values in bar plots are shown in brackets.
Figure 1. Physiological levels of membrane hyperpolarization evoke T-type current in DCN cells.
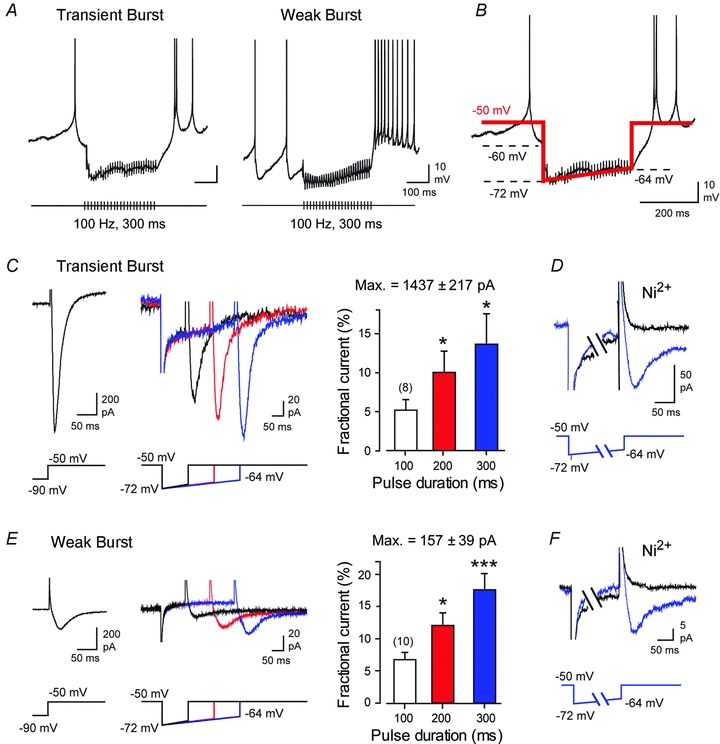
A, representative recordings of IPSP depression and rebound frequency increases in Transient and Weak Burst cells in response to 100 Hz stimulus trains of Purkinje cell input (30 pulses). B, step-ramp commands for voltage clamp recordings simulate the onset and subsequent depression of IPSPs during a 10–30 pulse 100 Hz train of Purkinje cell input. C–F, whole-cell voltage clamp recordings from Transient Burst (C and D) or Weak Burst (E and F) neurons. Steady-state step commands from −90 to −50 mV (left) measure the maximum availability of a transient inward T-type current. On the right are superimposed representative recordings from the same cells evoked by step-ramp commands of 100, 200 and 300 ms duration over the voltage range shown in B. Mean bar plots of the associated step-ramp commands are shown on the right of (C) and (E). All stimuli are followed by an inward transient current that increases in amplitude with the duration of hyperpolarization. D and F, representative recordings of transient inward currents in Transient and Weak Burst cells for a 300 ms step-ramp command are blocked by 300 μm Ni2+. Recordings in D and F are truncated for display purposes. Currents evoked by step commands in (C–F) are averages of 5 traces and step-ramp commands of 10 traces. Sample numbers for mean values in bar plots of C and E are shown in brackets.
We also compared the response of inhibitory inputs on the output of the two rebound burst phenotypes of large diameter DCN cells identified as Transient Burst cells or Weak Burst cells, as these firing patterns have been shown to reflect differences in the magnitude of at least T-type currents (Molineux et al. 2006, 2008; Hurlock et al. 2009; Tadayonnejad et al. 2009, 2010). As previously shown, single evoked IPSPs did not differ in amplitude or duration between Transient and Weak Burst cells, suggesting at least no qualitative difference in synaptic inhibition (Tadayonnejad et al. 2010). In comparing the effects of 100 Hz stimulus input trains we further found no significant difference in the voltage peak attained by the IPSP in either Transient (n = 6) or Weak Burst cells (n = 7; P = 0.128) or in the rate of depression of IPSP amplitude (tau of depression: Transient Burst IPSP, 102 ± 18.4 ms, n = 6; Weak Burst IPSP, 114 ± 20.1 ms, n = 7, P = 0.32). Thus under our stimulus conditions, IPSP amplitude in both Transient and Weak Burst cells began to depress within 20–30 ms of the beginning of the stimulus train and decreased to a similar and relatively stable value of ∼–64 ± 0.42 mV by 30 stimuli (n = 18, Transient and Weak Burst data combined). With these parameters we could then move to presenting a voltage clamp protocol that reproduced these voltage changes postsynaptically to test for the ability to evoke IT or IH in either Transient or Weak Burst cells.
IT and IH are activated by physiologically relevant membrane hyperpolarizations
To best control the postsynaptic voltage that determines ion channel availability, we used whole-cell voltage clamp to simulate membrane hyperpolarizations at physiological temperatures (32–34°C). In each case we first established the total IT available by stepping from −90 mV to −50 mV (Fig. 1C and E). As found previously, the magnitude of IT available for activation fell into two significantly different groups, with mean values of 1437 ± 217 pA (n = 8) and 157 ± 39 pA (n = 10, P < 0.001), a difference characteristic of Transient and Weak Burst cells, respectively (Molineux et al. 2006; Molineux et al. 2008; Tadayonnejad et al. 2010). Step-ramp commands were then used under voltage clamp to simulate the onset and subsequent depression of IPSPs that occurs during a 30 pulse 100 Hz train of Purkinje cell input. To increase the degree of inactivation of IT expected during resting conditions, we set the holding potential at −50 mV, a value just below spike threshold in DCN cells (threshold of −47.4 ± 0.65 mV, n = 14). The step-ramp command consisted of a step from −50 mV to −72 mV followed by a slow ramp depolarization that rose to a total value of −64 mV over 300 ms (Fig. 1B).
IT
We found that in the presence of 2 mm Cs+ to block IH and 30 μm Cd2+ to block high voltage-activated (HVA) calcium channels, a fast activating and fast inactivating inward current consistently followed step-ramp commands delivered to Transient (n = 8) or Weak Burst cells (n = 10) (Fig. 1C and E). The step-ramp command evoked 10–140 pA of transient inward current in Transient Burst cells even following a 100 ms stimulus. The magnitude of inward current evoked then increased with the duration of the ramp command despite the steady depolarization mimicking IPSP depression, reaching values of 50–500 pA at 300 ms in Transient Burst cells (n = 8, one-way repeated measures ANOVA) (Fig. 1C). Fast inactivating currents recorded in Weak Burst cells were smaller in amplitude, but again were reliably evoked after a 100 ms step-ramp command, and increased with the duration of the hyperpolarizing stimulus (2.4–16 pA at 100 ms, 6–40 pA at 300 ms, n = 10, one-way repeated measures ANOVA) (Fig. 1E). Finally, perfusion of 300 μm Ni2+ as a Cav3 calcium channel blocker in DCN cells (Molineux et al. 2008) eliminated the fast inactivating current in both Transient (n = 3) and Weak Burst (n = 3) cells (Fig. 1D and F).
We note that the step-ramp protocol used here is not a perfect mimic of the hyperpolarization associated with a train of IPSPs. Apart from being applied only at the soma, it does not include the last depolarizing shift that characterizes the return of membrane potential at the end of an IPSP train to the resting state (Fig. 1A and B). However, under voltage clamp we are constrained by the need to eliminate capacitance transients with an immediate step back to the resting level in order to isolate the ionic currents. The currents obtained with this approach can thus be expected to represent the maximum current available at the end of the hyperpolarizing stimulus, with potential for some loss of IT through inactivation during the return to rest. With these limitations in mind, the currents evoked by step-ramp commands represented only a small fraction of the total current available in each cell (Fig. 1C and E). Thus, for a 100 ms step-ramp command, the evoked current in Weak Burst cells was only ∼7% of the maximum current available and then increased to ∼18% of maximum after a 300 ms command. Although the absolute current evoked in Transient Burst cells was larger than for Weak Burst cells, it reflected an even smaller fraction of the total current available for individual cells of this burst phenotype (∼5% for 100 ms and ∼14% for 300 ms). Notably, this range of IT availability is within that previously reported for DCN cells following steady-state voltage commands to near ECl for 500 ms (Zheng & Raman, 2009). We also found that the availability of IT was highly sensitive to preconditioning and test potentials in the physiological range. For instance, little current was recorded if membrane potential was not first stepped close to ECl or was returned at the end of a step-ramp command to only −60 mV (data not shown), both results consistent with the known steep relationship for inactivation and activation curves for T-type calcium channels (Perez-Reyes, 2003; Molineux et al. 2005; Iftinca et al. 2006). However, given that calcium channels underlying the rebound response are thought to be distributed to dendritic membranes of DCN cells (Muri & Knopfel, 1994; Gauck et al. 2001; Zhang et al. 2004; Pugh & Raman, 2008) we expect that the magnitude of IT recorded here may underestimate the true effectiveness of a train of IPSPs that synapse in dendritic regions (Aizenman & Linden, 1999).
IH
To determine the extent to which IH can be activated by physiologically relevant hyperpolarizations, we repeated the above tests to examine the properties of Cs+-sensitive current at 32–34°C. The conditions required to isolate IH prevented us from first identifying Transient and Weak Burst cell phenotypes, but we did not detect any differences in the amount of Cs+-sensitive current between cells. The half-activation voltage for specific isoforms of HCN channels can also be altered by cyclic nucleotide binding (Biel et al. 2009), but we found no difference in voltage dependence for recordings made with or without ATP added to the pipette (n = 6 with ATP, n = 8 without ATP, P > 0.05). For these reasons all data on IH were combined. To first examine steady-state properties and the maximum IH available, voltage commands of 1.5 s were delivered from a holding potential of −50 mV in −10 mV steps to −140 mV and 2 mm Cs+ perfused to calculate Cs+-sensitive currents by subtracting test from control responses (Fig. 2A and B). These recordings revealed a Cs+-sensitive inward current that was slow activating and non-inactivating, reaching a steady-state peak within ∼1 s of stimulus onset (Fig. 2A). Initial activation of whole-cell current was detected at ∼−60 mV, with activation increasing with membrane hyperpolarization to a stable peak by ∼−140 mV (Va = −92.1 ± 2.4, n = 14) (Fig. 2A and B). Of specific potential relevance to rebound responses was an inward tail current of up to 1 nA (upon return from −140 mV) at the end of command steps that deactivated over 500 ms (Fig. 2A).
Figure 2. Physiological levels of hyperpolarization evoke IH in DCN neurons.
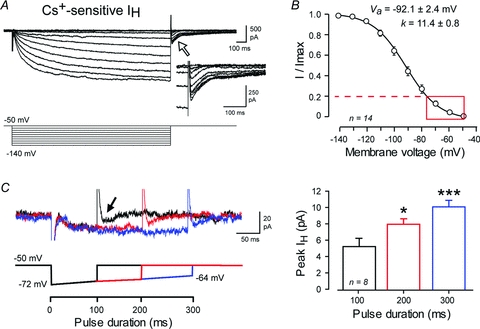
A, whole-cell recordings at physiological temperature of steady-state Cs+-sensitive current (IH) evoked by 10 mV steps (1.5 s) from a holding potential of −50 mV. The inset is an expanded view of the Cs+-sensitive tail current evoked following release of step commands (at time indicated by open arrow). B, mean steady-state activation plot for Cs+ sensitive inward current calculated from the amplitude of tail currents. The overlaid red box and dashed line denote the fraction of maximum current available for hyperpolarizations in the physiological range (−50 to −75 mV). C, superimposed recordings of Cs+-sensitive currents in response to step-ramp commands of 100–300 ms at the indicated voltages in a representative DCN cell. Arrow indicates the tail current evoked by a 100 ms stimulus. Bar plots of the mean peak tail currents evoked by step-ramp commands are shown at right. Currents represent averages of 5 traces for steady-state commands in A and 10 traces for step-ramp commands in C. Capacitance artefacts in A and C are truncated.
To more directly test the ability for physiological stimuli to activate IH, we delivered the step-ramp commands that simulate hyperpolarizations induced by 100 Hz trains of IPSPs (100–300 ms). These tests also revealed the slow activation of an inward current of 4–15 pA that was detectable even during 100 ms stimuli as a slowly activating inward current (n = 8, Fig. 2C). The end of a 100 ms pulse was followed by an inward tail current of up to 12 pA, which for a 300 ms stimulus could be detected for up to 300 ms. Furthermore, the amplitude of tail currents significantly increased for step-ramp commands between 100 and 300 ms despite the slow ramp depolarization that would be predicted to deactivate IH (Fig. 2C, one-way repeated measures ANOVA). Comparison of these values to those evoked at steady state (Fig. 2A) indicate that the IH evoked by step-ramp commands is at a level corresponding to ≤20% of the maximum IH available for activation (Fig. 2B).
IT and IH have distinct roles in controlling rebound responses
It is known that increasing the magnitude or duration of hyperpolarizations will increase the rebound response of DCN cells (Aizenman & Linden, 1999; Tadayonnejad et al. 2009; Hoebeek et al. 2010; Pedroarena, 2010; Sangrey & Jaeger, 2010; Bengtsson et al. 2011). Yet given that the magnitudes of IT and IH activated by physiological stimuli represent only a small fraction of the maximum current available, it raises questions as to their potential role in modifying rebound spike output (Zheng & Raman, 2009). We thus tested the role of IT and IH in modifying the rebound response following modest current pulse injections of up to 300 ms. In this regard, previous studies emphasize that the voltage and time dependence of IT and IH dictate that even small differences in the absolute voltage during a preconditioning pulse can substantially change current availability (Aizenman & Linden, 1999; Tadayonnejad et al. 2009; Zheng & Raman, 2009; Sangrey & Jaeger, 2010; Steuber et al. 2011). The profile of IH activation presents a further issue when comparing a hyperpolarizing response at different time points, since IH introduces a depolarizing sag that will continually change the membrane voltage over time (Aizenman & Linden, 1999; Raman et al. 2000). Since the depolarizing sag stabilized by 150–200 ms after the onset of a current pulse, we adjusted the level of hyperpolarizing current injection to generate a constant membrane voltage shift to −72 mV by 300 ms, providing an equivalent response from which to compare rebounds between cells.
A resting level of tonic spike discharge was first established by adjusting bias current injection to set the peak trough of spike AHPs to ∼−60 mV, and a hyperpolarizing current pulse was delivered. We found that hyperpolarization to −72 mV was sufficient to induce a statistically defined increase in rebound firing frequency in all cells examined (Fig. 3A–D). Transient Burst cells exhibited a higher rebound frequency response than Weak Burst cells, attaining a maximum of 397 Hz following a 300 ms prepulse compared to 47 Hz in Weak Burst cells (Fig. 3A, C and D) (expressed as increases in frequency above the initial tonic firing level). To test the roles for IT and IH in the rebound response, we perfused Ni2+ (300 μm) or Cs+ (2 mm) (Fig. 3A). We found that Ni2+ significantly reduced, but did not completely block, rebound increases in firing frequency, with an average reduction after a 300 ms pulse of 47.6 ± 10.5% in Transient Burst cells (n = 8, P = 0.014) and 69.3 ± 18.5% in Weak Burst cells (n = 5, P = 0.04) (Fig. 3C and D). It is important to consider that Ni2+ will also block R-type calcium channels (Randall & Tsien, 1997), which are fast inactivating but considered part of the HVA class of calcium channels. However, we found that pressure ejections of the R-type channel blocker SNX-482 (200 nm) had no effect on the early phase of rebound frequency in either Transient or Weak Burst cells (data not shown; n = 7 for Transient and Weak Burst cells). By comparison, Cs+ (2 mm) significantly reduced rebound frequency in Transient Burst cells by 45.9 ± 16.3% (n = 8, P = 0.037) (Fig. 3C). In 6 of 7 Weak Burst cells, a modest decrease in firing frequency was also observed in the presence of Cs+, but this proved to be not statistically significant in the calculated average (n = 7, P = 0.85) (Fig. 3D). These data revealed that rebound frequency increases in Transient Burst cells result from a combination of IT and IH, while a substantial portion of the rebound frequency increase in Weak Burst cells can be primarily accounted for by IT.
Figure 3. IT and IH have different roles in rebound frequency increases following physiologically relevant hyperpolarizations.
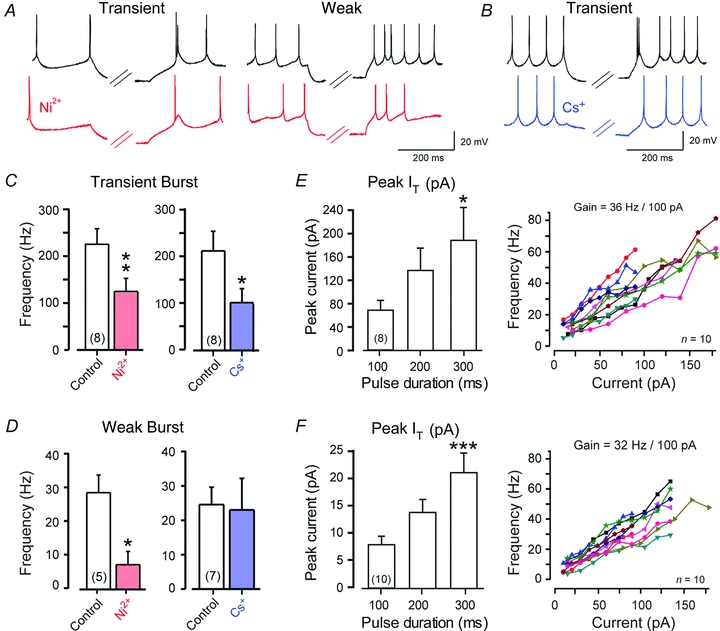
A and B, representative Transient and Weak Burst cell rebound responses immediately following 300 ms hyperpolarizing steps to ∼−72 mV, and the effects of perfusing Ni2+ (A, 300 μm, red traces) or Cs+ (B, 2 mm, blue traces). C and D, bar plots of the average effects of Ni2+ or Cs+ on rebound frequency in Transient (C) or Weak Burst (D) cells indicate a substantial, but incomplete, reduction of rebound frequency increases by either blocker. E and F, a comparison between the absolute values of peak IT recorded in the step-ramp commands of Fig. 1C for Transient (E) and Weak Burst (F) cells to the gain of firing as measured in frequency–current (F–I) plots. The F–I plots of (E) and (F) were calculated from a separate population of cells in response to depolarizing current pulses from a resting level of −60 mV and data from 10 cells are plotted superimposed for comparison. Rebound frequencies in C–D are plotted as frequency increases above the level of tonic firing frequency preceding the stimulus for the immediate phase of the rebound response. Sample numbers for mean values in bar plots are shown in brackets.
We next considered the ability for IT to contribute to rebound bursts evoked by direct stimulation of Purkinje cell inhibitory inputs. At most central synapses, transmitter release from presynaptic terminals is mediated by one or more HVA calcium channels (particularly N-, P/Q- or R-type) (Evans & Zamponi, 2006; Kisilevsky & Zamponi, 2008). However, earlier work suggested that transmitter release at inhibitory synapses in cerebellum incorporates calcium channels that do not fit the pharmacological profile for HVA calcium channels (Doroshenko et al. 1997). Previous work has also reported modulation of synaptic function at the Purkinje to DCN cell synapse by IH (Saitow et al. 2009). It was therefore important to determine if presynaptic function at the Purkinje cell synapse would be affected by blockers of T-type or HCN channels. Figure 4 shows the results of blocking calcium or HCN channels on IPSCs evoked at 60% of the maximal intensity in DCN cells in the presence of glutamate receptor blockers. The T-type calcium channel blockers Ni2+ (300 μm, Transient and Weak Burst cell, n = 6) and mibefradil (1 μm, Transient Burst n = 6, Weak Burst cell n = 7) both substantially reduced the amplitude of evoked IPSCs (Fig. 4A). In contrast, the R-type calcium channel blocker SNX-482 had no effect (200 nm, Transient and Weak Burst cells n = 3) (Fig. 4B), indicating that the effects of Ni2+ and mibefradil on the IPSC were not mediated through R-type calcium channels. Interestingly, a reduction of the IPSC was also obtained with the putatively selective HCN channel blocker ZD-7288 (40 μm, Transient and Weak Burst cells, n = 6) but not Cs+ (2 mm, Transient Burst n = 6, Weak Burst n = 7) (Fig. 4C). Since ZD-7288 has also been reported to block Cav3 calcium channels (Sanchez-Alonso et al. 2008), these results are consistent with a role for T-type calcium but not HCN channels in contributing to GABA release at the Purkinje cell synapse.
Given these results, it was not possible to directly assess the contribution of IT to rebound frequencies generated following trains of synaptic input. We previously found a high correlation between the maximal amount of IT recorded in DCN cells and the rebound frequencies generated from preconditioning pulses to −90 mV (Molineux et al. 2008). We thus examined whether the amount of IT recorded in response to step-ramp commands under voltage clamp (see Fig. 1C–F) could be predicted to increase the firing frequency following a train of inhibitory input. The mean values of IT recorded following 100–300 ms commands under voltage clamp revealed currents less than ∼250 pA for Transient Burst cells and ∼25 pA for Weak Burst cells (Fig. 3E and F). Although these are relatively small currents in absolute magnitude, they may well be relevant in the context of the gain of firing frequency in DCN cells (Raman et al. 2000). We examined frequency–current (F–I) plots and found a high gain of firing in response to depolarizing current injections in both Transient and Weak Burst cells (Fig. 3E and F). Specifically, Transient Burst cells exhibited a gain of 36 ± 2.8 Hz/100 pA (n = 10) and Weak Burst cells 32 ± 2.1 Hz/100 pA (n = 10, P = 0.31). A comparison of the peak values of IT generated by step-ramp commands to these steep F–I relations predict that even a small amount of IT could have a measureable effect on rebound firing frequency (Fig. 3E and F). Thus, despite substantial inactivation of IT near resting potential (Zheng & Raman, 2009), a physiologically relevant membrane hyperpolarization can promote sufficient recovery from inactivation as to generate IT capable of contributing to increases in rebound frequency in DCN cells. The effects of ∼12 pA of IH recorded following a 100 ms step-ramp hyperpolarization (Fig. 2) is also predicted to increase rebound frequency, although the influence of this current proves to be more complex (considered in further detail below).
IH mediated reductions in first spike latency
It has been shown that synaptically evoked periods of inhibition produce a graded change in the latency to rebound firing in DCN cells (Tadayonnejad et al. 2009; Pedroarena, 2010; Sangrey & Jaeger, 2010), and that applying Cs+ to block IH increases FSL, revealing a new role for IH (Sangrey & Jaeger, 2010). Since the resident level of tonic firing in a DCN cell will establish a given ISI at rest, distinguishing an actual change from this value following a hyperpolarizing stimulus requires that one normalize the measure of FSL to preceding tonic activity. Thus to identify a change in FSL, we expressed the latency to rebound as a ratio of FSL to the ISI of preceding tonic spike discharge. In this way a genuine reduction in FSL is indicated by a decrease in the FSL/ISI ratio, while an increase in FSL compared to the tonic firing ISI is indicated by an increase in the FSL/ISI ratio. We found that following a hyperpolarizing stimulus of −72 mV for 300 ms, the FSL/ISI ratio was 0.39 ± 0.05 (n = 8) in Transient Burst cells and 0.37 ± 0.05 (n = 7) in Weak Burst cells. Comparisons between different preconditioning pulses confirmed that, unlike rebound spike frequency, different durations of physiologically relevant hyperpolarizations generate equivalent shifts in the FSL/ISI ratio in Transient and Weak burst DCN cells.
To determine if the FSL/ISI ratio depends on the duration of presynaptic spike trains (as has been reported for thalamic neurons; Person & Perkel, 2005), we delivered 5–30 pulse 100 Hz repetitive stimulus trains to Purkinje cell afferents. Stimulus intensity was adjusted to evoke ∼60% of the maximal IPSC in each cell (Fig. 5A). As found for current-evoked hyperpolarizations, the FSL/ISI ratio following a five-pulse inhibitory stimulus train was equivalent in Transient and Weak Burst cells, with an average value of 0.63 ± 0.06 (n = 6) in Transient Burst cells and 0.69 ± 0.05% (n = 7) in Weak Burst cells (P = 0.60) (Fig. 5B). Increasing the number of stimuli produced a graded reduction in the FSL/ISI ratio with the number of stimuli, and to a similar extent in both Transient and Weak Burst cells (Fig. 5B). Thus, 30 stimuli reduced the FSL/ISI ratio from that following five stimuli by 43.3 ± 11.45% to a value of 0.35 ± 0.05 (n = 13; Transient and Weak Burst cell data combined) (Fig. 5B). We further verified that these values did not reflect any dialysis under whole-cell conditions, as the range of FSL/ISI for this intensity and stimulus numbers were equivalent when recorded under on-cell recording conditions (data not shown).
Figure 5. IH but not IT underlies a graded shift in FSL following physiologically relevant hyperpolarizations.
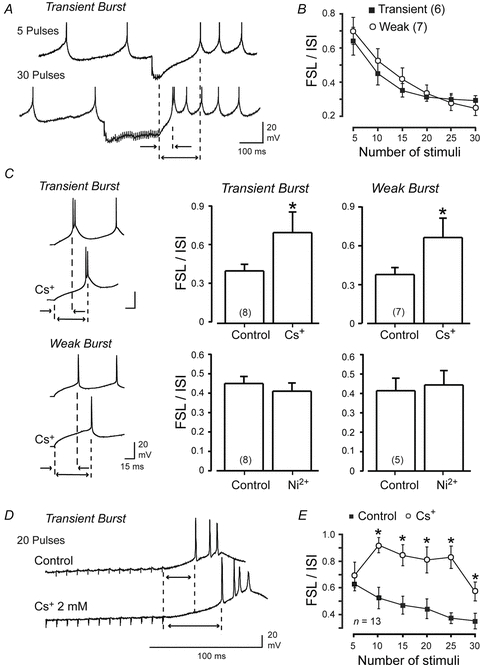
A, representative recordings from a Transient Burst cell of the change in FSL following 100 Hz trains of either 5 or 30 IPSPs evoked by stimulating Purkinje cell afferents (60% of maximal intensity). Dashed lines indicate the FSL as measured from the end of a stimulus train to the first spike of the rebound response, indicating a substantial reduction in FSL with more repetitive stimuli. B, mean values of the FSL/ISI ratio in response to varying numbers of stimuli delivered to Purkinje cell afferents at 100 Hz reveal an equivalent decrease in FSL/ISI in Transient and Weak Burst cells. C, representative recordings of Transient and Weak Burst cell rebound responses (left) following a current-evoked membrane hyperpolarization to −72 mV (300 ms) reveals an increase in FSL with external Cs+ (2 mm). Bar plots of the FSL/ISI ratio following 300 ms hyperpolarizations to −72 mV are shown at right before and after perfusion of Cs+ (2 mm) or Ni2+ (300 μm). D, recordings of the rebound response from a Transient Burst cell following a 100 Hz 20 pulse train of IPSPs showing an increase in FSL upon perfusing Cs+ (2 mm). E, a plot of the mean FSL/ISI for evoked trains of IPSPs and its block by perfusion of Cs+ (2 mm). Transient and Weak Burst cell data are combined in E. Sample numbers for mean values in bar plots of C are shown in brackets.
Since both IH and IT generate inward currents it is possible that both could reduce FSL following periods of inhibition. When we applied Cs+ (2 mm) to cells preconditioned with a hyperpolarizing current pulse to −72 mV for 300 ms, the FSL/ISI ratio increased by 67.9 ± 13.23% (n = 8) in Transient Burst cells and 63.3 ± 17.21% (n = 7) in Weak Burst cells (Fig. 5C). However, perfusion of Ni2+ (300 μm) to cells undergoing the same level of preconditioning had no significant effect on the FSL/ISI ratio in either Transient or Weak Burst cells (Fig. 5C). These tests are important in establishing that IH and IT, two currents that increase in availability with hyperpolarization, contribute to distinct aspects of rebound firing in DCN cells.
We next examined the effects of blocking IH on the FSL/ISI ratio invoked by repetitive presynaptic stimuli. Perfusing Cs+ (2 mm) confirmed a role for IH in regulating the FSL following 100 Hz trains of synaptically evoked inhibition, as indicated by a significant increase in the FSL/ISI ratio of the rebound response (Fig. 5D and E). Given that results were equivalent for Transient and Weak Burst cells, the results of Cs+ tests were combined in the analysis for Fig. 5E. Interestingly, the effects of Cs+ were prominent for 10 stimuli or greater, as would be predicted for a gradual activation of IH during an inhibitory stimulus (Fig. 5E).
Modelling reveals explicit roles for IH and IT on rebound responses
The results to this point indicate distinct roles for IH and IT in controlling some aspects of rebound responses (i.e. FSL) but synergistic roles for others (i.e. frequency) depending on rebound burst phenotype. Previous work established a differential expression of Cav3 channel isoforms in DCN cells, with a correlation between the expression of Cav3.1 and a Transient Burst phenotype and the expression of Cav3.3 channels and a Weak Burst phenotype (Molineux et al. 2006). These differences also extend to the magnitude and time course of IT, with up to 7 times more current that activates ∼2 times faster in Transient compared to Weak Burst cells at −50 mV (Molineux et al. 2008). IT recordings presented here in response to physiological levels of hyperpolarization again reiterate these differences (Fig. 1C and E). By comparison, voltage clamp recordings of IH and measurements of IH-dependent shifts in FSL indicated equivalent levels of HCN channel activation in Transient and Weak Burst cells (Figs 2 and 5C). Yet, Cs+ proved to block almost 50% of the rebound frequency increase in Transient but not Weak Burst cells (Fig. 3A). The ability for IH to increase rebound frequency in only Transient Burst cells may then indicate a process that reflects the properties of IT and its influence on spike frequency.
A more complete understanding of the factors underlying these results is difficult to obtain through recordings and pharmacological block, since any effects on membrane resistance and time constant can make it difficult to definitively identify the role of each current. To gain a better understanding of the effects of each current on rebound responses, we developed a model of the DCN neuron to test hypotheses arising from slice experiments. A two-compartment model was sufficient to reproduce many important spike features of DCN neurons, including the DAP, AHPs, rebound bursting and a graded FSL (Fig. 6). The dendritic compartment contained conductances for leak, a slow potassium current, and T-type calcium current when applicable. As a full voltage clamp analysis of IT has not yet been reported for DCN cells, we used parameters for activation and inactivation kinetics of IT from a previous study in Purkinje cells (Hildebrand et al. 2009). The somatic compartment had fast sodium, fast potassium, leak, and HCN conductances (see Methods). The activation curve for IH determined in the voltage clamp experiments in Fig. 2 was used and time constants for current activation were chosen to generate currents with similar kinetics. Holding current was adjusted to sustain a tonic firing rate of 10 Hz at a resting potential (AHP troughs) of ∼−65 mV. To determine the effect of HCN and T-type conductances on rebound bursts, IH and IT were either included or omitted from the model and FSL/ISI and burst frequency was measured in response to a wide range of hyperpolarization depths (8 increments to a final voltage of −77 mV at 300 ms) and durations (50–300 ms; 50 ms increments) (Fig. 6). Burst frequency was measured as the peak frequency within the initial 100 ms of the spike response following release from hyperpolarization.
Figure 6. A reduced model reveals distinct functions for IT and IH in the rebound response.
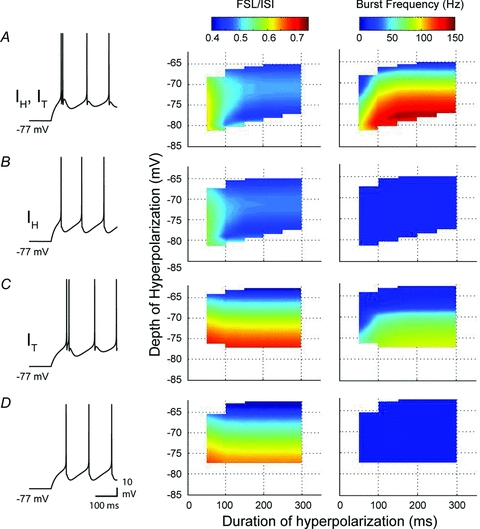
A–D, simulations were performed using two-compartment models containing different combinations of IT and IH, with representative spike output indicated by records at left. Three dimensional plots on the right compare FSL/ISI and burst frequency between models for various depths and durations of a preceding hyperpolarization. Note that as the magnitude or duration of a preceding hyperpolarization increases, the FSL/ISI progressively shortens and burst frequency increases in a model that contains both IT and IH (A). Removing IT (B) blocks rebound burst frequency increases without affecting FSL. Removing IH (C) substantially alters the FSL profile but also reduces burst frequency. Removing both IT and IH (D) retains the same FSL profile as IT alone in C, but entirely removes any increase in rebound frequency.
IT and IH in FSL and rebound frequency
Analysis of the rebound bursts produced by different combinations of conductances again revealed distinct roles for IH and IT in controlling FSL and rebound frequency increases. When IH was present in the model, longer and deeper hyperpolarizations generated shorter FSL/ISI ratios (Fig. 6A and B). However, when only IT was present (Fig. 6C), or when both IT and IH were removed (Fig. 6D), stronger hyperpolarizations generated a progressively longer FSL, as predicted for a shift in FSL determined primarily by the time constant and return of membrane potential to spike threshold from a hyperpolarized state. These results then confirmed the lack of influence of IT on FSL and the unique role IH has in controlling FSL following a hyperpolarization.
In contrast, a rebound increase in spike frequency could only be generated in the model in the presence of IT (Fig. 6A and C). Interestingly, when both IH and IT were present, burst frequencies of up to 147 Hz were produced (Fig. 6A). But when only IT was included in the model, the peak rebound frequency dropped by 36% to 93.0 Hz (Fig. 6C). This result was consistent with those shown in Fig. 3A, where application of Cs+ reduced rebound frequency in Transient Burst cells. However, no frequency increase was seen when only IH was present (Fig. 6B), suggesting that the decrease in rebound frequency observed upon removing IH does not reflect a direct contribution by IH to burst generation, but rather a secondary effect that increases the efficacy of IT.
Synergy in actions of IH and IT in rebound spike responses
We note that blocking IH had significant effects on membrane resistance and time constant in in vitro current clamp recordings. Likewise, the omission of IH from the model increased the membrane time constant. We hypothesized that by decreasing the membrane time constant, IH decreases the inactivation of IT during the rebound burst, allowing for greater burst frequency. To test this, a new model (DCNlowC,IT) was generated without IH but with a lower somatic capacitance (from 3 μF cm−2 to 1.5 μF cm−2) to retain a similar time constant to the model containing both IT and IH (DCNIH,IT) (Fig. 7A), allowing us to distinguish the effects of time constant from the voltage dependence and activation kinetics of IH.
Figure 7. The effect of IH on time constant acts synergistically with IT to increase rebound burst frequency.
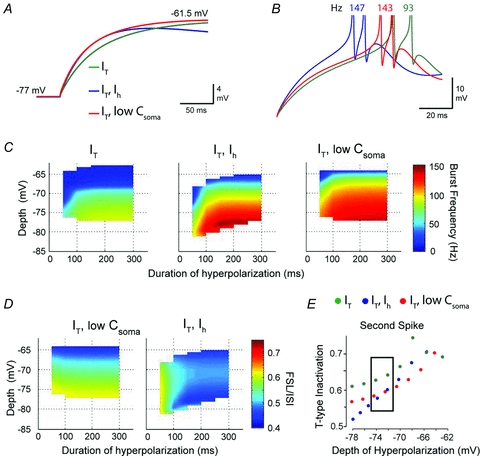
A, an expanded view of the charging profiles of the model during repolarization from −77 mV shown superimposed for the indicated model parameters. IT was held constant while somatic membrane capacitance was lowered in a model lacking IH (low Csoma, red trace) until the membrane time constant was similar to a model that contains IH (blue trace). B, overlays of rebound bursts from each of the models in A to compare the effects of replacing IH with a reduction in membrane capacitance. In the absence of IH, a decrease in capacitance (DCNlowC,IT model, red trace) increases burst frequency and decreases FSL compared to models containing IT alone (DCNIT model, green trace). The model containing IH and IT (DCNIH,IT model, blue trace) still exhibits a shorter FSL than DCNlowC,IT, but similar burst frequency, indicating that the effect of IH on burst frequency is due to a reduction in time constant. C, three dimensional plots compare the relationship between burst frequency and hyperpolarization depth and duration for DCNIT (left) and DCNIH,IT (centre) models to the DCNlowC,IT model (right). Data for DCNIT and DCNIH,IT are reproduced from Fig. 6 for comparison. Note that DCNIH,IT and DCNlowC,IT reach the same peak frequency of 150 Hz, which is significantly higher than the rebound frequency of DCNIT. These results demonstrate that a reduction in time constant increases burst frequency in the absence of IH. D, the voltage–FSL relationship for DCNlowC,IT does not exhibit the same inverse relationship with hyperpolarization depth and duration as DCNIH,IT (DCNIH,IT data reproduced from Fig. 6 for comparison), indicating that the voltage dependence and kinetics of IH are required to decrease FSL in response to strong hyperpolarization. E, a comparison of the amount of IT inactivation during the rebound (at the onset of the second spike of the rebound response) between the three models shows that DCNlowC,IT and DCNIH,IT exhibit less T-type current inactivation than DCNIT. For hyperpolarization near ECl (−72 mV in vitro, black box), DCNlowC,IT and DCNIH,IT exhibit similar levels of T-type channel inactivation, emphasizing the importance of membrane time constant on the degree of IT inactivation during the rebound burst.
Our simulations showed that reducing membrane capacitance (DCNlowC,IT model) enabled high frequency bursts similar to a model with IH and IT intact (DCNIH,IT model) (Fig. 7B and C), but was unable to reproduce the membrane voltage–FSL relationship normally generated by IH (Figs 6A and B and 7D). These results indicate that IH enhances the ability of IT to generate rebound bursts, but is not directly responsible for producing the increased burst frequency. To further determine why a change in time constant affects burst frequency, we examined the inactivation variable for IT at the voltage threshold of the second spike in the burst (Fig. 7E). At the time of the second spike, the model with IT alone (DCNIT) showed more T-type inactivation than models that included either IH (DCNIH,IT) or lower somatic capacitance (DCNlowC,IT) for all voltages less than −70 mV (Fig. 7E). Furthermore, for hyperpolarizations near ECl (∼−72 mV), DCNIH,IT and DCNlowC,IT displayed similar levels of T-type inactivation (Fig. 7E, black box). Shortening the membrane time constant thus decreases the extent of T-type inactivation during the first interspike interval of the rebound response, allowing IT to generate higher rebound frequencies.
IH increases precision of FSL
The ability for central neurons to integrate inhibitory and excitatory synaptic input and produce consistent spike output (spike precision) is critical for the proper operation of neuronal networks. DCN neurons are innervated by a multitude of inhibitory and excitatory synapses, each of which is capable of providing independent inputs to the cell (Gauck & Jaeger, 2000, 2003; Uusisaari & De Schutter, 2011). Furthermore, DCN neurons have been shown to respond with a high degree of precision to synaptic input (Gauck & Jaeger, 2000, 2003). We wished to examine the role of IH in controlling the precision of spike output in the presence of noisy synaptic input. Excitatory and inhibitory synaptic conductances were added to the model and conductance values were varied using an Ornstein–Uhlenbeck noise process (see Methods). For each model (DCNIT, DCNIH,IT, and DCNlowC,IT), 100 simulations with noisy synaptic conductances were performed. Holding current was adjusted to provide a mean tonic firing frequency of 10 Hz prior to presenting a hyperpolarization to −75 mV for 300 ms. The population of first spike latencies was then measured to assess the precision of rebound spike output (Fig. 8A).
Figure 8. IH controls the precision of the first spike following a hyperpolarization.
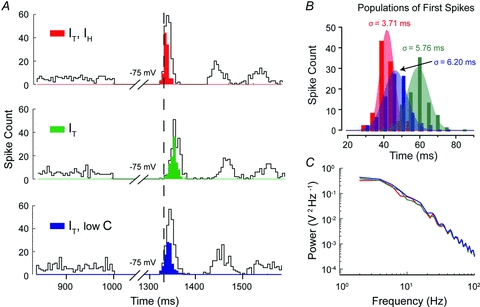
A, histograms of spike count in three different models for 100 simulations with stochastic excitatory and inhibitory synaptic conductances to measure the relative timing (latency) and precision (standard deviation) of the population of first spikes generated following a hyperpolarizing stimulus. Open bins denote the total spike count, while the first spike (following release from inhibition) of each of the 100 simulations in the population of rebound responses are denoted by filled bins. Simulations had a baseline firing rate of 10 Hz for 1000 ms preceding a hyperpolarization to −75 mV for 300 ms (the full extent of the preceding 1000 ms stimulus was truncated for display purposes). The mean latency and standard deviation of FSL between three models incorporating the indicated combinations of IT, IH or low capacitance (low C) indicate that IH has an effect on both the timing and precision of the population of first spikes. B, Gaussian fits of the population of first spikes for each model shown in A demonstrates that when IH is present (red), FSL falls over a narrow distribution and with small standard deviation (depicted by the breadth of overlying coloured Gaussian fits) compared to either the model lacking IH (green) or the low capacitance model (blue). C, a comparison of the power spectral density for a 10 s simulation at −75 mV for each of the three models shows that there is no significant difference in the frequency content of membrane fluctuations between the models that could account for the difference in spike precision in A and B.
DCNIH,IT had the shortest mean FSL (41.8 ± 0.12 ms) whereas DCNIT produced the longest mean FSL of 59.1 ± 0.47 ms (Fig. 8A and B). Finally, DCNlowC,IT produced a mean latency of 46.4 ± 0.24 ms. When each of the first spike populations were fit with a Gaussian distribution, the spike population recorded from simulations in the DCNIH,IT model showed the most precision, as measured by the standard deviation of FSL (σ = 3.71 ms), whereas FSL was more variable for both DCNlowC,IT (σ = 6.20) and DCNIT (σ = 5.76 ms) models (Fig. 8B). We note that these differences in spike precision were not due to differences in the frequency content of membrane fluctuations, as no differences in the power spectral density were observed between the three models (Fig. 8C). Furthermore, the amplitudes of membrane fluctuations in each model were similar (SD: DCNIH,IT = 0.94 mV; DCNIT = 1.030 mV; DCNlowC,IT = 1.15 mV), indicating that the observed increase in precision was due to the presence of IH. These results thus demonstrate that IH increases the precision of the first rebound spike through a decrease in membrane time constant rather than a direct depolarizing effect of IH.
Discussion
The ability for membrane hyperpolarizations to trigger a rebound increase in spike frequency in DCN cells has been of long standing interest in the field of cerebellar physiology. Extensive work in vitro has implicated IT and IH as primary contributing factors in controlling the frequency and latency of rebound responses. However, experimental protocols used to test these currents in the past have raised questions as to whether Purkinje cell-evoked GABAergic IPSPs are sufficient to allow IT and IH to provide meaningful contributions to rebound responses. Results of the current study indicate that hyperpolarizations relevant to inhibitory synaptic input (−72 mV) indeed evoke sufficient recovery of IT from inactivation and activation of IH to allow these currents to contribute to the immediate phase of rebound responses. Moreover, IT and IH prove to have distinct roles in controlling rebound frequency, FSL and spike precision.
Role of IT in rebound responses
The primary issue regarding a role for IT in rebound responses is that DCN cells intrinsically generate a tonic spike output that is expected to inactivate a substantial portion of T-type calcium channels. As inhibitory synaptic inputs provide only a small hyperpolarizing shift (from ∼−60 to −72 mV) it may not be sufficient to recover enough T-type channels from inactivation to contribute to rebounds (Iftinca et al. 2006). Here we reassessed the contribution of IT to rebound responses using hyperpolarizations no greater than the established reversal of evoked IPSPs (−72 mV). These tests confirmed that T-type currents exhibit detectable recovery from inactivation even during 100 ms hyperpolarizations, and somewhat surprisingly, continue to increase in magnitude over a 300 ms test pulse despite a simulated depression of IPSP amplitude. The final level of IT recovery from inactivation represented less than ∼18% of the maximal current available to a given cell (Fig. 1C and E). This value is slightly higher than those reported by Zheng & Raman (2009) who came to an estimate of 9.3% availability of IT in mouse DCN cells for similar voltage shifts. However, it is possible that both values underestimate the total current available in the region of dendritic inhibitory synapses where Cav3 channels have been proposed to be localized (Aizenman & Linden, 1999; Pugh & Raman, 2006). Given the high gain of firing in DCN cells, we predict that even a small change in T-type current availability will be physiologically relevant to rebound responses. Indeed, a contribution by IT to rebound frequency was supported by application of a T-type channel blocker during current-evoked hyperpolarizations to −72 mV, or removal of IT from a model of DCN cells (Figs 3A and 6B and C). It is important to note that we never obtained a complete block of the rebound spike frequency increase, with only ∼50% reduction in rebound frequency for Transient Burst cells upon block of IT, and a slightly greater influence in Weak Burst cells. This could reflect the relative block of ITin situ, as 300 μm Ni2+ is just above the reported IC50 for expressed Cav3.1 and Cav3.3 calcium channels (Lee et al. 1999). On the other hand, it may indicate that the immediate phase of a rebound response must incorporate additional factors beyond IT as an excitatory influence. Our own assessment revealed an additional influence of IH on rebound frequency in Transient Burst cells (considered further below). Thus at this time we can state that T-type calcium current represents a primary, but not exclusive, ionic factor responsible for generating the increase in spike frequency during the immediate phase of a rebound response in DCN cells.
Role of IH in rebound responses
The potential expression of IH in DCN cells was recognized in some of the first intracellular recordings in vitro (Jahnsen, 1986; Aizenman & Linden, 1999). Initial voltage clamp work in dissociated DCN cells indicated partial activation of IH at ∼−90 mV and only ∼3 pA at −58 mV, a value that would seem to be outside a required degree of activation (Raman et al. 2000). However, recent work using blockers of IH in the slice preparation reported a novel role for this current in driving a graded reduction in FSL as hyperpolarizations were increased (Sangrey & Jaeger, 2010). The whole-cell voltage clamp analysis presented here was also conducted on intact DCN cells at physiological temperatures, revealing a voltage dependence that encompassed the range of membrane potentials relevant to inhibitory inputs. Thus, under these conditions, IH was detectable at ∼−60 mV, with the end of a step command followed by an inward tail current with a duration relevant to the time frame of rebound responses. IH was also detected during the initial 100 ms of the more subtle step-ramp command, along with a tail current at the end of the pulse. Moreover (as for IT), the magnitude of IH continued to increase over 300 ms despite an expected deactivation of IH during the depolarization of the ramp command. The absolute values of IH evoked by these stimuli were small, ranging from ∼5–10 pA over 100–300 ms (only ∼20% of the total current available in a given cell). However, a series of tests incorporating current clamp recordings and modelling confirmed that IH is activated in response to physiological stimuli and contributes to three different aspects of rebound responses: (i) spike frequency increases, (ii) FSL, and (iii) spike precision.
(i) IH and rebound spike frequency increases
Unlike the substantial differences shown to exist for IT between Transient and Weak Burst cells, IH was expressed to a similar extent in all cells examined here. Nevertheless, IH had a significant effect on the frequency of rebound discharge in at least Transient Burst cells. Selective modulation of membrane parameters in DCN cell models illustrated that the effect of IH on spike frequency can be accounted for by its influence on the membrane time constant (Figs 6 and 7). Specifically, a reduction of the time constant by IH decreases the extent of T-type inactivation that can occur during the first ISI of the burst, maintaining IT for activation of the spike response (Fig. 7E). Although we cannot entirely rule out a contribution by the IH tail current to the rebound depolarization, at this time the effect on time constant is sufficient to account for our results. IH thus acts synergistically with IT to increase rebound frequency in Transient Burst cells by at least 60% of the total response. As short term facilitation and depression are known to be highly frequency dependent (Dittman et al. 2000), the ability for IH to increase the range of frequencies generated during rebound responses (compare Fig. 6A and C) could have important physiological consequences at downstream postsynaptic targets of DCN cells (Babalyan & Fanardzhyan, 1991).
We found that IH also produced a small increase in the rebound frequency of 6 of 7 Weak Burst cells, although this proved to be statistically insignificant on average. It is thus conceivable that IH has the same effect on rebound frequency in Weak Burst cells, but to a lesser extent due to the lower density of T-type current and lower burst frequency. Weak Burst cells also express Cav3.3 channels, which have a slower rate of activation and inactivation than the Cav3.1 channels expressed in Transient Burst cells (Fig. 1E) (Iftinca et al. 2006; Molineux et al. 2008). Therefore, the absolute effect that IH has on T-type channel inactivation through the membrane time constant appears to differ between Transient and Weak Burst cells. We expect that the reported lack of effect of IH on rebound frequency in an earlier study (Sangrey & Jaeger, 2010) derived from combining data obtained from all cells. Our results would support the need to distinguish between cells exhibiting a Transient or Weak Burst rebound phenotype, with data obtained here on the differential role for IH and IT in rebound responses adding to the list of distinctions between cells that exhibit these characteristics (Tadayonnejad et al. 2010).
A potential interaction between IH and IT has been considered in other cell types, but with different end results. In cortical layer III pyramidal cells, HCN1 channels colocalize with Cav3.2 channels in the presynaptic terminals of glutamatergic inputs, but act to increase Cav3 inactivation by depolarizing the terminal (Huang et al. 2011). Similar effects of IH increasing IT inactivation have been reported for dendrites of hippocampal CA1 pyramidal neurons (Tsay et al. 2007). However, here we show that the effect of IH on membrane time constant instead enhances rebound frequency in DCN cells by decreasing the extent IT inactivation (Fig. 7E).
(ii) IH role in FSL
Consideration of FSL in DCN cells is important in that these cells receive primarily inhibitory input and thus must respond to a period of disinhibition (i.e. a pause in the firing rate of Purkinje cells) with spike output within a minimal period of time. The timing of the first spike in a burst can also carry the most information about stimulus features and thus convey key information to downstream neurons (Kepecs & Lisman, 2003; Oswald et al. 2004; Oswald et al. 2007). Here, we confirmed that IH controls FSL of the rebound in DCN neurons (Sangrey & Jaeger, 2010) and in response to physiologically relevant levels of stimuli.
It is important to note that an increase in IH acts to decrease FSL, creating an inverse relationship between voltage and FSL. We have encountered a similar influence of IH on FSL in cerebellar Purkinje cells (M. L. Molineux, unpublished observations), and an inverse voltage–FSL relationship has been reported in thalamic and some auditory neurons (Heil, 2004; Person & Perkel, 2005), indicating that IH may subserve this function in many different cell types. Interestingly, the nature of IH control over FSL is opposite to that encountered in cells that express transient A-type potassium currents, in which FSL increases directly with the extent of hyperpolarization (Shibata et al. 2000; Heil, 2004; Molineux et al. 2005). The computational demands that require opposite forms of control over FSL through expression of either IH or IA are uncertain at this time. However, given that DCN cells must transpose the magnitude of an inhibitory input to an excitatory output, an inverse voltage–FSL relationship produced by IH is well positioned to translate a larger inhibitory stimulus to spike output with a shorter delay. In cerebellum, the control IH exerts over FSL could also have implications for stimulus training. For example, conditioned and unconditioned stimuli during eyeblink conditioning must be separated by at least 100 ms for training to occur (Schneiderman & Gormezano, 1964; Smith, 1968; Ohyama et al. 2003). By shortening the time needed for a DCN neuron to generate a rebound burst, IH may decrease the minimum stimulus interval required for training. It would be interesting to determine whether animal models lacking IH exhibit a longer minimum stimulus interval during training.
(iii) IH role in spike precision
In previous studies, DCN neurons have been shown to respond to a given pattern of synaptic input with high temporal precision from one presentation to the next, particularly during periods of disinhibition (Gauck & Jaeger, 2000). Our work now indicates that IH acts to increase the temporal precision of the first spike of the rebound, resulting in a highly reproducible response to membrane hyperpolarizations. Furthermore, this increase in precision is due to the direct depolarizing effects of IH, rather than the indirect effects observed on rebound frequency brought about through a change in time constant. By increasing the ability for DCN neurons to respond in a stereotyped manner to the same input, IH may then act to ensure the fidelity of cerebellar computations that require high temporal precision (D'Angelo & De Zeeuw, 2009; De Zeeuw et al. 2011). Interestingly, IH has also been shown to increase temporal precision of rebound bursts in hippocampal CA1 pyramidal neurons (Orban et al. 2006; Gastrein et al. 2011) and cortical layer V pyramidal neurons (Kole et al. 2006), indicating a physiological action relevant to many other cell types.
Remaining factors
The current study reveals that IT and IH make distinct contributions to a rebound response, but also that neither can fully account for the immediate increase in rebound frequency. It is thus important to recognize that these are only two of the potential factors that contribute to the early phase of rebound responses examined here (Molineux et al. 2008; Pedroarena, 2010; Sangrey & Jaeger, 2010; Tadayonnejad et al. 2010). For instance, we previously described differences in the ionic basis and extent of potassium-mediated AHPs between Transient and Weak Burst cells (Molineux et al. 2008; Tadayonnejad et al. 2010). Zheng & Raman (2009) described a decrease in the level of [Ca2+]i during membrane hyperpolarizations that may temporarily reduce the availability of calcium to drive spike-associated AHPs during the rebound, and thus increase rebound spike frequency. Recent work proposed an additional contribution by persistent sodium current to the rebound depolarization (Sangrey & Jaeger, 2010). Although no evidence has yet been reported in DCN cells, an interesting possibility is a potential depolarizing shift in ECl during repetitive inputs (Staley et al. 1995), providing an additional depolarizing influence. Related to this could be the potential influence of a GABA-mediated conductance change and the time required for transmitter reuptake and related recovery from a train of IPSPs. At this time it is difficult to predict how this might contribute and over what time frame, but the potential exists for a synaptically evoked conductance change to modify the membrane time constant and thus rebound frequency.
Of particular importance when considering the response of DCN cells to inhibition is the synchrony of Purkinje cell inputs that would be required to generate sustained inhibition. As shown in Shin et al. (2007), high frequency simple spike firing in Purkinje cells is most often grouped into long and regular firing patterns. If high frequency firing reflects sensory input in Purkinje cells through parallel fibres, it is feasible that a population of Purkinje cells could be caused to generate these regular patterns simultaneously. Indeed, paired recordings of Purkinje cells show that 35% of simple spikes are synchronized between cells located <100 μm apart, and this percentage of synchronization is expected to be present in the converging population of Purkinje cells onto a DCN neuron (Shin & De Schutter, 2006). A greater degree of synchronization is also observed for short ISIs, likely to be due to firing rate co-modulation (Shin & De Schutter, 2006). As the longest regular patterns generated by Purkinje cells comprise short ISIs, a sufficient proportion of Purkinje cell inputs may synchronize for 100–300 ms to produce a level of inhibition capable of invoking the contributions of IT and IH shown here.
It is expected that at least HVA calcium channels will contribute to the late phase of the rebound (Zheng & Raman, 2009), a component of the DCN cell response to hyperpolarization that has received little attention to date. It is even possible that the early phase of rebound could be influenced by HVA calcium channels, activated either directly or subsequent to a low threshold calcium spike (Zheng & Raman, 2009). In this regard, a new study reported the existence of a nifedipine-sensitive, non-inactivating (L-type) calcium current in DCN cells which contributes to the late phase of a rebound frequency increase and is potentiated by mGluR receptor activation (Zheng & Raman, 2011). It should be noted that this L-type current is distinct from the currents studied here in that 5 μm nifedipine does not block the T-type mediated LVA calcium spike underlying the initial component of a rebound response (Molineux et al. 2006). Nevertheless, the finding of a novel contribution by a HVA calcium current to the generation of rebound responses emphasizes the complexity of ionic factors that may contribute to DCN cell output.
Finally, the current study was restricted to examining the patterns inherent to simple spike firing recorded in Purkinje cells of anaesthetized rats (Shin et al. 2007). Work in vivo suggests that detectable rebound responses in DCN cells are even more effectively evoked using the intraburst frequencies typical of Purkinje cell complex spike responses (Hoebeek et al. 2010; Bengtsson et al. 2011). By using 100 Hz stimulation and considering the effects of IPSP depression during more prolonged input durations, the current study essentially tested the minimal stimulus that might influence IT and IH activation. Inhibitory input from Purkinje cells evoked by complex spike discharge may then be even more effective in recruiting IT and IH contributions to rebound responses, particularly given a greater predicted degree of synchronization (Shin & De Schutter, 2006). Complex spike driven input may also reflect mGluR activation by climbing fibre collaterals to DCN cells (Zheng & Raman, 2011), a ligand-gated receptor contribution that was not examined here. The difficulty of predicting how different spike trains will contribute to rebound responses in vivo emphasizes the need for future work to consider the output of DCN cells in response to Purkinje cell spike trains inherent to awake and unanaesthetized animals.
Acknowledgments
We gratefully acknowledge Mirna Kruskic for expert technical assistance. R.W.T. is an Alberta Innovates-Health Solutions Scientist. Salary support was provided by AHFMR Studentships (R.T., D.A., J.D.T.E., W.H.M., M.L.M.), CIHR MSc and Doctoral Studentships (J.D.T.E., W.H.M., M.L.M.), T. Chen Fong Studentships (D.A., J.D.T.E.) and an AIMS and Izaak Walton Killam Trust award (D.A.). This work was funded through grants from CIHR (R.W.T.).
Glossary
Abbreviations
- AHP
afterhyperpolarization
- CV
coefficient of variation
- DAP
depolarizing afterpotential
- DCN
deep cerebellar nuclei
- fAHP
fast afterhyperpolarization
- FSL
first spike latency
- HCN
hyperpolarizing activated cyclic-nucleotide
- HVA
high voltage-activated
- IA
A-type potassium current
- IH
HCN current
- IPSP
inhibitory postsynaptic potential
- ISI
interspike interval
- IT
T-type calcium current
- LVA
low voltage-activated
- sAHP
slow afterhyperpolarization
Author contributions
R.W.T. conceived the study, R.T., J.D.T.E., D.A., W.H.M. and M.L.M. designed, conducted and/or analysed electrophysiology experiments. R.T. carried out current-clamp experiments, D.A. voltage-clamp experiments and J.D.T.E. and W.H.M. designed and analysed computational experiments. R.W.T., J.D.T.E. and D.A. wrote the manuscript. Experiments were carried out in the Hotchkiss Brain Institute of the University of Calgary.
References
- Aizenman CD, Linden DJ. Regulation of the rebound depolarization and spontaneous firing patterns of deep nuclear neurons in slices of rat cerebellum. J Neurophysiol. 1999;82:1697–1709. doi: 10.1152/jn.1999.82.4.1697. [DOI] [PubMed] [Google Scholar]
- Aizenman CD, Manis PB, Linden DJ. Polarity of long-term synaptic gain change is related to postsynaptic spike firing at a cerebellar inhibitory synapse. Neuron. 1998;21:827–835. doi: 10.1016/s0896-6273(00)80598-x. [DOI] [PubMed] [Google Scholar]
- Alvina K, Ellis-Davies G, Khodakhah K. T-type calcium channels mediate rebound firing in intact deep cerebellar neurons. Neuroscience. 2009;158:635–641. doi: 10.1016/j.neuroscience.2008.09.052. [DOI] [PMC free article] [PubMed] [Google Scholar]
- Alvina K, Walter JT, Kohn A, Ellis-Davies G, Khodakhah K. Questioning the role of rebound firing in the cerebellum. Nat Neurosci. 2008;11:1256–1258. doi: 10.1038/nn.2195. [DOI] [PMC free article] [PubMed] [Google Scholar]
- Babalyan AL, Fanardzhyan VV. Electrophysiologic properties of red nucleus neurons in the rat brain slices. Neurophysiology. 1991;23:454–461. [PubMed] [Google Scholar]
- Bengtsson F, Ekerot CF, Jorntell H. In vivo analysis of inhibitory synaptic inputs and rebounds in deep cerebellar nuclear neurons. PLoS One. 2011;6:1–12. doi: 10.1371/journal.pone.0018822. e18822. [DOI] [PMC free article] [PubMed] [Google Scholar]
- Biel M, Wahl-Schott C, Michalakis S, Zong X. Hyperpolarization-activated cation channels: from genes to function. Physiol Rev. 2009;89:847–885. doi: 10.1152/physrev.00029.2008. [DOI] [PubMed] [Google Scholar]
- Cattaneo A, Maffei L, Morrone C. Two firing patterns in the discharge of complex cells encoding different attributes of the visual stimulus. Exp Brain Res. 1981;43:115–118. doi: 10.1007/BF00238819. [DOI] [PubMed] [Google Scholar]
- Czubayko U, Sultan F, Thier P, Schwarz C. Two types of neurons in the rat cerebellar nuclei as distinguished by membrane potentials and intracellular fillings. J Neurophysiol. 2001;85:2017–2029. doi: 10.1152/jn.2001.85.5.2017. [DOI] [PubMed] [Google Scholar]
- D'Angelo E, De Zeeuw CI. Timing and plasticity in the cerebellum: focus on the granular layer. Trends Neurosci. 2009;32:30–40. doi: 10.1016/j.tins.2008.09.007. [DOI] [PubMed] [Google Scholar]
- De Schutter E, Steuber V. Patterns and pauses in purkinje cell simple spike trains: experiments, modeling and theory. Neuroscience. 2009;162:816–826. doi: 10.1016/j.neuroscience.2009.02.040. [DOI] [PubMed] [Google Scholar]
- De Zeeuw CI, Hoebeek FE, Bosman LW, Schonewille M, Witter L, Koekkoek SK. Spatiotemporal firing patterns in the cerebellum. Nat Rev Neurosci. 2011;12:327–344. doi: 10.1038/nrn3011. [DOI] [PubMed] [Google Scholar]
- Dittman JS, Kreitzer AC, Regehr WG. Interplay between facilitation, depression, and residual calcium at three presynaptic terminals. J Neurosci. 2000;20:1374–1385. doi: 10.1523/JNEUROSCI.20-04-01374.2000. [DOI] [PMC free article] [PubMed] [Google Scholar]
- Doroshenko PA, Woppmann A, Miljanich G, Augustine GJ. Pharmacologically distinct presynaptic calcium channels in cerebellar excitatory and inhibitory synapses. Neuropharmacology. 1997;36:865–872. doi: 10.1016/s0028-3908(97)00032-4. [DOI] [PubMed] [Google Scholar]
- Drummond GB. Reporting ethical matters in The Journal of Physiology: standards and advice. J Physiol. 2009;587:713–719. doi: 10.1113/jphysiol.2008.167387. [DOI] [PMC free article] [PubMed] [Google Scholar]
- Eggermont JJ. Is there a neural code? Neurosci Biobehav Rev. 1998;22:355–370. doi: 10.1016/s0149-7634(97)00021-3. [DOI] [PubMed] [Google Scholar]
- Evans RM, Zamponi GW. Presynaptic Ca2+ channels – integration centers for neuronal signaling pathways. Trends Neurosci. 2006;29:617–624. doi: 10.1016/j.tins.2006.08.006. [DOI] [PubMed] [Google Scholar]
- Gardette R, Debono M, Dupont JL, Crepel F. Electrophysiological studies on the postnatal development of intracerebellar nuclei neurons in rat cerebellar slices maintained in vitro. I. Postsynaptic potentials. Brain Res. 1985a;351:47–55. doi: 10.1016/0165-3806(85)90230-5. [DOI] [PubMed] [Google Scholar]
- Gardette R, Debono M, Dupont JL, Crepel F. Electrophysiological studies on the postnatal development of intracerebellar nuclei neurons in rat cerebellar slices maintained in vitro. II. Membrane conductances. Brain Res. 1985b;352:97–106. doi: 10.1016/0165-3806(85)90091-4. [DOI] [PubMed] [Google Scholar]
- Gastrein P, Campanac E, Gasselin C, Cudmore R, Bialowas A, Carlier E, Fronzaroli-Molinieres L, Ankri N, Debanne D. The role of hyperpolarization-activated cationic current (Ih) in spike-time precision and intrinsic resonance in cortical neurons in vitro. J Physiol. 2011;589:3753–3773. doi: 10.1113/jphysiol.2011.209148. [DOI] [PMC free article] [PubMed] [Google Scholar]
- Gauck V, Jaeger D. The control of rate and timing of spikes in the deep cerebellar nuclei by inhibition. J Neurosci. 2000;20:3006–3016. doi: 10.1523/JNEUROSCI.20-08-03006.2000. [DOI] [PMC free article] [PubMed] [Google Scholar]
- Gauck V, Jaeger D. The contribution of NMDA and AMPA conductances to the control of spiking in neurons of the deep cerebellar nuclei. J Neurosci. 2003;23:8109–8118. doi: 10.1523/JNEUROSCI.23-22-08109.2003. [DOI] [PMC free article] [PubMed] [Google Scholar]
- Gauck V, Thomann M, Jaeger D, Borst A. Spatial distribution of low- and high-voltage-activated calcium currents in neurons of the deep cerebellar nuclei. J Neurosci. 2001;21:RC158. doi: 10.1523/JNEUROSCI.21-15-j0004.2001. [DOI] [PMC free article] [PubMed] [Google Scholar]
- Heil P. First-spike latency of auditory neurons revisited. Curr Opin Neurobiol. 2004;14:461–467. doi: 10.1016/j.conb.2004.07.002. [DOI] [PubMed] [Google Scholar]
- Hildebrand ME, Isope P, Miyazaki T, Nakaya T, Garcia E, Feltz A, Schneider T, Hescheler J, Kano M, Sakimura K, Watanabe M, Dieudonne S, Snutch TP. Functional coupling between mGluR1 and Cav3.1 T-type calcium channels contributes to parallel fiber-induced fast calcium signaling within Purkinje cell dendritic spines. J Neurosci. 2009;29:9668–9682. doi: 10.1523/JNEUROSCI.0362-09.2009. [DOI] [PMC free article] [PubMed] [Google Scholar]
- Hoebeek FE, Witter L, Ruigrok TJ, De Zeeuw CI. Differential olivo-cerebellar cortical control of rebound activity in the cerebellar nuclei. Proc Natl Acad Sci U S A. 2010;107:8410–8415. doi: 10.1073/pnas.0907118107. [DOI] [PMC free article] [PubMed] [Google Scholar]
- Huang Z, Lujan R, Kadurin I, Uebele VN, Renger JJ, Dolphin AC, Shah MM. Presynaptic HCN1 channels regulate Cav3.2 activity and neurotransmission at select cortical synapses. Nat Neurosci. 2011;14:478–486. doi: 10.1038/nn.2757. [DOI] [PMC free article] [PubMed] [Google Scholar]
- Huguenard JR. Low-threshold calcium currents in central nervous system neurons. Annu Rev Physiol. 1996;58:329–348. doi: 10.1146/annurev.ph.58.030196.001553. [DOI] [PubMed] [Google Scholar]
- Hurlock EC, Bose M, Pierce G, Joho RH. Rescue of motor coordination by Purkinje cell-targeted restoration of Kv3.3 channels in Kcnc3-null mice requires Kcnc1. J Neurosci. 2009;29:15735–15744. doi: 10.1523/JNEUROSCI.4048-09.2009. [DOI] [PMC free article] [PubMed] [Google Scholar]
- Iftinca M, McKay BE, Snutch TP, McRory JE, Turner RW, Zamponi GW. Temperature dependence of T-type calcium channel gating. Neuroscience. 2006;142:1031–1042. doi: 10.1016/j.neuroscience.2006.07.010. [DOI] [PubMed] [Google Scholar]
- Jacobson GA, Lev I, Yarom Y, Cohen D. Invariant phase structure of olivo-cerebellar oscillations and its putative role in temporal pattern generation. Proc Natl Acad Sci U S A. 2009;106:3579–3584. doi: 10.1073/pnas.0806661106. [DOI] [PMC free article] [PubMed] [Google Scholar]
- Jahnsen H. Extracellular activation and membrane conductances of neurones in the guinea-pig deep cerebellar nuclei in vitro. J Physiol. 1986;372:149–168. doi: 10.1113/jphysiol.1986.sp016002. [DOI] [PMC free article] [PubMed] [Google Scholar]
- Jahnsen H, Llinas R. Ionic basis for the electro-responsiveness and oscillatory properties of guinea-pig thalamic neurones in vitro. J Physiol. 1984;349:227–247. doi: 10.1113/jphysiol.1984.sp015154. [DOI] [PMC free article] [PubMed] [Google Scholar]
- Kepecs A, Lisman J. Information encoding and computation with spikes and bursts. Network. 2003;14:103–118. [PubMed] [Google Scholar]
- Kepecs A, Wang XJ, Lisman J. Bursting neurons signal input slope. J Neurosci. 2002;22:9053–9062. doi: 10.1523/JNEUROSCI.22-20-09053.2002. [DOI] [PMC free article] [PubMed] [Google Scholar]
- Kisilevsky AE, Zamponi GW. Presynaptic calcium channels: structure, regulators, and blockers. Handb Exp Pharmacol. 2008:45–75. doi: 10.1007/978-3-540-74805-2_3. [DOI] [PubMed] [Google Scholar]
- Kole MH, Hallermann S, Stuart GJ. Single Ih channels in pyramidal neuron dendrites: properties, distribution, and impact on action potential output. J Neurosci. 2006;26:1677–1687. doi: 10.1523/JNEUROSCI.3664-05.2006. [DOI] [PMC free article] [PubMed] [Google Scholar]
- Lee JH, Gomora JC, Cribbs LL, Perez-Reyes E. Nickel block of three cloned T-type calcium channels: low concentrations selectively block α1H. Biophys J. 1999;77:3034–3042. doi: 10.1016/S0006-3495(99)77134-1. [DOI] [PMC free article] [PubMed] [Google Scholar]
- Llinas R, Muhlethaler M. Electrophysiology of guinea-pig cerebellar nuclear cells in the in vitro brain stem-cerebellar preparation. J Physiol. 1988;404:241–258. doi: 10.1113/jphysiol.1988.sp017288. [DOI] [PMC free article] [PubMed] [Google Scholar]
- McCormick DA, Pape HC. Properties of a hyperpolarization-activated cation current and its role in rhythmic oscillation in thalamic relay neurones. J Physiol. 1990;431:291–318. doi: 10.1113/jphysiol.1990.sp018331. [DOI] [PMC free article] [PubMed] [Google Scholar]
- McDonough SI, Bean BP. Mibefradil inhibition of T-type calcium channels in cerebellar purkinje neurons. Mol Pharmacol. 1998;54:1080–1087. doi: 10.1124/mol.54.6.1080. [DOI] [PubMed] [Google Scholar]
- McKay BE, Engbers JD, Mehaffey WH, Gordon GR, Molineux ML, Bains JS, Turner RW. Climbing fiber discharge regulates cerebellar functions by controlling the intrinsic characteristics of purkinje cell output. J Neurophysiol. 2007;97:2590–2604. doi: 10.1152/jn.00627.2006. [DOI] [PubMed] [Google Scholar]
- Molineux ML, Fernandez FR, Mehaffey WH, Turner RW. A-type and T-type currents interact to produce a novel spike latency-voltage relationship in cerebellar stellate cells. J Neurosci. 2005;25:10863–10873. doi: 10.1523/JNEUROSCI.3436-05.2005. [DOI] [PMC free article] [PubMed] [Google Scholar]
- Molineux ML, McRory JE, McKay BE, Hamid J, Mehaffey WH, Rehak R, Snutch TP, Zamponi GW, Turner RW. Specific T-type calcium channel isoforms are associated with distinct burst phenotypes in deep cerebellar nuclear neurons. Proc Natl Acad Sci U S A. 2006;103:5555–5560. doi: 10.1073/pnas.0601261103. [DOI] [PMC free article] [PubMed] [Google Scholar]
- Molineux ML, Mehaffey WH, Tadayonnejad R, Anderson D, Tennent AF, Turner RW. Ionic factors governing rebound burst phenotype in rat deep cerebellar neurons. J Neurophysiol. 2008;100:2684–2701. doi: 10.1152/jn.90427.2008. [DOI] [PubMed] [Google Scholar]
- Muri R, Knopfel T. Activity induced elevations of intracellular calcium concentration in neurons of the deep cerebellar nuclei. J Neurophysiol. 1994;71:420–428. doi: 10.1152/jn.1994.71.1.420. [DOI] [PubMed] [Google Scholar]
- Ohyama T, Nores WL, Murphy M, Mauk MD. What the cerebellum computes. Trends Neurosci. 2003;26:222–227. doi: 10.1016/S0166-2236(03)00054-7. [DOI] [PubMed] [Google Scholar]
- Orban G, Kiss T, Erdi P. Intrinsic and synaptic mechanisms determining the timing of neuron population activity during hippocampal theta oscillation. J Neurophysiol. 2006;96:2889–2904. doi: 10.1152/jn.01233.2005. [DOI] [PubMed] [Google Scholar]
- Oswald AM, Chacron MJ, Doiron B, Bastian J, Maler L. Parallel processing of sensory input by bursts and isolated spikes. J Neurosci. 2004;24:4351–4362. doi: 10.1523/JNEUROSCI.0459-04.2004. [DOI] [PMC free article] [PubMed] [Google Scholar]
- Oswald AM, Doiron B, Maler L. Interval coding. I. Burst interspike intervals as indicators of stimulus intensity. J Neurophysiol. 2007;97:2731–2743. doi: 10.1152/jn.00987.2006. [DOI] [PubMed] [Google Scholar]
- Pedroarena CM. Mechanisms supporting transfer of inhibitory signals into the spike output of spontaneously firing cerebellar nuclear neurons in vitro. Cerebellum. 2010;9:67–76. doi: 10.1007/s12311-009-0153-1. [DOI] [PubMed] [Google Scholar]
- Pedroarena CM, Schwarz C. Efficacy and short-term plasticity at GABAergic synapses between Purkinje and cerebellar nuclei neurons. J Neurophysiol. 2003;89:704–715. doi: 10.1152/jn.00558.2002. [DOI] [PubMed] [Google Scholar]
- Perez-Reyes E. Molecular physiology of low-voltage-activated T-type calcium channels. Physiol Rev. 2003;83:117–161. doi: 10.1152/physrev.00018.2002. [DOI] [PubMed] [Google Scholar]
- Person AL, Perkel DJ. Unitary IPSPs drive precise thalamic spiking in a circuit required for learning. Neuron. 2005;46:129–140. doi: 10.1016/j.neuron.2004.12.057. [DOI] [PubMed] [Google Scholar]
- Pugh JR, Raman IM. Potentiation of mossy fiber EPSCs in the cerebellar nuclei by NMDA receptor activation followed by postinhibitory rebound current. Neuron. 2006;51:113–123. doi: 10.1016/j.neuron.2006.05.021. [DOI] [PubMed] [Google Scholar]
- Pugh JR, Raman IM. Mechanisms of potentiation of mossy fiber EPSCs in the cerebellar nuclei by coincident synaptic excitation and inhibition. J Neurosci. 2008;28:10549–10560. doi: 10.1523/JNEUROSCI.2061-08.2008. [DOI] [PMC free article] [PubMed] [Google Scholar]
- Raman IM, Gustafson AE, Padgett D. Ionic currents and spontaneous firing in neurons isolated from the cerebellar nuclei. J Neurosci. 2000;20:9004–9016. doi: 10.1523/JNEUROSCI.20-24-09004.2000. [DOI] [PMC free article] [PubMed] [Google Scholar]
- Randall AD, Tsien RW. Contrasting biophysical and pharmacological properties of T-type and R-type calcium channels. Neuropharmacology. 1997;36:879–893. doi: 10.1016/s0028-3908(97)00086-5. [DOI] [PubMed] [Google Scholar]
- Rowland NC, Jaeger D. Responses to tactile stimulation in deep cerebellar nucleus neurons result from recurrent activation in multiple pathways. J Neurophysiol. 2008;99:704–717. doi: 10.1152/jn.01100.2007. [DOI] [PubMed] [Google Scholar]
- Saitow F, Murano M, Suzuki H. Modulatory effects of serotonin on GABAergic synaptic transmission and membrane properties in the deep cerebellar nuclei. J Neurophysiol. 2009;101:1361–1374. doi: 10.1152/jn.90750.2008. [DOI] [PubMed] [Google Scholar]
- Sanchez-Alonso JL, Halliwell JV, Colino A. ZD 7288 inhibits T-type calcium current in rat hippocampal pyramidal cells. Neurosci Lett. 2008;439:275–280. doi: 10.1016/j.neulet.2008.05.016. [DOI] [PubMed] [Google Scholar]
- Sangrey T, Jaeger D. Analysis of distinct short and prolonged components in rebound spiking of deep cerebellar nucleus neurons. Eur J Neurosci. 2010;32:1646–1657. doi: 10.1111/j.1460-9568.2010.07408.x. [DOI] [PMC free article] [PubMed] [Google Scholar]
- Schneiderman N, Gormezano I. Conditioning of the nictitating membrane of the rabbit as a function of Cs-Us interval. J Comp Physiol Psychol. 1964;57:188–195. doi: 10.1037/h0043419. [DOI] [PubMed] [Google Scholar]
- Sherman SM. Tonic and burst firing: dual modes of thalamocortical relay. Trends Neurosci. 2001;24:122–126. doi: 10.1016/s0166-2236(00)01714-8. [DOI] [PubMed] [Google Scholar]
- Shibata R, Nakahira K, Shibasaki K, Wakazono Y, Imoto K, Ikenaka K. A-type K+ current mediated by the Kv4 channel regulates the generation of action potential in developing cerebellar granule cells. J Neurosci. 2000;20:4145–4155. doi: 10.1523/JNEUROSCI.20-11-04145.2000. [DOI] [PMC free article] [PubMed] [Google Scholar]
- Shin SL, De Schutter E. Dynamic synchronization of Purkinje cell simple spikes. J Neurophysiol. 2006;96:3485–3491. doi: 10.1152/jn.00570.2006. [DOI] [PubMed] [Google Scholar]
- Shin SL, Hoebeek FE, Schonewille M, De Zeeuw CI, Aertsen A, De Schutter E. Regular patterns in cerebellar purkinje cell simple spike trains. PLoS One. 2007;2:e485, 1–9. doi: 10.1371/journal.pone.0000485. [DOI] [PMC free article] [PubMed] [Google Scholar]
- Smith MC. CS-US interval and US intensity in classical conditioning of the rabbit's nictitating membrane response. J Comp Physiol Psychol. 1968;66:679–687. doi: 10.1037/h0026550. [DOI] [PubMed] [Google Scholar]
- Staley KJ, Soldo BL, Proctor WR. Ionic mechanisms of neuronal excitation by inhibitory GABAA receptors. Science. 1995;269:977–981. doi: 10.1126/science.7638623. [DOI] [PubMed] [Google Scholar]
- Steriade M, McCormick DA, Sejnowski TJ. Thalamocortical oscillations in the sleeping and aroused brain. Science. 1993;262:679–685. doi: 10.1126/science.8235588. [DOI] [PubMed] [Google Scholar]
- Steuber V, Mittmann W, Hoebeek FE, Silver RA, De Zeeuw CI, Hausser M, De Schutter E. Cerebellar LTD and pattern recognition by Purkinje cells. Neuron. 2007;54:121–136. doi: 10.1016/j.neuron.2007.03.015. [DOI] [PMC free article] [PubMed] [Google Scholar]
- Steuber V, Schultheiss NW, Silver RA, De Schutter E, Jaeger D. Determinants of synaptic integration and heterogeneity in rebound firing explored with data-driven models of deep cerebellar nucleus cells. J Comput Neurosci. 2011;30:633–658. doi: 10.1007/s10827-010-0282-z. [DOI] [PMC free article] [PubMed] [Google Scholar]
- Tadayonnejad R, Anderson D, Molineux ML, Mehaffey WH, Jayasuriya K, Turner RW. Rebound discharge in deep cerebellar nuclear neurons in vitro. Cerebellum. 2010;9:352–374. doi: 10.1007/s12311-010-0168-7. [DOI] [PMC free article] [PubMed] [Google Scholar]
- Tadayonnejad R, Mehaffey WH, Anderson D, Turner RW. Reliability of triggering postinhibitory rebound bursts in deep cerebellar neurons. Channels. 2009;3:1–7. doi: 10.4161/chan.3.3.8872. [DOI] [PubMed] [Google Scholar]
- Telgkamp P, Padgett DE, Ledoux VA, Woolley CS, Raman IM. Maintenance of high-frequency transmission at purkinje to cerebellar nuclear synapses by spillover from boutons with multiple release sites. Neuron. 2004;41:113–126. doi: 10.1016/s0896-6273(03)00802-x. [DOI] [PubMed] [Google Scholar]
- Telgkamp P, Raman IM. Depression of inhibitory synaptic transmission between Purkinje cells and neurons of the cerebellar nuclei. J Neurosci. 2002;22:8447–8457. doi: 10.1523/JNEUROSCI.22-19-08447.2002. [DOI] [PMC free article] [PubMed] [Google Scholar]
- Timmann D, Watts S, Hore J. Failure of cerebellar patients to time finger opening precisely causes ball high-low inaccuracy in overarm throws. J Neurophysiol. 1999;82:103–114. doi: 10.1152/jn.1999.82.1.103. [DOI] [PubMed] [Google Scholar]
- Tsay D, Dudman JT, Siegelbaum SA. HCN1 channels constrain synaptically evoked Ca2+ spikes in distal dendrites of CA1 pyramidal neurons. Neuron. 2007;56:1076–1089. doi: 10.1016/j.neuron.2007.11.015. [DOI] [PMC free article] [PubMed] [Google Scholar]
- Uhlenbeck GE, Ornstein LS. On the theory of the Brownian motion. Physical Review. 1930;36:823–841. [Google Scholar]
- Ulrich D, Huguenard JR. GABAA-receptor-mediated rebound burst firing and burst shunting in thalamus. J Neurophysiol. 1997;78:1748–1751. doi: 10.1152/jn.1997.78.3.1748. [DOI] [PubMed] [Google Scholar]
- Uusisaari M, De Schutter E. The mysterious microcircuitry of the cerebellar nuclei. J Physiol. 2011;589:3441–357. doi: 10.1113/jphysiol.2010.201582. [DOI] [PMC free article] [PubMed] [Google Scholar]
- Uusisaari M, Knopfel T. Functional classification of neurons in the mouse lateral cerebellar nuclei. Cerebellum. 2011 doi: 10.1007/s12311-010-0240-3. (in press) [DOI] [PMC free article] [PubMed] [Google Scholar]
- Uusisaari M, Obata K, Knopfel T. Morphological and electrophysiological properties of GABAergic and non-GABAergic cells in the deep cerebellar nuclei. J Neurophysiol. 2007;97:901–911. doi: 10.1152/jn.00974.2006. [DOI] [PubMed] [Google Scholar]
- Zackowski KM, Thach WT, Jr, Bastian AJ. Cerebellar subjects show impaired coupling of reach and grasp movements. Exp Brain Res. 2002;146:511–522. doi: 10.1007/s00221-002-1191-9. [DOI] [PubMed] [Google Scholar]
- Zamponi GW, Bourinet E, Snutch TP. Nickel block of a family of neuronal calcium channels: subtype- and subunit-dependent action at multiple sites. J Membr Biol. 1996;151:77–90. doi: 10.1007/s002329900059. [DOI] [PubMed] [Google Scholar]
- Zhang W, Shin JH, Linden DJ. Persistent changes in the intrinsic excitability of rat deep cerebellar nuclear neurons induced by EPSPs or IPSP bursts. J Physiol. 2004;561:703–719. doi: 10.1113/jphysiol.2004.071696. [DOI] [PMC free article] [PubMed] [Google Scholar]
- Zheng N, Raman IM. Ca currents activated by spontaneous firing and synaptic disinhibition in neurons of the cerebellar nuclei. J Neurosci. 2009;29:9826–9838. doi: 10.1523/JNEUROSCI.2069-09.2009. [DOI] [PMC free article] [PubMed] [Google Scholar]
- Zheng N, Raman IM. Prolonged postinhibitory rebound firing in the cerebellar nuclei mediated by group I metabotropic glutamate receptor potentiation of L-type calcium currents. J Neurosci. 2011;31:10283–10292. doi: 10.1523/JNEUROSCI.1834-11.2011. [DOI] [PMC free article] [PubMed] [Google Scholar]