Abstract
Objective
To test whether diabetic subjects have enhanced retinal flavoprotein autofluorescence (FA) compared to age-matched controls, through the use of a rapid, non-invasive clinical imaging method.
Methods
Twenty-one diabetic and twenty-one healthy, age-matched control volunteers were subjected to retinal imaging with 1ms flashes of 467nm light. FA for each flash at 535nm was recorded using an electron multiplying charged-coupled device (EMCCD) camera with a 512x512 pixel chip. Average intensity (AI) and average curve width (ACW) of retinal FA were determined by analyzing histograms of pixel intensities plotted for each eye.
Results
When stratified by age, mean AI and ACW levels for diabetics were significantly greater than controls within all three consecutive decades of life studied (p≤0.004 and p≤0.006, respectively). An overall comparison of the mean AI and ACW in all diabetics vs. all controls, with adjustment for age, was consistent with the results found in each age category (p<0.001 for both). Diabetics with retinopathy in at least one eye had significantly greater AI and ACW than diabetics without retinopathy in either eye (p=0.002 and p=0.005, respectively).
Conclusions
FA measures may be clinically useful to rapidly and non-invasively identify diabetic metabolic tissue stress and disease severity. Development of FA technology is likely to result in a tool that will improve diabetes screening and disease management.
Hyperglycemia induces mitochondrial stress and apoptotic cell death in diabetic tissues soon after disease onset and before involvement can be detected by any current clinical diagnostic method.1–6 This suggests that measurement of mitochondrial metabolic activity can serve as an early indicator of the onset of disease.7 Prior to apoptosis, mitochondria exhibit impaired electron transport by energy-generating enzymes in the respiratory chain,1,8 causing increased percentages of flavoproteins in the chain to be oxidized and rendered capable of absorbing blue light and emitting green autofluorescence.9–11 This phenomenon leads to the hypothesis that increased flavoprotein autofluorescence (FA) may be an early indicator of diabetic metabolic tissue stress.
The gold standard diagnostic method for diabetes is the oral glucose tolerance test. However this method is cumbersome and is often avoided by patients.12 Thus, many diabetics may remain undiagnosed until they develop diabetic micro- and macrovascular complications.12,13
We have previously described a non-invasive method of measuring FA to detect early ocular dysfunction due to disease.14 In this study, we compared retinal FA levels in subjects with diabetes, regardless of disease severity or duration, to that of age-matched healthy controls.
Materials and Methods
To measure retinal FA, a modified fundus camera containing 467 nm excitation and 535 nm emission filters (Omega Optical, Brattleboro, VT), two Photometrics 512B back-illuminated electron-multiplying charge-coupled device (EMCCD) cameras (Roper Scientific, Tucson, AZ), and customized computer hardware and software were used, as previously described.14
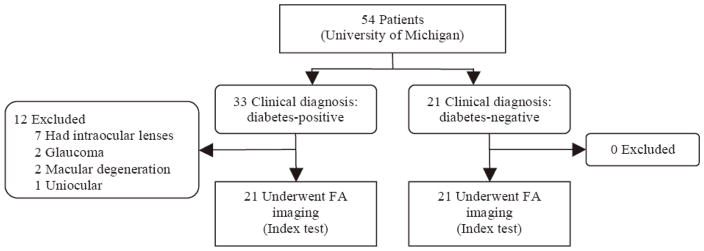
Twenty-one subjects, aged 30–59 years, with established type I or type II diabetes and without ophthalmic disease besides retinopathy were enrolled consecutively between June-September 2007 at the University of Michigan during routine funduscopic examinations (Figure 1). Plasma glucose (obtained at the examination) was assessed by the glucose oxidase method and the hemoglobin A1C (HbA1C) levels were measured by high-performance liquid chromatography. Twenty-one age-matched healthy subjects with normal glucose tolerance,15 normal blood pressure,16 and normal lipid profile,17 according to recognized guidelines and standards, were recruited as the control population (Figure 1).
Figure 1.
Flow of participants in the study. Volunteers were classified as diabetic or non-diabetic by plasma testing, which served as the reference standard. The index test was retinal FA levels of each volunteers’ eyes. Results of the index test were then compared to the reference standard.
This study was approved by the institutional review board (IRB) at the University of Michigan; all subjects gave written informed consent. The study was organized and performed following the STARD Initiative.18,19
After pupillary dilation, one EMCCD camera was used to visualize the macula using RSImage (Roper Scientific, Tucson, AZ) software. For each eye, the second EMCCD camera, interfaced with MetaVue (MDS Analytical Technologies, Toronto, ON) software, was used to capture three to five 535nm FA readings, each induced by a one millisecond, 467 nanometer incident flash. Imaging required five minutes per patient. The depth of focus of the instrument results in capture of FA from all retinal layers.
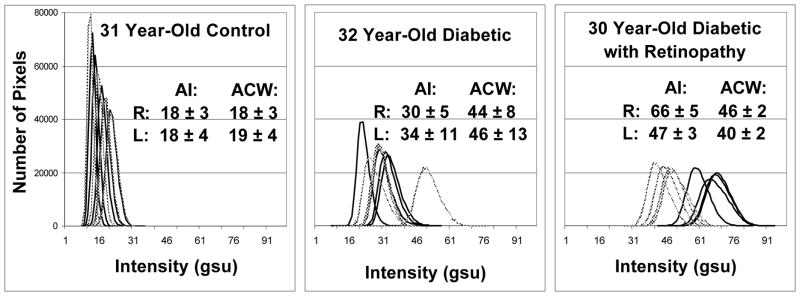
FA images, stored as 512x512 pixel files, were analyzed to produce histograms using MetaVue, Adobe Photoshop CS2 (Adobe Systems, San Jose, CA), and Lispix (National Institute of Standards and Technology, Gaithersburg, MD). The histograms of pixel intensities (Figure 2), ranging from 0 to 256 grayscale units (gsu), were plotted for each eye to yield average intensity (AI) and average curve width (ACW) of retinal FA. All images were independently interpreted by two research associates trained in FA image evaluation. If disagreement was encountered, a consensus reading was performed. At the time of imaging and statistical analysis, the research associates knew if the patient had diabetes, but test review bias was minimized by: 1) not excluding any subjects’ data and 2) relying on objective results of FA testing. Student’s t-test and ANOVA were used to compare AI and ACW of the diabetics and controls. Comparisons of eye-specific AI and ACW levels between diabetics and controls were made using mixed linear regression to adjust for intereye dependency and age (where appropriate). SAS 9.0 software (SAS Institute Inc., Cary, NC) was used for all statistical analyses. A p-value <0.05 was considered significant.
Figure 2.
Retinal FA histograms of pixel intensities collected from 3 age-matched volunteers. Control (left), diabetic without visible retinopathy (center), and long duration diabetic with retinopathy (right). Each panel displays 4 histograms of the right (
 ) and left (–) eye of each volunteer. Right shift of histograms designates increased retinal FA intensity.
Results
Twenty-one diabetics out of 33 consecutive diabetic subjects referred for imaging met the inclusion criteria (Figure 1) and were imaged to determine AI and ACW for each eye. The mean age for diabetics was 44.8±10.0 years (range 30–59 years), the mean documented diabetes duration was 10.5±9.8 years, and the mean HbA1C was 8.5±1.9%. There were six type I and fifteen type II diabetics. Diabetic retinopathy was present in twelve subjects. The mean age for controls was 44.7±9.4 years (range 30–59 years).
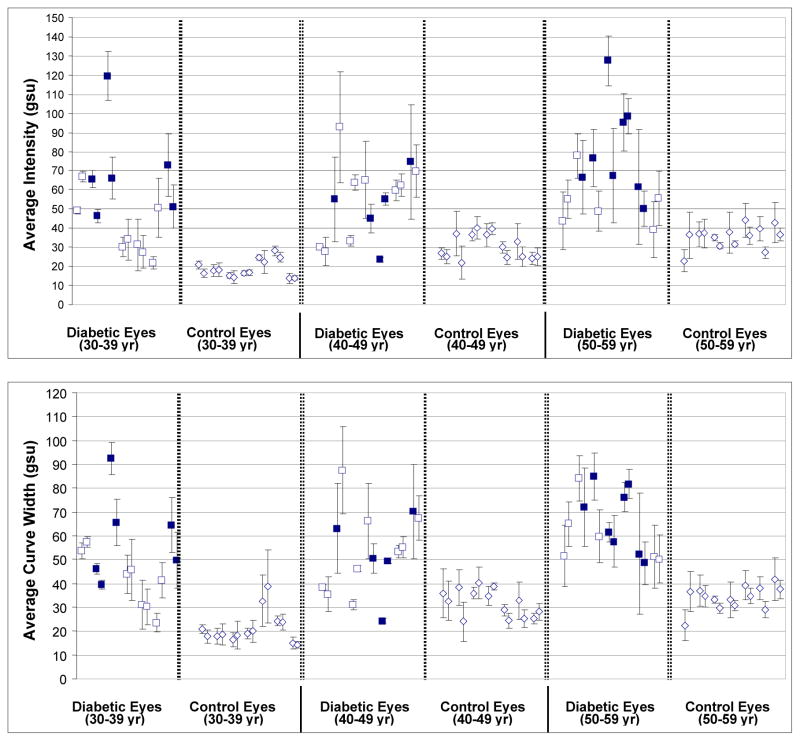
As shown in Figure 3 and Table 1, for all three age strata (30–39, 40–49, & 50–59 years), the mean AI level of diabetics was significantly greater than that found in controls (P≤0.004). An overall comparison of the mean AI level in all diabetics vs. all controls, with adjustment for age, was consistent with the results found in each age category (P<0.001). Similar findings are seen for mean ACW levels (see Figure 3 and Table 1), which were significantly higher for comparisons of diabetics to controls within each age strata (P≤0.006) and in an overall comparison with adjustment for age (P<0.001).
Figure 3.
AI (top) and ACW (bottom) of retinal FA from 21 diabetics (with (■) or without (□) retinopathy) and 21 age-matched controls across three consecutive decades of life. For each volunteer, values for the right and left eyes are shown paired.
Table 1.
Mean AI and ACW levels in Diabetics and Controls, by Age Category
| FA Measure | Age Category | Diabetic Eyes Mean (SE) | Controls Mean (SE) | P-Value* |
|---|---|---|---|---|
| AI level (gsu) | 30–39 yrs | 52.4 (6.1) | 18.8 (6.1) | 0.002 |
| 40–49 yrs | 54.2 (4.7) | 30.4 (4.7) | 0.004 | |
| 50–59 yrs | 68.9 (5.7) | 35.4 (5.7) | 0.001 | |
| Overall | 58.4 (3.1) | 28.2 (3.1) | <0.001 | |
| ACW level (gsu) | 30–39 yrs | 49.0 (4.8) | 21.3 (4.8) | 0.001 |
| 40–49 yrs | 52.8 (4.4) | 31.8 (4.4) | 0.006 | |
| 50–59 yrs | 64.1 (3.4) | 34.2 (3.4) | <0.001 | |
| Overall | 55.2 (2.4) | 29.1 (2.4) | <0.001 |
N=7 diabetics and controls in each age category
SE = standard error from least square means
P-values from mixed linear regression; overall contrast includes adjustment for age
AI and ACW of diabetics and age-matched controls were compared to determine age dependence of FA as other endogenous autofluorescent molecules, such as lipofuscin, accumulate with age and may affect FA intensity. In each age group, AI and ACW of diabetics was greater than those of controls, the latter showing gradual, steady increases of FA with age. However, the relative elevations of FA in diabetics compared to controls appeared to be independent of patient age, strongly suggesting that elevated FA in diabetes is not due to lipofuscin or other similar fluorophores.
Differences in FA values between type I and II diabetics were considered, but FA of the fifteen type II diabetics (AI 59.5±23.6 gsu) and six type I diabetics (AI 55.8±25.9 gsu) did not differ (p=0.654).
Elevated AI and ACW were detected in diabetics regardless of whether any retinopathy was detected on fundus examination by an ophthalmologist specializing in diabetic retinopathy. In fact, nine of the 21 diabetics had no visible retinopathy (Figure 3, □), indicating that retinal metabolic stress due to diabetes is present before any visible retinopathy.
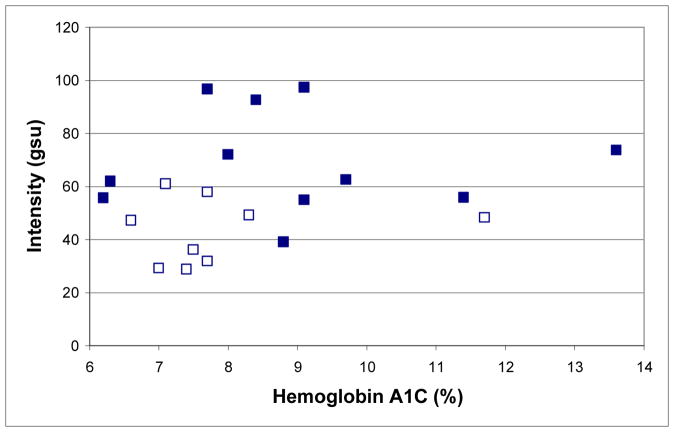
We studied the associations between HbA1C, FA, and the presence of retinopathy (Figure 4). The average HbA1C for diabetics with retinopathy in at least one eye (8.9 ± 2.1%) was not significantly different (p = 0.232) from those without retinopathy in either eye (7.9 ± 1.5%). However, the mean AI and ACW for diabetics with retinopathy in at least one eye (69.7±18.3 and 63.2±14.5 gsu, respectively) were significantly different (p=0.002 and p=0.005, respectively) from those without retinopathy in either eye (43.5±12.2 and 44.8±10.5 gsu, respectively).
Figure 4.
AI (mean of right and left eyes) of 20 out of 21 diabetics from Figure 3 with (■) retinopathy in at least one eye and without (□) retinopathy in either eye compared to their concurrent HbA1C (one unavailable).
To consider the possibility that FA imaging might measure acute fluctuations in plasma glucose rather than the metabolic effects of chronic hyperglycemia, FA of four volunteers was measured in a fasting state and one hour after 75g oral glucose challenge. No significant differences were observed in FA values, indicating that acute elevations in plasma glucose do not influence retinal FA.
Comments
FA imaging of diabetics results in outcomes that differ significantly from age-matched controls. Only one diabetic (Figure 3, first from left, 40–49 age group), an intensively-treated type I diabetic within 1 year of diagnosis and with a HbA1C of 7%, had AI and ACW values of each eye that overlapped with those of age-matched controls. Thus, even our proof-of-concept prototype is able to measure significant differences between groups of controls and diabetics, regardless of disease duration or severity. In several subjects, both control and diabetic (Figure 3), there is a statistical difference in AI and ACW values between their two eyes, suggesting that FA could be detecting increased retinal stress in one eye as opposed to the other. In fact, we have found that high degrees of asymmetry between eyes of the same individual is a strong indicator of disease.14 Improvements in FA technology, including light sources with low flash-to-flash variability and feedback correction for variability, promise to greatly reduce AI and ACW standard deviations to make FA imaging a sufficiently sensitive screening tool for diabetes. In this scenario, due to the high prevalence of diabetes, individuals with abnormally high FA would undergo glucose tolerance testing that, if negative, would prompt investigation for other causes of ocular tissue dysfunction.
For diabetics, FA levels appear to be associated with the severity of retinal damage (Figure 3). In addition, our limited data suggest that FA may be more strongly associated with retinopathy than HbA1C levels, which are considered the most reliable measures of metabolic control.20–22 The value of FA imaging is supported by two patients with retinopathy (Figure 4) who had elevated FA, but low HbA1C levels. Thus, future studies may show FA to be useful in monitoring disease progression and its mitigation by treatment. Unlike glucose monitoring, elevations in FA reflect ongoing diabetic tissue damage and, therefore, may provide patient and caregiver motivation for intensifying disease management.
Until our recent development of a non-invasive method for clinical use, FA had not been used in human clinical studies of disease.14 Ocular emission spectrophotometry has shown that mitochondrial FA23,24 constitutes a shoulder of a broad emission spectrum of other fluorescent species, especially lipofuscin.25,26 For maximal metabolic contrast, only a narrow emission band at the FA maximum is acquired, effectively excluding most of the emission of lipofuscin.25–27 To account for the residual portion of the FA signal derived from age-dependent accumulation of lipofuscin,27 age-matched FA comparisons were used to correct for this variable. Our approach to obtain metabolic contrast appears to satisfy the requirements of a disease-sensitive tool.25,2 Nevertheless, careful quantification of the effects of potentially confounding ocular fluorophores on FA measurements is warranted in future studies.
As neuronal loss and microangiopathy occur early in human and animal diabetes,8,28–32 tissue damage begins at the earliest stages of the disease, before it is clinically evident or detected by fasting blood glucose screening.1,31 Early diagnosis and treatment is likely to prevent this damage.32,33 Our data suggest that development of FA imaging for diabetes, including its evaluation in longitudinal clinical trials, is likely to result in a tool that will become increasingly important in disease detection and management.
Acknowledgments
This study was supported by NIH grants EY-09441 (VME), EY007003, and Research to Prevent Blindness Senior Scientific Investigator Award (VME). Drs. Elner and Petty have a financial interest in the presented material by having founded OcuSciences, Inc. to commercialize the technology. All other authors have no conflict of interest. Mr. Field, Mr. Feuerman, and Dr. Musch had full access to all of the data in the study and take responsibility for the integrity of the data and the accuracy of the data analysis.
References
- 1.Du Y, Miller CM, Kern TS. Hyperglycemia increases mitochondrial superoxide in retina and retinal cells. Free Rad Biol Med. 2003;35:1491–9. doi: 10.1016/j.freeradbiomed.2003.08.018. [DOI] [PubMed] [Google Scholar]
- 2.Kowluru RA, Tang J, Kern TS. Abnormalities of retinal metabolism in diabetes and experimental galactosemia. VII. Effect of long-term administration of antioxidants on the development of retinopathy. Diabetes. 2001;50:1938–42. doi: 10.2337/diabetes.50.8.1938. [DOI] [PubMed] [Google Scholar]
- 3.Mizutani M, Kern TS, Lorenzi M. Accelerated death of retinal microvascular cells in human and experimental diabetic retinopathy. J Clin Invest. 1996;97:2883–90. doi: 10.1172/JCI118746. [DOI] [PMC free article] [PubMed] [Google Scholar]
- 4.Kowluru RA. Diabetic retinopathy: mitochondrial dysfunction and retinal capillary cell death. Antioxid Redox Signal. 2005;7:1581–87. doi: 10.1089/ars.2005.7.1581. [DOI] [PubMed] [Google Scholar]
- 5.Kanwar M, Chan PS, Kern TS, Kowluru RA. Oxidative damage in the retinal mitochondria of diabetic mice: possible protection by superoxide dismutase. Invest Ophthalmol Vis Sci. 2007;48:3805–11. doi: 10.1167/iovs.06-1280. [DOI] [PubMed] [Google Scholar]
- 6.Cai J, Nelson KC, Wu M, Sternberg P., Jr Oxidative damage and protection of the RPE. Prog Ret Eye Res. 2000;19:205–21. doi: 10.1016/s1350-9462(99)00009-9. [DOI] [PubMed] [Google Scholar]
- 7.Thompson CB. Apoptosis in the pathogenesis and treatment of disease. Science. 1995;267:1456–62. doi: 10.1126/science.7878464. [DOI] [PubMed] [Google Scholar]
- 8.Ning X, Baoyu Q, Yuzhen L, Shuli S, Reed E, Li QQ. Neuro-optic cell apoptosis and microangiopathy in KKAY mouse retina. Int J Mol Med. 2004;13:87–92. [PubMed] [Google Scholar]
- 9.Benson RC, Meyer RA, Zaruba ME, McKhann GM. Cellular autofluorescence– is it due to flavins? J Histochem Cytochem. 1979;27:44–8. doi: 10.1177/27.1.438504. [DOI] [PubMed] [Google Scholar]
- 10.Kindzelskii A, Petty HR. Fluorescence spectroscopic detection of mitochondrial flavoprotein redox oscillations and transient reduction of the NADPH oxidase-associated flavoprotein in leukocytes. Eur Biophys J. 2004;33:291–9. doi: 10.1007/s00249-003-0361-4. [DOI] [PubMed] [Google Scholar]
- 11.Reinert KC, Dunbar RL, Wangcai G, Gang C, Ebner TJ. Flavoprotein autofluorescence imaging of neuronal activation in the cerebellar cortex in vivo. J Neurophysiol. 2004;92:199–211. doi: 10.1152/jn.01275.2003. [DOI] [PubMed] [Google Scholar]
- 12.Maynard JD, Nguyen CM, Rohrscheib M, Ediger MN, Way JF. Noninvasive type 2 diabetes screening. Diabetes Care. 2007;30:1120–1124. doi: 10.2337/dc06-2377. [DOI] [PubMed] [Google Scholar]
- 13.Centers for Disease Control and Prevention. National Diabetes Fact Sheet. Atlanta, Ga: U.S. Department of Health and Human Services; 2005. [Google Scholar]
- 14.Elner VM, Park S, Cornblath W, Hackel R, Petty HR. Flavoprotein autofluorescence detection of early ocular dysfunction. Arch Ophthalmol. doi: 10.1001/archophthalmol.2007.44. (In Press) [DOI] [PubMed] [Google Scholar]
- 15.Report of the Expert Committee on the Diagnosis and Classification of Diabetes Mellitus. Diabetes Care. 1997;20:1183–1197. doi: 10.2337/diacare.20.7.1183. [DOI] [PubMed] [Google Scholar]
- 16.The seventh report of the Joint National Committee on Prevention, Detection, Evaluation, and Treatment of High Blood Pressure: the JNC 7 report. JAMA. 2003;289:2560–2572. doi: 10.1001/jama.289.19.2560. [DOI] [PubMed] [Google Scholar]
- 17.American Heart Association/National Heart, Lung, and Blood Institute scientific statement. Circulation. 2005;25(112):2735–2752. doi: 10.1161/CIRCULATIONAHA.105.169404. [DOI] [PubMed] [Google Scholar]
- 18.Bossuyt PM, Reitsma JB, Bruns DE, Gatsonis CA, Glasziou PP, Irwig LM, et al. Towards complete and accurate reporting of studies of diagnostic accuracy: The STARD Intitiative. Clin Chem. 2003;49:1–6. doi: 10.1373/49.1.1. [DOI] [PubMed] [Google Scholar]
- 19.Bossuyt PM, Reitsma JB, Bruns DE, Gatsonis CA, Glasziou PP, Irwig LM, et al. The STARD Statement for reporting studies of diagnostic accuracy: explanation and elaboration. Clin Chem. 2003;49:7–18. doi: 10.1373/49.1.7. [DOI] [PubMed] [Google Scholar]
- 20.Nathan DM, Singer DE, Hurxthal K, Goodson JD. The clinical information value of the glycosylated hemoglobin assay. N Engl J Med. 1984;310:341–346. doi: 10.1056/NEJM198402093100602. [DOI] [PubMed] [Google Scholar]
- 21.Singer DE, Coley CM, Samet JH, Nathan DM. Tests of glycemia in diabetes mellitus: their use in establishing a diagnosis and treatment. Ann Intern Med. 1989;110:125–137. doi: 10.7326/0003-4819-110-2-125. [DOI] [PubMed] [Google Scholar]
- 22.Delamater AM. Clinical use of Hemoglobin A1c to improve diabetes management. Clin Diab. 2006;24:6–8. [Google Scholar]
- 23.Kunz D, Winkler K, Elger CE, Kunz WS. Functional imaging of mitochondrial redox state. Methods Enzymol. 2002;352:135–51. doi: 10.1016/s0076-6879(02)52014-0. [DOI] [PubMed] [Google Scholar]
- 24.Kunz WS, Kunzetsov AV, Winkler K, et al. Measurement of fluorescence changes of NAD(P)H and of fluorescent flavoproteins in saponin-skinned human skeletal muscle fibers. Analyt Biochem. 1994;216:322–7. doi: 10.1006/abio.1994.1048. [DOI] [PubMed] [Google Scholar]
- 25.Schweitzer D, Hammer M, Anders R, Doebbecke T, Schenke S. Alterations in autofluorescence decay time in the fundus after oxygen provocation. (German) Ophthalmologe. 2004;101:66–72. doi: 10.1007/s00347-003-0824-0. [DOI] [PubMed] [Google Scholar]
- 26.Schweitzer D, Kolb A, Hammer M, Anders R. time-correlated measurement of autofluorescence. A method to detect metabolic changes in the fundus (German) Ophthalmologe. 2002;99:774–9. doi: 10.1007/s00347-002-0656-3. [DOI] [PubMed] [Google Scholar]
- 27.Sharifzadeh M, Bernsetin PS, Gellermann W. Nonmydriatic fluorescence-based quantitative imaging of human macular pigment distribution. J Optic Soc Am. 2006;23:2373–87. doi: 10.1364/josaa.23.002373. [DOI] [PMC free article] [PubMed] [Google Scholar]
- 28.Barber AJ, Lieth E, Khin SA, Antonetti DA, Buchanan AG, Gardner TW. Neural apoptosis in the retina during experimental and human diabetes. Early onset and effect of insulin. J Clin Invest. 1998;102:783–91. doi: 10.1172/JCI2425. [DOI] [PMC free article] [PubMed] [Google Scholar]
- 29.Abu-El-Asrar AM, Dralands L, Missotten L, Al-Jadaan IA, Geboes K. Expression of apoptosis markers in the retinas of human subjects with diabetes. Invest Ophthalmol Vis Sci. 2004;45:2760–6. doi: 10.1167/iovs.03-1392. [DOI] [PubMed] [Google Scholar]
- 30.Podesta F, Romeo G, Liu WH, Krajewski S, Reed JC, Gerhardinger C, Lorenzi M. Bax is increased in the retina of diabetic subjects and is associated with pericyte apoptosis in vivo and in vitro. Am J Pathol. 2000;156:1025–32. doi: 10.1016/S0002-9440(10)64970-X. [DOI] [PMC free article] [PubMed] [Google Scholar]
- 31.Martin PM, Roon P, Van Ells TK, Ganapathy V, Smith SB. Death of retinal neurons in streptozotocin-induced diabetic mice. Invest Ophthalmol Vis Sci. 2004;45:3330–6. doi: 10.1167/iovs.04-0247. [DOI] [PubMed] [Google Scholar]
- 32.Barber AJ. A new view of diabetic retinopathy: a neurodegenerative disease of the eye. Prog Neuropsychopharmacology Biol Psychiatry. 2003;27:283–90. doi: 10.1016/S0278-5846(03)00023-X. [DOI] [PubMed] [Google Scholar]
- 33.Lieth E, Gardner TW, Barber AJ, Antonetti DA Penn State Retina Research Group. Retinal neurodegeneration: early pathology in diabetes. Clin Exp Ophthalmol. 2000;28:3–8. doi: 10.1046/j.1442-9071.2000.00222.x. [DOI] [PubMed] [Google Scholar]


