Abstract
The stress distribution in the vessel wall has important bearing on vascular function in health and disease. We studied the relationship between the transmural stress distribution and the opening angle (OA) to determine the stress gradient. The simulation of wall stress was based on transmural measurements of strain and material properties of coronary arteries in reference to the zero-stress state. A one-layer model with material constants of the intact vessel was used to calculate the circumferential stress distribution. A sensitivity analysis using both the one layer model and a two-layer model (intima-media and adventitia layers) was carried out to study the effect of the OA on the circumferential stress distribution and average circumferential stress. A larger OA always shifts the circumferential stress from the intima-media to the adventitia layer. We report a new observation that the circumferential stress at the adventitia may exceed that at the intima at physiological loading due to the larger OA in the porcine coronary artery. This has important implications for growth and remodeling where an increase in opening angle may shift excessive stress from the inner layer to the outer layer.
Keywords: Opening angle, Strain, Intima, Adventitia, Remodeling
INTRODUCTION
Mechanical stress in the blood vessel wall is related to various aspects of vascular biology; e.g., function [1, 2, 3], remodeling [4, 5], molecular biology [2, 6] and gene expression [2, 7]. A large number of studies have focused on the stress distribution within the vessel wall [8, 9, 10, 11, 12, 13, 14]. Typically, the circumferential stress has been predicted to be larger on the inner wall (intima) as compared to the outer wall (adventitia) under physiological pressure [9, 10, 11, 12, 13, 14]. Hence, the stress distribution factor which is defined as the ratio of outer to inner stress is typically reported as < 1 in the circumferential direction.
The objective of this study is to show that the physiological circumferential stress at the inner wall can be smaller than that at the outer wall, i.e., the stress distribution ratio can be > 1. The stress distribution analysis is based on the measurements of the physiological strain values and the material constants provided by two previous studies on the porcine coronary artery [15, 16]. The stress analysis was carried out in the one layer model assuming homogenous mechanical properties in the vessel wall. It is shown that the circumferential stress at the inner surface is lower than that at the outer surface.
The zero-stress state of a vessel can be found when a vessel ring is cut radially to spring open into a sector. The vessel sector in the zero-stress state is characterized by the opening angle (OA) which is defined as the angle subtended between two radii with the origin located at midpoint of vessel wall and radiating to the tips of inner wall. The OA is determined by three geometrical factors: inner circumference, outer circumference and wall area. An identical OA change can be caused by different changes in zero-stress geometry data. Therefore, a theoretical sensitivity analysis was done to study the effects of the OA change on the stress distribution and the average stress, and to determine whether the effects are independent of how the OA changes. Both the one-layer model homogenous wall model and the two-layer (intima-media layer and adventitia layer) model were used in the sensitivity analysis. The material constants of blood vessels were maintained constant in the sensitivity analysis in order to focus on the effects of opening angle. The sensitivity analysis shows that the effect of OA on the stress distribution does not depend on the specific way in which the OA changes and the smaller OAs in the previous studies accounts for the smaller stress distribution factors, i.e., higher circumferential stress at the inner layer.
METHODS
Determination of the Circumferential Transmural Stress Distribution
Circumferential stress distribution in the vessel wall was determined from the dimensions of the blood vessel wall in the loaded and zero-stress state and the material constants form our previous studies on normal porcine coronary artery [15, 16]. The geometric and material data are taken from previous studies by our group [15, 16]. Briefly, the inner and outer diameters of the left anterior descending (LAD) artery at physiological pressure (100 mmHg at inlet) were measured followed by a radial cut to the vessel ring to release the residual stress [15]. The OA and the inner and outer circumferential lengths of the sector were measured in the zero-stress state [15]. Material constants of the LAD were determined by a series of in vitro inflation-axial stretching tests of arteries [16]. For the intact vessel, C=8.76kPa, b1 =1.21, b2=3.39, b3=0.79, b4=0.25, b5 =0.11, b6 =0.10; for the intima-media layer, Cmed=5.11kPa, b1,med =2.47, b2,med=3.09, b3,med=0.95, b4,med=0.45, b5,med =0.06, b6,med =0.10; and for the adventitia layer, Cadv=9.05kPa, b1,adv =0.62, b2,adv=2.27, b3,adv=1.67, b4,adv=0.34, b5,adv =0.11, b6,adv =0.07. The inner and outer circumferential strains of the loaded artery were calculated based on these measurements. A one-layer model was then used to calculate the stress distribution of the blood vessel wall. The details of the formulation of circumferential transmural stress distribution are outlined in [8].
Sensitivity Analysis of Circumferential Stress
The dependence of circumferential stress on the OA was studied through a numerical sensitivity analysis. The OA of the cut-open vessel segment is related to three parameters in the zero-stress state: inner-surface circumference; outer-surface circumference and area of the vessel segment. Based on the geometric calculation of open sector, the equation describing the relation between the opening angle and various parameters in the zero-stress state is given by:
| [1] |
where Co and Ci are the outer and inner circumferences, respectively. A is the wall area and the unit of the OA is degrees. Although the opening angle is typically reported, the changes of three parameters in Eq. 1 that determine the opening angle are not provided in most studies. The sensitivity analysis is used to study the effects of the opening angle change in the absence of data on the three parameters. If an effect exists independent of the specific way by which the opening angle is changed, the opening angle data are sufficient to determine the effect. If an effect depends on how the opening angle is changed, the opening angle can not deduce the effect definitively. In the analysis, the OA was hypothetically changed by maintaining two parameters constant and varying the third parameter. The three parameters were varied in turn to examine the effect on the stress distribution. A single set of zero-stress geometry data was used as baseline values, and they are 7.58mm, 7.78mm and 2.57mm2 for inner circumference, outer circumference and wall area, respectively. Variations from these baseline values were made hypothetically. Both the one layer model and the two-layer model were used. The opening angles of the two layers were assumed to be the same. Since the variations in the parameters were not obtained directly from experimental measurements, the diameter of the loaded artery was calculated as outlined in [8]. The effect of transmural pressure on the stress distribution factor was also studied. Stress distribution factors were calculated for a series of internal pressures from 70 to 130 mmHg with and without external pressure (30mmHg).
Statistical Analysis
The correlation coefficients (R2) were calculated to evaluate the “goodness” of fit for the relationship between the OA and various parameters for both experimental results and sensitivity analysis. Student’s t-test was also used to evaluate the significance of the correlation for the stress distribution factor.
RESULTS
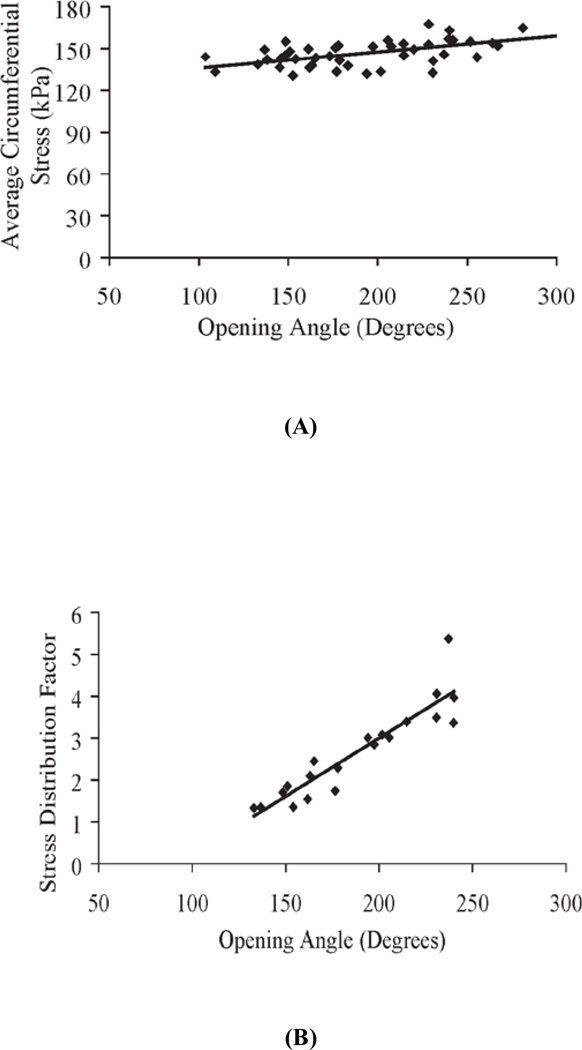
Figures 1–4 are results of the one-layer model. The average circumferential stress and the stress distribution factor were calculated in Figure 1 based on experimental measurements. Figure 1A shows the relation between average circumferential stress and OA. A linear least square fit reveals a small slope and a weak but significant correlation (R2=0.32, p <0.0001). Figure 1B shows a linear relation between stress distribution factor and OA. The OA has a stronger correlation with the stress distribution factor than with the average stress (R2=0.84, p<0.000001).
Figure 1.
A) Relation between average circumferential stress σθ,AVG and opening angle (OA) from experimental measurements of the swine left anterior descending artery (Ref. 15). Data can be fitted with a linear equation as: σθ,AVG = 0.115OA + 124.5, R2 = 0.32, p-value <0.0001; B) Relation between stress distribution factor and opening angle (OA) based on experimental measurements of swine left anterior descending artery (Ref. 15). Data can be fitted with a linear equation as: , R2 = 0.84, p-value <0.000001.
Figure 4.
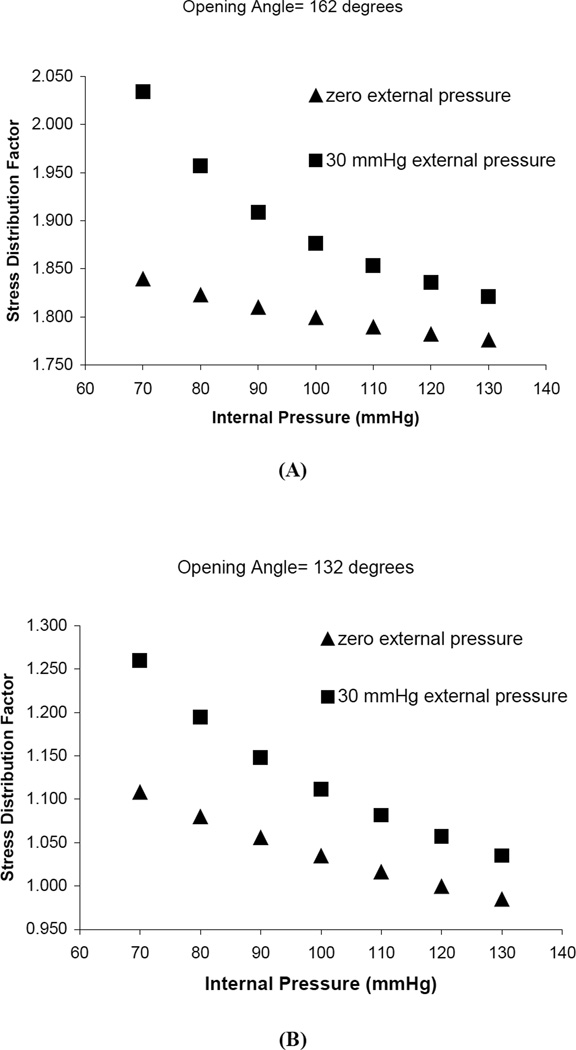
Effect of tranmural pressure on the stress distribution factor. Triangles represent internal pressure increase with zero external pressure. Round dots represent the same inter pressure pattern with 30mmHg external pressure. Ci, Co and A are constants. A) Ci =7.58mm, Co =7.78mm and A=2.57mm2, OA =162 degrees; B) Ci =7.58mm, Co =8.12mm and A=2.57mm2, OA=132 degrees.
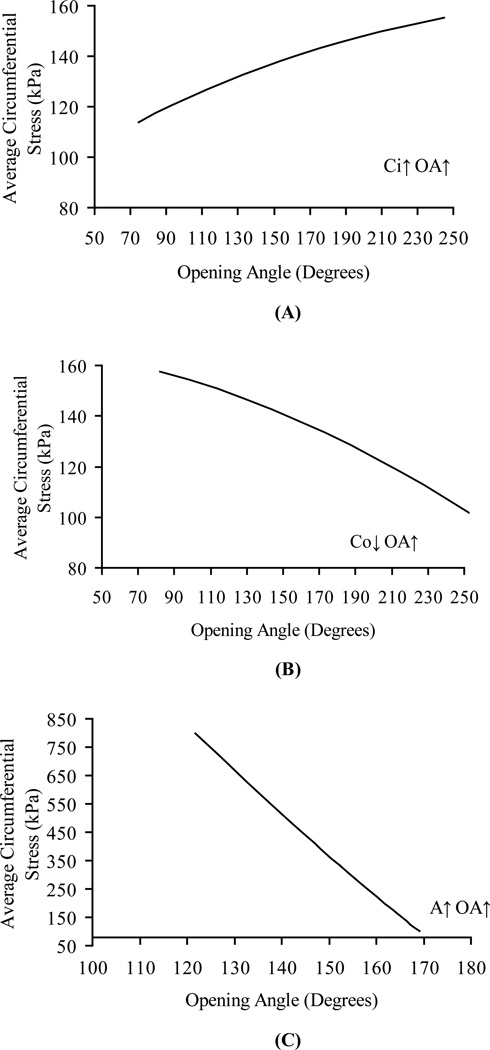
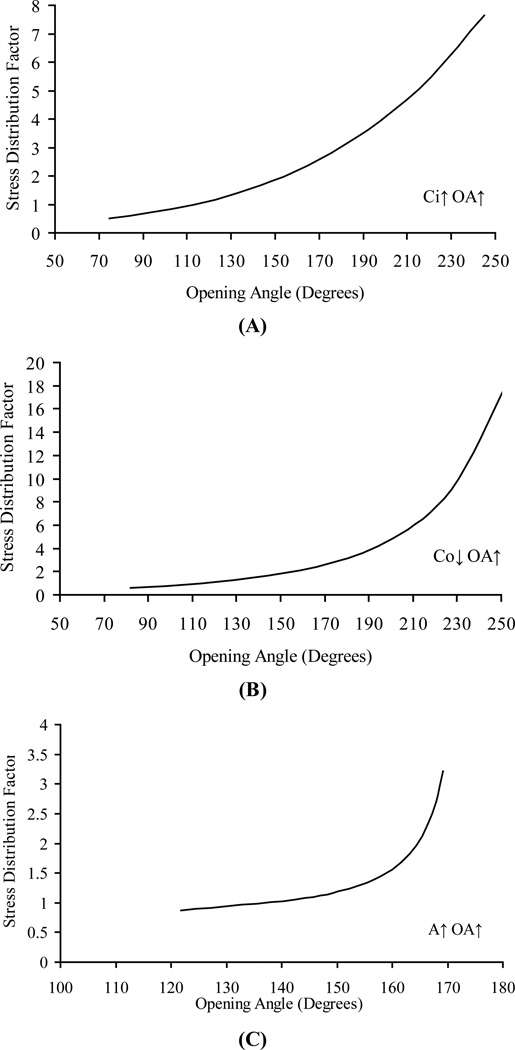
Figures 2 and 3 illustrate the results of sensitivity analysis of OA on the average circumferential stress. Figures 2A, 2B and 2C show the relation between average circumferential stress and OA where the OA is changed by inner circumference, outer circumference, and wall area, respectively. These curves are nearly linear, but with different slopes depending on how the change in the OA was implemented. Figure 3A shows the relation between the stress distribution factor and OA where the OA is changed by the inner circumference. The increase in OA changes the ratio of outer-to-inner circumferential stress in a non-linear fashion. The trend is similar if the OA is changed through the outer circumference or wall area as shown in Figures 3B and 3C, respectively. Figure 4 shows that the increase in the transmural pressure decreases the stress distribution factor and vice versa. When the blood vessel is supported by the surrounding tissue, the effect of external pressure is to decrease the transmural pressure and hence lead to a larger stress distribution factor. For a larger OA (162 degrees) in Fig 4A, the stress distribution factor is always > 1 in the physiological pressure range, whereas for a smaller OA (132 degrees) in Fig 4B, the stress distribution factor can be changed form >1 to < 1 when the pressure is large enough.
Figure 2.
Numerical sensitivity analysis of the dependence of the circumferential stress (σθ,AVG) on opening angle (OA). Opening angle changes due to A) inner circumference, B) outer circumference and C) wall area in zero-stress state zero-stress state. Opening angle varies from 75 to 250 degrees in Figures A and B, from 120 to 170 degrees in Figure C. Ci varies from 6.45 mm to 8.5 mm. Co varies from 6.67 mm to 8.67 mm. A varies from 0.75 to 4 mm2
Figure 3.
Numerical sensitivity analysis of the dependence of the outer-to-inner circumferential stress ratio (stress distribution factor) on opening angle. Internal pressure is 100 mmHg for all curves. Opening angle changes due to A) inner circumference, B) outer circumference, and C) area change in zero-stress state. Opening angle varies from 75 to 250 degrees in Figures A and B, from 120 to 170 degrees in Figure C. Ci varies from 6.45 mm to 8.5 mm. Co varies from 6.67 mm to 8.67 mm. A varies from 0.75 to 4 mm2
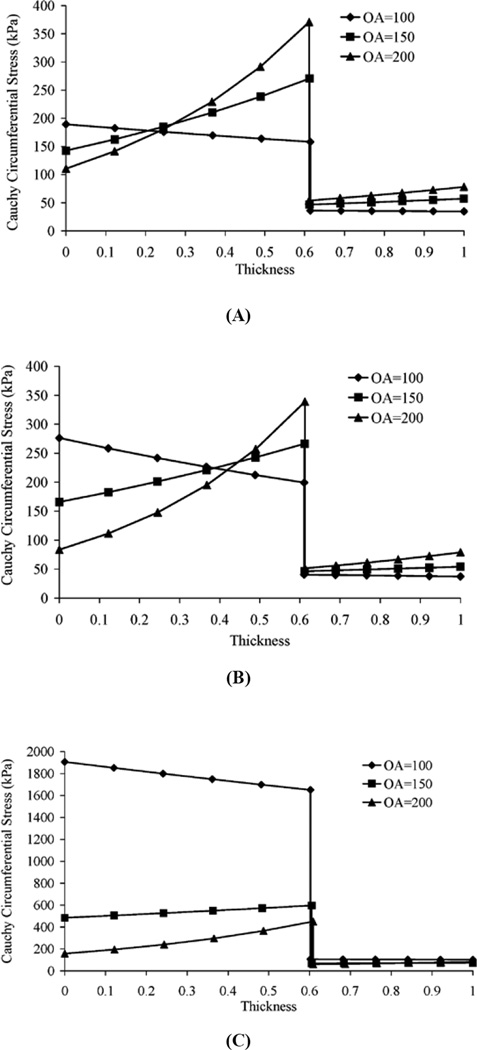
The results of the sensitivity analysis based on the two-layer model are summarized in Figure 5 which shows the effect of the OA on the stress distribution. As the OA is increased, the stress distribution within each layer shifts to the outside of the layer; i.e., the circumferential stress at the outside surface of the layer increases and the stress at the inner surface decreases.
Figure 5.
Numerical sensitivity analysis of the dependence of stress distribution in the two-layer model on the opening angle. Pressure is 100 mmHg for all curves. Opening angle change due to A) inner circumference, B) outer circumference and C) area change in zero-stress state.
DISCUSSION
There are two parts to this paper. In the first part, circumferential stress distributions at various locations along the normal porcine coronary artery were calculated from experimental data and the results show that the stress at the outer layer can be larger than that at the inner layer. The relationships between wall stress and opening angle were also shown. In the second part, a theoretical study was done to analyze the effects of OA change on the wall stress for constant material properties.
In the present study, we show that the stress distribution factor (ratio of adventitial to intimal stress) can be > 1, and this distribution is a direct consequence of the larger OA. Based on direct measurements and sensitivity analysis, we demonstrate that the OA has a direct relationship with the stress distribution in the vessel wall at physiological loading. There exists a threshold in the OA such that the stress distribution factor changes from < 1 to > 1. This new observation confirms the important role of the zero-stress state, which is typically quantified by the OA.
The implications of the relation between OA and stress distribution factor were extended to hypertension where rapid increase in OA is observed [18, 19, 20, 21]. We found that a direct consequence of the increase in OA is to off load some of the excess stress due to the elevated pressure from intima to adventitia. It is noted that this OA increase is mainly a result of intimal hyperplasia. Hence we propose that intimal hyperplasia which causes an increase in OA protects the endothelium from elevated stress. The shift of stress to adventitia which is fairly acellular and predominantly made of collagen fibers can endure the higher stress.
Effect of Opening Angle on Circumferential Stress
To study the mechanical properties of the blood vessel wall, the zero-stress state of the blood vessel must be determined. Strains at the loaded state are defined with respect to this reference state. For a blood vessel, the open sector resulting from a radial cut of the vessel ring is considered stress-free. Based on strain measurements at physiological loading, the average circumferential stress is almost independent of the OA (Figure 1A). On the other hand, the ratio of the outer-to-inner circumferential stress (stress distribution factor) has a significant linear relationship with the OA (Figure 1B). These results can be explained from the sensitivity analysis that shows the effect of the OA on the average circumferential stress depends on how the OA is changed (Figure 2). The effects of the OA on the average stress can be opposing if the change is implemented through the inner and outer circumference or inner circumference and wall area (Fig. 2). However, the effects of the OA on the stress distribution factor are the same regardless of whether the change occurs through the inner circumference, outer circumference or wall area (Fig. 3). When the vessel sector in the zero stress state is bent into a ring in the no-load configuration, a larger OA will make the inner surface more compressed and the outer surface more elongated in the no-load state. This will result in a higher stress at the outer surface and a lower stress at the inner surface under physiological loading. The inner surface stress will change from compressive to tensile under certain luminal pressure, and smaller than the tensile outer surface stress due to the residual strain. With further loading, it is possible for the inner surface stress to become higher than the outer surface stress. This trend can be seen from Figure 4B. The effect of higher OA is to push this transition point higher on the luminal loading curve. We found that when OA is sufficiently large as in Figure 4A, the required transition pressure is so high that it is beyond the realistic physiological pressure range. Hence, the inner surface is typically at lower tensile stress than the outer within the physiological pressure range.
In summary, the primary effect of the OA change is on the stress distribution; i.e., higher OA will result in higher stress concentration at the outer wall as compared to the inner wall. The effect of the OA on the average circumferential stress cannot be determined unless the data on the changes of inner and outer circumferences and wall area are measured.
Critique of the Method
We focus on the stress distribution under physiological loading, which normally produces tensile stresses in the entire vessel wall. It is noted that in the absence of blood pressure (in the no-load state), residual stresses in the vessel wall result in compressive stress in the intima and tensile stress in the adventitia, and this will lead to a negative stress distribution ratio value. However, this is not the focus of our study.
Although these two studies were both done on the same type of specimens, i.e., porcine left anterior descending artery, the data sets used in these studies are different. Therefore, the material constants from study [16] do not strictly satisfy the boundary conditions of study [15], i.e., the internal pressure determined by the integral equation [8] is not always 100mmHg, which is the pressure in the study [15]. To ensure the accuracy of the circumferential stress, only those data sets with a calculated internal pressure within 10% of 100mmHg were used (Figure 1B). Figures 2, 3, 4 and 5 are theoretical studies, so they are not affected by this issue.
Comparison with Previous Studies
Most previous studies on the stress distribution in vessel wall reported higher circumferential stress at the inner wall than that at the outer wall. Some of these studies did not consider the residual stress in the vessel ring; i.e., it was assumed that the zero-stress state was equal to the no-load state of the vessel. In that case, the incompressibility condition predicts that the strain value will be higher in the inner as compared to outer wall under any loading. The one-layer model assumes the mechanical property to be homogeneous in the vessel wall, so the higher intima stress is due to the larger strain compared to adventitia. Hence, only the previous studies that measured the physiological strains in reference to residual strain are discussed here.
The sensitivity analysis in the present study shows a direct relationship between the OA and the stress distribution factor. A previous study from our group [15] showed that there is a threshold for the outer-to-inner strain ratio in the OA. The ratio is larger than one when the OA is > 135 degrees and smaller than one when the OA is < 135 degrees [15] for the porcine LAD artery. Therefore, we propose that the smaller OAs account for the circumferential stress being higher at the inner surface (endothelium) than that at the outer surface (adventitia) in previous studies.
Fung and Liu [10] measured the strain distribution in small blood vessels with reference to zero-stress state. Strain distribution in both ileal and medial plantar artery at 120 mmHg were found almost flat across the vessel wall with the strain at the inner wall being slightly higher than that at the outer wall (OAs were 99 and 94 degrees, respectively). The outer-to-inner strain ratio of the pulmonary artery at 15 mmHg was > 1 at an OA of 130 degrees. These results are consistent with our sensitivity analysis which confirms that higher OA results in reversion of the strain gradient across the vessel wall.
Matsumoto et al. [13] studied stress and strain distribution in hypertensive and normotensive rat aorta. They pointed out that the reason they obtained much higher concentration of stress at the inner wall was because of the small OA. They predicted the OA needed to make the strain distribution uniform was 50–130 degrees larger than that measured. In another study on the stress and strain distribution in the bovine thoracic aorta wall by the same investigators [12], the physiological strain distribution were found to be lower at the inner wall except when the axial stretch ratio was as high as 1.6 (the OA was approximately 140°). Again, the present study confirms that the transmural strain distribution reversal can exist under physiological condition when the OA is sufficiently large. Hence, the reported differences in the stress distribution factor are a direct consequence of the difference in OA. Here, we systematically evaluated the OA of many vessel rings, whereas other studies only measured the OA of a particular vessel specimen.
ACKNOWLEDGEMENT
This research is supported in part by the National Institute of Health-National Heart, Lung, and Blood Institute Grant 2 R01 HL055554-11 and 2-R01-HL-055554-11.
REFERENCES
- 1.Davis PF, Dewey CF, Bussolari SR, et al. Influence of hemodynamicc forces on vascular endothelial function – in vitro studies of shear stress and pinocytosis in bovine aortic cells. Journal of clinical investigation. 1984;73(4):1121–1129. doi: 10.1172/JCI111298. [DOI] [PMC free article] [PubMed] [Google Scholar]
- 2.Davis PF. Flow-mediated endothelial mechanotransduction. Physiological Review. 1995;75(3):519–560. doi: 10.1152/physrev.1995.75.3.519. [DOI] [PMC free article] [PubMed] [Google Scholar]
- 3.Thubrikar MJ, Baker JW, Nolan SP. Inhibition of atherosclerosis associated with reduction of arterial intramural stress in rabbits. Arteriosclerosis. 1998;8(4):410–420. doi: 10.1161/01.atv.8.4.410. [DOI] [PubMed] [Google Scholar]
- 4.Stone PH, Coskun AU, Kinlay S, et al. Effect of endothelial shear stress on the progression of coronary artery disease, vascular remodeling, and in-stent restenosis in humans - In vivo 6-month follow-up study. Circulation. 2003;108(4):438–444. doi: 10.1161/01.CIR.0000080882.35274.AD. [DOI] [PubMed] [Google Scholar]
- 5.Wentzel JJ, Kloet J, Andhyiswara I, et al. Shear-stress and wall-stress regulation of vascular remodeling after balloon angioplasty-Effect of matrix metalloproteinase inhibition. Circulation. 2001;104(1):91–96. doi: 10.1161/01.cir.104.1.91. [DOI] [PubMed] [Google Scholar]
- 6.Traub O, Berk BC. Laminar shear stress-mechanisms by which endothelial cells transduce and atheroprotective force. Arteriosclerosis Thrombosis and Vascular Biology. 1998;18(5):677–685. doi: 10.1161/01.atv.18.5.677. [DOI] [PubMed] [Google Scholar]
- 7.Chien S, Li S, Shyy JYJ. Effects of mechanical forces on signal transduction and gene expression in endothelial cells. Hypertension. 1998;31(1):162–169. doi: 10.1161/01.hyp.31.1.162. Part 2 Suppl. S. [DOI] [PubMed] [Google Scholar]
- 8.Chuong CJ, Fung YC. On residual stresses in arteries. Journal of Biomechanical Engineering-Transactions of the ASME. 1986;108:189–192. doi: 10.1115/1.3138600. [DOI] [PubMed] [Google Scholar]
- 9.Chuong CJ, Fung YC. Three dimensional stress distribution in arteries. Journal of Biomechanical Engineering-Transactions of the ASME. 1983;105:268–274. doi: 10.1115/1.3138417. [DOI] [PubMed] [Google Scholar]
- 10.Fung YC, Liu SQ. Strain distribution in small blood vessels with zero-stress state taken into consideration. Am. J. Physiol. 1992;262(2):H544–H552. doi: 10.1152/ajpheart.1992.262.2.H544. [DOI] [PubMed] [Google Scholar]
- 11.Holzapfel GA, Gasser TC, Ogden RW. A new constitutive framework for arterial wall mechanics and a comparative study of material models. J Elasticity. 2000;61:1–48. [Google Scholar]
- 12.Matsumoto T, Sato M. Analysis of stress and strain distribution in the artery wall consisted of layers with different elastic modulus and opening angle. JSME international journal series C – mechanical systems machine elements and manufacturing. 2002 DEC;45(4):906–912. [Google Scholar]
- 13.Matsumoto T, Hayashi Kozaburo. Stress and strain distribution in hypertensive and normotensive rat aorta considering residual strain. Journal of Biomechanical Engineering-Transactions of the ASME. 1991;113(4):446–451. doi: 10.1115/1.2795947. [DOI] [PubMed] [Google Scholar]
- 14.Vaishnav RN, Young JT, Patel DJ. Distribution of Stresses and of Strain–Energy Density through the Wall Thickness in a Canine Aortic Segment. Circ. Res. 1973;32:577–583. doi: 10.1161/01.res.32.5.577. [DOI] [PubMed] [Google Scholar]
- 15.Guo XM, Lu X, Kassab GS. Transmural strain distribution in the blood vessel wall. Am.J. Physiol. –Heart and Circulatory Physiology. 2005;288(2):H881–H886. doi: 10.1152/ajpheart.00607.2004. [DOI] [PubMed] [Google Scholar]
- 16.Wang C, Garcia M, Lu X, Lanir Y, Kassab GS. Three-dimensional mechanical properties of porcine coronary arteries: a validated two-layer model. Am. J. Physiol. –Heart and Circulatory Physiology. 2006;291(3):H1200–H1209. doi: 10.1152/ajpheart.01323.2005. [DOI] [PubMed] [Google Scholar]
- 17.Fung YC. Biomechanics: motion, flow, stress and growth. New York: Springer-Verlag; 1990. [Google Scholar]
- 18.Fung YC, Liu SQ. Changes of zero-stress state of rat pulmonary-arteries in hypoxic hypertension. Journal of Applied Physiology. 1991;70(6):2455–2470. doi: 10.1152/jappl.1991.70.6.2455. [DOI] [PubMed] [Google Scholar]
- 19.Liu SQ, Fung YC. Relationship between hypertension, hypertrophy, and opening angle of zero-stress state of the arteries following aortic constriction. Journal of Biomechanical Engineering-Transactions of the ASME. 1989;111(4):325–335. doi: 10.1115/1.3168386. [DOI] [PubMed] [Google Scholar]
- 20.Fridez P, Makino A, Miyazaki H, et al. Short-term biomechanical adaptation of the rat carotid to acute hypertension: Contribution of smooth muscle. Annals of Biomedical Engineering. 2001;29(1):26–34. doi: 10.1114/1.1342054. [DOI] [PubMed] [Google Scholar]
- 21.Fung YC, Liu SQ. Change of residual strains in arteries due to hypertrophy caused by aortic constriction. Circulation Research. 1989;65(5):1340–1349. doi: 10.1161/01.res.65.5.1340. [DOI] [PubMed] [Google Scholar]
- 22.Fridez P, Zulliger M, Bobard F, Montorzi G, et al. Geometrical, functional, and histomorphometric adaptation of rat carotid artery in induced hypertension. Journal of Biomechanics. 2003;36(5):671–680. doi: 10.1016/s0021-9290(02)00445-1. [DOI] [PubMed] [Google Scholar]
- 23.Hassler O. Arterial cell-kinetics in experimental hypertension. Virchows Archiv Abeteilung A Pathologisue Anatomie. 1974;362(4):283–289. doi: 10.1007/BF00427077. [DOI] [PubMed] [Google Scholar]
- 24.Owens GK. Control of hypertrophic versus hyperplastic growth of vascular smooth-muscle cells. American Journal of Physiology. 1989;257(6):H1755–H1765. doi: 10.1152/ajpheart.1989.257.6.H1755. part 2. [DOI] [PubMed] [Google Scholar]
- 25.Owens GK, Reidy Ma. Hyperplasic growth-response of vascular smooth-muscle cells following induction of acute hypertension in rats by aortic coarctation. Circulation Research. 1985;57(5):695–705. doi: 10.1161/01.res.57.5.695. [DOI] [PubMed] [Google Scholar]


