

Abstract
Water density fluctuations are an important statistical mechanical observable that is related to many-body correlations, as well as hydrophobic hydration and interactions. Local water density fluctuations at a solid-water surface have also been proposed as a measure of it’s hydrophobicity. These fluctuations can be quantified by calculating the probability, Pv(N), of observing N waters in a probe volume of interest v. When v is large, calculating Pv(N) using molecular dynamics simulations is challenging, as the probability of observing very few waters is exponentially small, and the standard procedure for overcoming this problem (umbrella sampling in N) leads to undesirable impulsive forces. Patel et al. [J. Phys. Chem. B, 114, 1632 (2010)] have recently developed an indirect umbrella sampling (INDUS) method, that samples a coarse-grained particle number to obtain Pv(N) in cuboidal volumes. Here, we present and demonstrate an extension of that approach to volumes of other basic shapes, like spheres and cylinders, as well as to collections of such volumes. We further describe the implementation of INDUS in the NPT ensemble and calculate Pv(N) distributions over a broad range of pressures. Our method may be of particular interest in characterizing the hydrophobicity of interfaces of proteins, nanotubes and related systems.
Keywords: umbrella sampling, density fluctuations, free energy calculations, hydrophobicity
1 Introduction
Quantifying density fluctuations in a condensed phase is interesting from a statistical physics perspective. For example, the probability Pv(N) of finding N fluid particles in a probe volume v contains information about many-body correlations in the fluid. Calculations of Pv(N) in liquid water have significantly enhanced our understanding of hydrophobicity. In particular, as the hydration of an idealized solvent-excluding hydrophobic solute is equivalent to the creation of a cavity with the same size and shape as that of the solute, the excess free energy, μex, of solute hydration is [1]
| (1) |
where kB is the Boltzmann constant, T is the temperature, and ‘log’ represents the natural logarithm. In 1996, Hummer et al. showed that in bulk water, Pv(N) distributions are gaussian for small spherical volumes containing fewer than ten water molecules on average [2]. This simplicity formed the basis for an information theoretic model that could predict the thermodynamics of hydrophobic hydration and the association of small solutes over a range of conditions, using only the readily available information on the average density and the water radial distribution function [2–4]. Gaussian statistics of density fluctuations [5] also underlies the Pratt-Chandler theory [6], which employs the same information to estimate pair correlation functions for small hydrated hydrophobic species.
While small solutes can be accommodated in cavities that are formed spontaneously by thermal fluctuations in bulk water, solvating large solutes requires forming a liquid-vapor-like interface [7–9]. As a result, the nature of density fluctuations in large volumes is more complex. The Lum-Chandler-Weeks (LCW) theory captures the lengthscale dependence of hydration quantitatively by combining the physics of gaussian density fluctuations and that of interface formation [8]. Specifically, it predicts that while Pv(N) for large volumes is gaussian around the mean, the low-N wings of the distribution are enhanced substantially [10,11]. Quantifying these rare water fluctuations in large volumes is essentially impossible in equilibrium molecular simulations, and requires non-Boltzmann or umbrella sampling methods [12]. Straightforward umbrella sampling of N, is further complicated by the fact that N is a discontinuous function of particle coordinates, resulting in impulsive forces, which are difficult to treat in typical molecular dynamics (MD) simulations. To circumvent this difficulty, Patel et al. recently introduced an indirect umbrella sampling (INDUS) method in which N is sampled indirectly, by biasing a coarse-grained variable, Ñ, which is strongly correlated with N but varies continuously with particle coordinates [13]. Some elements of this formalism have also been used previously by Andreev et al. in their study of deformed carbon nanotubes [14].
The original implementation of INDUS, which is suitable only for cuboidal volumes, showed that for large volumes in bulk water, Pv(N) indeed deviates significantly from gaussian behavior at low N, reflecting the underlying physics of interface formation [13]. Application of INDUS to sample density fluctuations in large volumes in interfacial environments showed that fluctuations near hydrophilic surfaces are similar to those in bulk, but near hydrophobic interfaces, the probability of density depletion is significantly enhanced [13]. The ability to calculate Pv(N), and especially μex using Eq. 1, in large volumes near interfaces also allowed us to calculate the binding free energies of hydrophobic cuboids to surfaces with a range of chemistries, and these binding free energies were shown to correlate with the macroscopic wetting properties of the surfaces [15]. Thus, Pv(N) is a potential molecular measure of hydrophobicity, which may enable the characterization of surfaces of proteins and biomolecules that exhibit nanoscale roughness and chemical heterogeneity.
Here, we extend INDUS such that it can be used to umbrella sample probe volumes of other regular shapes, e.g., with cylindrical and spherical symmetry, as well as intersections and unions of collections of such regular volumes and their complements. While the ideas underlying the extension are simple, they considerably widen the scope of the method. For example, they allow umbrella sampling of arbitrarily shaped volumes, enabling faithful characterization of fluctuations in the hydration shells of ions, nanoparticles, nanotubes, as well as rugged proteins surfaces.
We also extend the method to work in the NPT ensemble. Previous applications of INDUS were performed in the NVT ensemble with a buffering vapor-liquid interface. While the two schemes yield indistinguishable results at low pressures, the present extension allows access to a much broader range of pressures. We begin by describing the INDUS method of Ref. [13], which is suitable for cuboidal probe volumes, and introduce the pertinent equations, which lays down the framework for extending the method to other regular volumes. We then generalize these equations to volumes of more general shapes and to collections of such volumes, and describe how INDUS affects the calculation of system pressure. Finally, we demonstrate these generalizations by calculating Pv(N) in various noncuboidal shapes and at high pressures.
2 The INDUS Method
The number of particles, N, in a specific probe volume, v, changes discontinuously as the center of any particle crosses the surface of v. Hence, if the biasing potential, U, were chosen to be a function of N, it would result in impulsive forces. Instead, we choose U to be a function of a closely related coarse-grained particle number, Ñ, that is a continuous function of the positions, {ri}, of all M particles in the system as,
| (2a) |
where
| (2b) |
The integral in Eq. 2b is over the probe volume v, and the integrand is a coarse-graining function, Φ(r), which we choose to be
| (3a) |
where
| (3b) |
The function φ(α), shown in Fig. 1, is a gaussian that is truncated at |α| = αc, shifted down, and then scaled, so as to make it continuous and normalized. The normalization constant, k, is equal to and Θ(α) is the Heaviside step function. As the width of the gaussian, σ, approaches 0, the function φ(α) approaches the Dirac delta function δ(α) and Ñ approaches N. The correlation between Ñ and N is thus strongest when σ is smallest, but if σ is chosen to be too small, the resulting biasing forces may be too large to handle correctly in typical MD simulations.
Fig. 1.
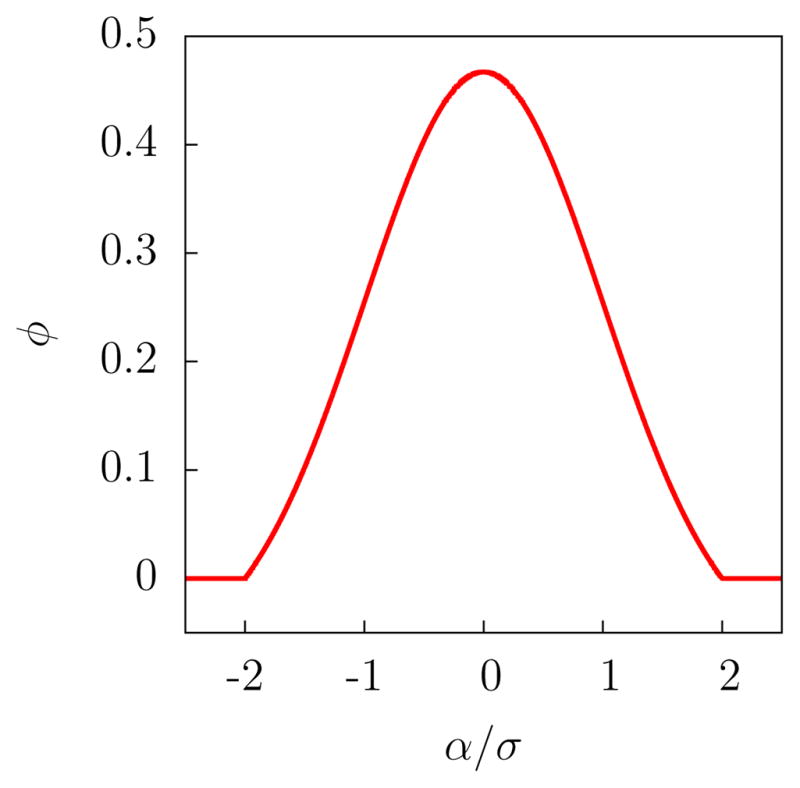
The coarse-graining function, φ(α), as defined in Eq. 3b, for αc = 2σ.
For a cuboidal volume v, the integral in Eq. 2b can be performed independently in the x, y and z directions. The result is
| (4a) |
where
| (4b) |
and xmin and xmax are the coordinates of the faces of v perpendicular to the x-axis. The functions h̃y(yi) and h̃z(zi) are defined analogously.
Fig. 2a shows the function hx(xi) (equal to 1 for xmin ≤ xi ≤ xmax, and 0 otherwise), which can be thought of as the x contribution to h(ri); that is, h(ri) = hx(xi)hy(yi)hz(zi) and N = Σi h(ri). Fig. 2a also shows the function h̃x(xi), which varies continuously across the boundary of v, unlike hx(xi). The coarse-graining function h̃x(xi) differs from hx(xi) only in the thin boundary region of thickness 2xc. Thus, by ensuring that Ñ and N are strongly correlated, we are able to influence N indirectly by biasing Ñ.
Fig. 2.

The functions hα (αi), h̃α (αi) and its derivative, , for coordinates that have (a) two (α → x), (b) one (α → r) or (c) zero (α → θ) boundaries.
For a cuboidal probe volume, the x-component of the force on particle i due to the biasing potential, U(Ñ), is given by
| (5) |
where the derivative of h̃x(xi), obtained by differentiating Eq. 4b and shown in Fig. 2a, is
| (6) |
It follows that the biasing forces act only on particles near the boundary of v, are finite, and are continuous functions of particle positions.
To obtain Pv(N) using INDUS, we perform nw simulations with different biasing potentials, Uj(Ñ) (j = 1, …, nw), chosen such that the range of interest of N is well sampled. During each simulation, we collect nj samples of N and Ñ, denoted by Nj,l and Ñj,l (l = 1, …, nj), in essence, sampling the biased joint distribution function, Pv(N, Ñ). We then unbias and stitch together the nw biased joint distribution functions by using the weighted histogram analysis method (WHAM) [16, 17]. Finally, we integrate out the unbiased joint distribution function to obtain Pv(N), which is given by
| (7) |
where β−1 = kBT is the thermal energy, δn,m is the Kronecker delta function, and C and {cj} are normalization constants, determined self-consistently through the standard WHAM equations,
| (8a) |
and
| (8b) |
3 Extension of INDUS to noncuboidal volumes
While several coarse-graining schemes are possible for defining Ñ, a practically useful definition must satisfy the following three conditions: (i) Ñ must be a continuous function of particle positions, (ii) Ñ and N must be strongly correlated, and (iii) the calculation of Ñ and its derivatives should be straightforward. The choice of the form of Eq. 3a for cuboid volumes allows h̃(ri) to be expressed as a product of independent contributions from x, y, and z coordinates (as in Eq. 4a). While this formulation is particularly convenient for cuboidal volumes, the integral (Eq. 2b) that defines h̃(ri) would not be independent in the three coordinates for other regular volumes, such as spheres or cylindrical shells. Thus, calculating h̃(ri) and its gradient efficiently at every MD step would not be straightforward. To circumvent this complication, we bypass defining h̃(ri) via a coarse-graining function Φ as in Eq. 2b, and instead, define it directly as a product of independent contributions from the three co-ordinates (as in Eq. 4a) in the relevant co-ordinate system (e.g., cylindrical, spherical, etc.) as,
| (9) |
Here α represents the coordinate component index (e.g., x, y or z in Cartesian coordinates; r, θ or z for cylindrical ones, etc.) and h̃α (αi) may be defined in a manner analogous to h̃x(xi) (Eq. 4b and Fig. 2a).
However, unlike cuboidal volumes, where each coordinate component has two boundaries (e.g., xmin and xmax), the components in spherical or cylindrical systems may have either one boundary (e.g., the r coordinate for a spherical v), or no boundaries (e.g., the θ coordinate for a cylindrical v). These cases are illustrated in Fig. 2 and the expressions for h̃α(αi) and in each case are as follows:
-
Two boundaries: αmin ≤ α ≤ αmax.
(10a) and(10b) where and .
-
One boundary: α ≤ αmax.
(11a) and(11b) -
No boundaries:
(12a) and(12b) The forces are then given by
with(13a)
where ∂αi/∂xi is an element of the Jacobian for the coordinate transformation.(13b)
4 Generalization to collections of probe volumes
The above approach can be generalized to calculate Pv(N) in a probe volume v that is constructed from unions (vA ∪ vB) and intersections (vA ∩ vB) of regular subvolumes (vA, vB) and their complements (v̄A, v̄B). The subvolumes need not be of the same size or shape. When v is constructed from subvolumes using the complement, intersection and union operations, the corresponding definition of h̃(ri) is constructed by noting that,
| (14a) |
| (14b) |
and
| (14c) |
Here, the superscript (A) indicates that the function is evaluated with respect to the boundaries of sub-volume vA. For the special case of a probe volume v that is a union of G non-overlapping sub-volumes {vk} (k = 1, …, G), the above prescription yields,
| (15a) |
where
| (15b) |
Once again, the force on particle i resulting from a biasing potential, U, is finite and continuous everywhere, and is given by
| (16a) |
where
| (16b) |
The recipe given in Eqs. 10–13, when applied to vk can be used to evaluate and ∂h̃(k)/∂xi in Eqs. 15b and 16b.
5 INDUS in the NPT ensemble
When calculating Pv(N) using simulations in the NVT ensemble, as was done in Ref. [13], it is important to have a vapor bubble or a vapor-liquid interface in the simulation box. This vapor bubble can be nucleated, e.g., by applying a particle excluding field far from v, and can grow or shrink to accommodate water molecules pushed into or out of v. The resulting effective pressure of the system is close to the saturation vapor pressure of the fluid. Alternatively, we can perform simulations in the NPT ensemble without such a bubble, as long as the forces resulting from the umbrella potential are included in the calculation of the system pressure,
 . If v is fixed in space and does not move, grow or shrink as the simulation box dimensions fluctuate, then the contribution of the umbrella potential to
is
. If v is fixed in space and does not move, grow or shrink as the simulation box dimensions fluctuate, then the contribution of the umbrella potential to
is
| (17) |
where is the umbrella force on particle i, calculated as described in the preceding sections, and V is the system volume.
6 Results
We illustrate the extension of the INDUS method by calculating Pv(N) distributions for volumes of different shapes in bulk water. Biased MD simulations of bulk water were performed using the MD simulation packages LAMMPS [19] and GROMACS [20], modified in-house to implement INDUS. For the parameters of the coarse-graining function φ(α) in Eq. 3b, we used σ = 0.1 Å and αc = 0.2 Å (NVT ensemble) or αc = 0.3 Å (NPT ensemble). Each simulation box contained several thousand water molecules, modeled with the extended simple point charge water model (SPC/E) [21], and was periodic in all directions.
We selected volumes of four different shapes (a sphere, a cube, a cylinder, and a cuboid; see Figure 3), each with an average number of water molecules, 〈N〉, between 25 and 30. For these large volumes, INDUS allows us to measure probabilities for rare water fluctuations that are rather small (Pv(0) ≈ 10−30), whereas calculations using straightforward equilibrium simulations [2] provide accurate estimates only for much smaller volumes (〈N〉 ≈ 8 with corresponding Pv(0) ≈ 10−8). Although the volumes of the shapes that we have selected are similar to each other, they are not identical, and contain slightly different number of waters on average. Therefore, to compare them with each other as well as with a gaussian distribution, in Fig. 3a, we plot Pv as a function of , where 〈δN2〉 is the variance of N. Near the mean, the distributions are gaussian for all shapes, as expected. However, there are significant deviations from gaussian behavior in the low-N tails of Pv(N). Specifically, the smaller a shape’s surface-area to volume ratio, the fatter the low-N tail.
Fig. 3.

(a) log Pv as a function of for volumes of four different shapes: a sphere of radius 0.6 nm, a cube of side 0.9 nm, a ylinder of radius 0.3 nm and length 3 nm, and a thin cuboid of dimensions 0.3 nm × 1.6 nm × 1.6 nm. (b) The ratio of μex to surface area A, as a function of A/v for the four different shapes. The dashed line represents the surface tension, γ∞, of a vapor-liquid interface of SPC/E water [18].
In the large lengthscale limit, interface formation governs the free energy of cavity formation. LCW theory [8] predicted, and subsequent simulation studies verified [15,22–24], that the gradual crossover from small to large lengthscale physics occurs around 1 nm, which is roughly the length-scale of volumes selected here. Thus, we expect that shapes with smaller surface areas will have lower free energies of cavity formation and correspondingly fatter low-N tails, as observed in Fig. 3a. Fig. 3b further confirms that the free energy is governed by the physics of interface formation: the ratio of μex to the surface area of the probe volume, A, which can be interpreted as an apparent surface tension, γ̃, is approximately constant, independent of the shape of v. For nanoscopic objects, γ̃ depends on solute size and curvature, and is expected to be lower than the macroscopic surface tension of a vapor-liquid interface, γ∞ [13,22,25,26], in agreement with the results in Fig. 3b.
In Figure 4, we demonstrate the generalization of the INDUS method to collections of probe volumes by calculating Pv(N) in an arbitrarily shaped volume. The volume that we have chosen spells, ‘I N D U S’, using a collection of 156 non-overlapping cubic sub-volumes, each with a side of 0.25 nm.
Fig. 4.

Pv(N) obtained by umbrella sampling a probe volume that spells, ‘I N D U S’. The volume is composed of 156 cubic subvolumes of side 0.25 nm. The inset shows a superposition of five independent configurations, taken from an MD simulation with a strong biasing potential that empties the probe volume. The red spheres represent water oxygens. The letter ‘I’ in the inset is 0.5 nm wide and 2.0 nm tall.
In Fig. 5, we show that for a cube of side 0.9 nm, the Pv(N) distribution calculated in the NPT ensemble at a pressure,
= 1 bar, is identical to that obtained in the NVT ensemble with a buffering vapor-liquid interface. This is expected since
 ≪ kBT ≪ γA, so the energetics of emptying v is governed almost entirely by the cost of forming an interface (Figure 3b). The effective pressure in the NVT system is the coexistence pressure,
 , at T = 300 K, which is close to 0.06 bar. Since,
 <
≪ kBT, our simulations in the NVT ensemble are an excellent approximation to those in the NPT ensemble at 1 bar.
<
≪ kBT, our simulations in the NVT ensemble are an excellent approximation to those in the NPT ensemble at 1 bar.
Fig. 5.

Comparing Pv(N) for a cubic v of side 0.9 nm, obtained using NPT ensemble simulations (
= 1bar), with that obtained from NVT ensemble simulations having a buffering vapor-liquid interface located far from v.
The ability to calculate Pv(N) in the NPT ensemble allows us to study its pressure dependence systematically. In Fig. 6a, we show Pv(N) distributions in a cube of side 1.2 nm over a broad range of pressures. For pressures of 1 kbar and higher, the
term is no longer negligible, and opposes emptying v. Correspondingly, the low-N fat tail disappears gradually with increasing pressure. We also show in Fig. 6b that the free energy of hydrating the cubic cavity increases roughly linearly with pressure. The slope of μex versus
is the excess volume for solvating the cavity, and is equal to 0.67v for this cubic probe volume.
Fig. 6.

(a) log Pv as a function of for a cube of side 1.2 nm, calculated in the NPT ensemble, over a range of pressures at T = 300 K. (b) Free energy, μex, of the same cube as a function of pressure. A linear fit yields the excess volume of the cavity, vex ≈ 0.67v.
7 Conclusions
Given the importance of density fluctuations in understanding a range of solvation phenomena [3, 4,27–31], we anticipate that the INDUS method will be of broad interest. For instance, the size of density fluctuations at interfaces has been proposed recently as a measure of interface hydrophobicity [15,32–34]. The extended INDUS method is capable of characterizing hydrophobicity in complex environments that exhibit chemical heterogeneity [33,35–37], complex topography [25,38,39], and confinement [35,40–46]. The ability to calculate Pv(N) over a range of pressures using the NPT ensemble will be useful in studying the effect of pressure on biomolecular structure, and especially in quantifying the hydration contribution to the pressure denaturation of proteins [47]. Finally, quantifying Pv(N) in a region surrounding a solute molecule constitutes an important contribution in the quasichemical theories of solvation [48,49], and our extension of INDUS can be readily applied to quantify that contribution for a solute of arbitrary shape and size.
Acknowledgments
AJP would like to thank Sumanth Jamadagni for useful discussions. NIH Grant No. R01-GM078102-04 supported AJP in the early stages of this work, PV throughout, and DC in the early stages. In the later stages, DC was supported by the Director, Office of Science, Office of Basic Energy Sciences, Materials Sciences and Engineering Division and Chemical Sciences, Geosciences, and Biosciences Division of the U.S. Department of Energy under Contract No. DEAC02-05CH11231. SG gratefully acknowledges financial support of the NSF-NSEC (DMR-0642573) and NSF-CBET (0967937) grants.
Contributor Information
Amish J. Patel, Howard P. Isermann Department of Chemical & Biological Engineering, and Center for Biotechnology and Interdisciplinary Studies, Rensselaer Polytechnic Institute, Troy, NY 12180
Patrick Varilly, Department of Chemistry, University of California, Berkeley, CA 94720.
David Chandler, Department of Chemistry, University of California, Berkeley, CA 94720.
Shekhar Garde, Howard P. Isermann Department of Chemical & Biological Engineering, and Center for Biotechnology and Interdisciplinary Studies, Rensselaer Polytechnic Institute, Troy, NY 12180.
References
- 1.Widom B. J Chem Phys. 1963;39:2808. [Google Scholar]
- 2.Hummer G, Garde S, Garcia AE, Pohorille A, Pratt LR. P Natl Acad Sci USA. 1996;93:8951. doi: 10.1073/pnas.93.17.8951. [DOI] [PMC free article] [PubMed] [Google Scholar]
- 3.Garde S, Hummer G, Garcia AE, Paulaitis ME, Pratt LR. Phys Rev Lett. 1996;77:4966. doi: 10.1103/PhysRevLett.77.4966. [DOI] [PubMed] [Google Scholar]
- 4.Hummer G, Garde S, Garcia AE, Paulaitis ME, Pratt LR. P Natl Acad Sci USA. 1998;95:1552. doi: 10.1073/pnas.95.4.1552. [DOI] [PMC free article] [PubMed] [Google Scholar]
- 5.Chandler D. Phys Rev E. 1993;48:2898. doi: 10.1103/physreve.48.2898. [DOI] [PubMed] [Google Scholar]
- 6.Pratt LR, Chandler D. J Chem Phys. 1977;67:3683. [Google Scholar]
- 7.Stillinger FH. J Solution Chem. 1973;2:141. [Google Scholar]
- 8.Lum K, Chandler D, Weeks JD. J Phys Chem B. 1999;103:4570. [Google Scholar]
- 9.Chandler D. Nature. 2005;437:640. doi: 10.1038/nature04162. [DOI] [PubMed] [Google Scholar]
- 10.Lum K. PhD thesis. University of California; Berkeley: 1998. Hydrophobicity at small and large length scales. [Google Scholar]
- 11.Varilly P, Patel AJ, Chandler D. J Chem Phys. 2011;134:074109. doi: 10.1063/1.3532939. [DOI] [PMC free article] [PubMed] [Google Scholar]
- 12.Chandler D. Introduction to Modern Statistical Mechanics. Oxford University Press; 1987. [Google Scholar]
- 13.Patel AJ, Varilly P, Chandler D. J Phys Chem B. 2010;114:1632. doi: 10.1021/jp909048f. [DOI] [PMC free article] [PubMed] [Google Scholar]
- 14.Andreev S, Reichman D, Hummer G. J Chem Phys. 2005;123(19):194502. doi: 10.1063/1.2104529. [DOI] [PubMed] [Google Scholar]
- 15.Patel AJ, Varilly P, Jamadagni SN, Acharya H, Garde S, Chandler D. submitted. 2011 doi: 10.1073/pnas.1110703108. [DOI] [PMC free article] [PubMed] [Google Scholar]
- 16.Kumar S, Rosenberg JM, Bouzida D, Swendsen RH, Kollman PA. J Comp Chem. 1992;13:1011. [Google Scholar]
- 17.Souaille M, Roux B. Comput Phys Commun. 2001;135:40. [Google Scholar]
- 18.Vega C, de Miguel E. J Chem Phys. 2007;126:154707. doi: 10.1063/1.2715577. [DOI] [PubMed] [Google Scholar]
- 19.Plimpton SJ. J Comp Phys. 1995;117:1. [Google Scholar]
- 20.Hess B, Kutzner C, van der Spoel D, Lindahl E. J Chem Theory Comp. 2008;4:435. doi: 10.1021/ct700301q. [DOI] [PubMed] [Google Scholar]
- 21.Berendsen HJC, Grigera JR, Straatsma TP. J Phys Chem. 1987;91:6269. [Google Scholar]
- 22.Huang DM, Geissler PL, Chandler D. J Phys Chem B. 2001;105:6704. [Google Scholar]
- 23.Rajamani S, Truskett TM, Garde S. P Natl Acad Sci USA. 2005;102:9475. doi: 10.1073/pnas.0504089102. [DOI] [PMC free article] [PubMed] [Google Scholar]
- 24.Ashbaugh HS, Pratt LR. Rev Mod Phys. 2006;78:159. [Google Scholar]
- 25.Wallqvist A, Berne BJ. J Phys Chem. 1995;99:2885. [Google Scholar]
- 26.Ashbaugh HS, Paulaitis ME. J Am Chem Soc. 2001;123:10721. doi: 10.1021/ja016324k. [DOI] [PubMed] [Google Scholar]
- 27.Sedlmeier F, Horinek D, Netz RR. J Chem Phys. 2011;134:055105. doi: 10.1063/1.3530585. [DOI] [PubMed] [Google Scholar]
- 28.Liu P, Huang X, Zhou R, Berne BJ. Nature. 2005;437:159. doi: 10.1038/nature03926. [DOI] [PubMed] [Google Scholar]
- 29.Gross AS, Chu JW. J Phys Chem B. 2010;114:13333. doi: 10.1021/jp106452m. [DOI] [PubMed] [Google Scholar]
- 30.Eun C, Berkowitz ML. J Phys Chem B. 2010;114:13410. doi: 10.1021/jp1072654. [DOI] [PubMed] [Google Scholar]
- 31.Lopez CF, Darst RK, Rossky PJ. J Phys Chem B. 2008;112(19):5961. doi: 10.1021/jp075928t. [DOI] [PubMed] [Google Scholar]
- 32.Godawat R, Jamadagni SN, Garde S. P Natl Acad Sci USA. 2009;106:15119. doi: 10.1073/pnas.0902778106. [DOI] [PMC free article] [PubMed] [Google Scholar]
- 33.Acharya H, Vembanur S, Jamadagni SN, Garde S. Faraday Discuss. 2010;146:353. doi: 10.1039/b927019a. [DOI] [PubMed] [Google Scholar]
- 34.Sarupria S, Garde S. Phys Rev Lett. 2009;103:037803. doi: 10.1103/PhysRevLett.103.037803. [DOI] [PubMed] [Google Scholar]
- 35.Giovambattista N, Rossky PJ, Debenedetti PG. Phys Rev E. 2006;73:041604. doi: 10.1103/PhysRevE.73.041604. [DOI] [PubMed] [Google Scholar]
- 36.Hua L, Zangi R, Berne BJ. J Phys Chem C. 2009;113(13):5244. [Google Scholar]
- 37.Giovambattista N, Debenedetti PG, Rossky PJ. J Phys Chem C. 2007;111(3):1323. doi: 10.1021/jp071957s. [DOI] [PubMed] [Google Scholar]
- 38.Mittal J, Hummer G. Faraday Discuss. 2010;146:341. doi: 10.1039/b925913a. [DOI] [PMC free article] [PubMed] [Google Scholar]
- 39.Daub CD, Wang J, Kudesia S, Bratko D, Luzar A. Faraday Discuss. 2010;146:67. doi: 10.1039/b927061m. [DOI] [PubMed] [Google Scholar]
- 40.Berne BJ, Weeks JD, Zhou R. Ann Rev Phys Chem. 2009;60:85. doi: 10.1146/annurev.physchem.58.032806.104445. [DOI] [PMC free article] [PubMed] [Google Scholar]
- 41.Huang X, Margulis CJ, Berne BJ. P Natl Acad Sci USA. 2003;100:11953. doi: 10.1073/pnas.1934837100. [DOI] [PMC free article] [PubMed] [Google Scholar]
- 42.Zhou R, Huang X, Margulis CJ, Berne BJ. Science. 2004;305:1605. doi: 10.1126/science.1101176. [DOI] [PubMed] [Google Scholar]
- 43.Choudhury N, Pettitt BM. J Am Chem Soc. 2007;129:4847. doi: 10.1021/ja069242a. [DOI] [PMC free article] [PubMed] [Google Scholar]
- 44.Giovambattista N, Rossky PJ, Debenedetti PG. J Phys Chem B. 2009;113:13723. doi: 10.1021/jp9018266. [DOI] [PubMed] [Google Scholar]
- 45.Rasaiah JC, Garde S, Hummer G. Ann Rev Phys Chem. 2008;59:713. doi: 10.1146/annurev.physchem.59.032607.093815. [DOI] [PubMed] [Google Scholar]
- 46.Xu L, Molinero V. J Phys Chem B. 2010;114(21):7320. doi: 10.1021/jp102443m. [DOI] [PubMed] [Google Scholar]
- 47.Sarupria S, Ghosh T, Garcia AE, Garde S. Proteins. 2010;78:1641. doi: 10.1002/prot.22680. [DOI] [PubMed] [Google Scholar]
- 48.Asthagiri D, Pratt LR, Kress JD. Phys Rev E. 2003;68(4):041505. doi: 10.1103/PhysRevE.68.041505. [DOI] [PubMed] [Google Scholar]
- 49.Beck TL, Paulaitis ME, Pratt LR. The potential distribution theorem and models of molecular solutions. Cambridge University Press; 2006. [Google Scholar]