

Abstract
OBJECTIVE
Growth hormone (GH) deficiency is associated with insulin resistance and diabetes. The aim of the current study was to determine incidence of diabetes during GH replacement therapy (GHRT) and the effect of GHRT on fasting plasma glucose concentrations and HbA1c in adult patients with GH deficiency.
RESEARCH DESIGN AND METHODS
A total of 5,143 GH-deficient patients (male 49.9%; mean age ± SD, 49 ± 13 years; BMI 29.1 ± 5.9 kg/m2) were analyzed. Mean observation period was 3.9 years (range 0.01–13). Total number of patient-years was 20,106. Observed number of cases (O) was compared with expected number of cases (E). Reference rates were from Sweden, three additional European regions, and one U.S. region.
RESULTS
Patients who developed diabetes (n = 523) were older; had higher BMI, waist circumference, triglyceride concentrations, and blood pressure; and had lower HDL-cholesterol concentrations (P < 0.0001) than those who did not develop diabetes. Diabetes incidence was 2.6 per 100 patient-years, equal in both sexes, and significantly increased compared with the Swedish reference (O/E = 6.02; P < 0.0001) as well as with the four other populations (O/E = 2.11–5.22). O/E increased with BMI and decreased with duration of GHRT (P < 0.0001). There was no significant association with GH dose (P = 0.74) or IGF-I SDS (P = 0.47). In subjects not developing diabetes, plasma glucose concentrations increased from 84.4 ± 0.9 mg/dL to 89.5 ± 0.8 mg/dL (0.70 mg/dL/year) and HbA1c increased from 4.74 ± 0.04% to 5.09 ± 0.13% (0.036%/year) after 6 years of GHRT.
CONCLUSIONS
Diabetes incidence appears to be increased in GH-deficient patients receiving GHRT and exhibiting an adverse risk profile at baseline. Therefore, glucose homeostasis parameters should be monitored carefully in these patients.
Growth hormone (GH) plays an important and complex role in glucose, lipid, and protein metabolism in humans (1). It decreases glucose oxidation and glucose uptake by muscle and increases gluconeogenesis. In addition, GH stimulates lipolysis, lipid oxidation, and protein synthesis and decreases protein breakdown, amino acid degradation/oxidation, and hepatic urea formation (1). GH effects are modified by fasting, food intake, stress, and drugs.
Both GH deficiency and GH excess are associated with disturbances of carbohydrate metabolism (2–6). Therefore special attention has been paid to changes in glucose and HbA1c concentrations as well as glucose metabolism in GH-deficient patients during GH replacement therapy (GHRT). It has been speculated that possible adverse GH effects, leading to insulin resistance and hyperglycemia, might be counterbalanced by the favorable effects on body composition, resulting in muscle mass increase and fat mass decrease. Earlier studies report equivocal effects of GHRT on insulin sensitivity in GH-deficient patients (7–9). However, in these studies, only a small numbers of patients were included and the weight-based GH dose was higher than the currently used dose aimed at normalizing IGF-I. Indeed, it has been demonstrated that low-dose GHRT over a period of 12 months enhances insulin sensitivity, whereas GH in a so-called standard dose (0.48 mg/day) had no effect on glucose metabolism (10).
Here we report on the incidence of diabetes mellitus in a cohort of 5,143 GH-deficient patients receiving GHRT for up to 13 years. In addition, results of a longitudinal study looking into yearly fasting plasma glucose and HbA1c concentrations in a subgroup of patients over an observation period of 6 years are reported.
RESEARCH DESIGN AND METHODS
Out of the 13,294 patients in KIMS (Pfizer International Metabolic Database, data lock July 2008), only patients with severe adult-onset GH deficiency confirmed with an accepted GH stimulatory test (11) and naïve to GH treatment were selected. Moreover, patients with a history of Cushing disease or acromegaly, with diabetes at baseline, or who were <20 or >80 years were excluded. In addition, in patients with yearly control examinations and who did not develop diabetes, fasting plasma glucose concentrations and HbA1c levels were analyzed in a longitudinal study spanning an observation period of 6 years.
Diabetes was diagnosed according to the criteria of the American Diabetes Association (12) and/or when reported as an adverse event and/or when antidiabetes drugs were prescribed.
Plasma glucose and HbA1c values were determined in local laboratories; lipid and IGF-I concentrations were determined in a central laboratory. Serum IGF-I measurements were performed at Kabi Pharmacia, Stockholm, Sweden, between January 1994 and October 1997 and thereafter at Sahlgrenska University Hospital, Gothenburg, Sweden, using a radioimmunoassay acid/ethanol precipitation of IGF-binding proteins (Nichols Institute Diagnostic, San Juan Capistrano, CA) until November 2002, a chemiluminescence immunoassay (Nichols Advantage System) until September 2006, and currently, the Immulite 2500 (DPC Siemens, Eschborn, Germany) (13). IGF-I data are presented as SDS. SDS refers to the general population and corresponds to z score = (observed value – mean value of the reference population)/SD value of reference population. The reference range ± 2 SDS was calculated from an age-corrected algorithm in which IGF-I was expressed in micrograms per liter. Because the methods and references have changed over the years, different SDS formulas have been used. The SDS algorithm formula used between 1994 and 2002 was
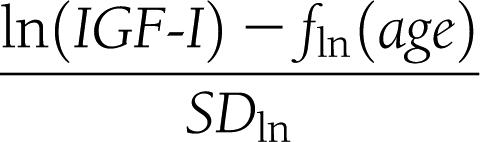 |
The mean function fln(age) on the natural logarithmic scale and the SD was (5.95 – 0.0197 × age) and 0.282, respectively, between 1994 and 1997. Between 1997 and 2002, the mean function was (5.92 – 0.0146 × age) and the SD was 0.272. From 2002 on, the algorithm of Brabant et al. (14) has been used. All central measurements were performed on the blood samples, which were routinely obtained.
Statistical analyses
Descriptive statistics are presented as mean ± SD or range (depending on the skewness of the respective distribution). Crude t tests were used for testing difference between patients with and without diabetes mellitus, respectively. The association between diabetes occurrence and sex, BMI (kg/m2), family history of diabetes (yes/no), age (years) at diagnosis of pituitary disease, age at diagnosis of GH deficiency, age at GHRT start, years between diagnosis of pituitary disease and GHRT start, years since GH treatment start, attained age during follow-up, number and nature of additional pituitary deficiencies, surgery before KIMS entry, and calendar period were assessed as described below. In a special 1-year left-truncated analysis, the association between diabetes and IGF-I SDS and treatment GH dose at 1 year from treatment start was assessed. Observed number of cases–to–expected number of cases (O/E) ratios of patients diagnosed with diabetes were calculated, stratified for age and sex. The expected number of cases was calculated using normal population-based age- and sex-specific reference incidence rates from a recently published study on diabetes incidence in the Kronoberg county of southern Sweden (15) and correspondingly stratified patient-years in KIMS. In addition, O/E ratios were calculated using four other reference populations from central and southern Europe as well as the U.S. (16–19). Patient-years were calculated from GH treatment start within KIMS to date of diabetes, latest known visit date, date of death, or KIMS exit date, whichever came first. The observed number of diabetes cases was assumed to follow a Poisson distribution. The 95% CIs were calculated using Byar approximation formula (20). More detailed modeling of O/E ratios, incorporating variables as above, was performed using Poisson regression (PROC GENMOD, SAS software version 8; SAS, Marlow, U.K.) fitted on grouped data. The analyses used the expected number of cases as an offset variable. In a special analysis, glucocorticoid replacement in all patients and testosterone replacement in males were analyzed as time-dependent covariates. For trend tests, category (group) mean values were used as numerical representations. Significance level was set at P < 0.05.
With control for age and sex, estimates of the yearly change in plasma glucose concentration and change in HbA1c were calculated in subgroups of patients (n = 293 for plasma glucose and n = 451 for HbA1c) with complete information at GH treatment start and at the following 6 yearly visits. Repeated-measurement regression was applied. Variance-covariance matrix was estimated as unstructured.
RESULTS
Data from 5,143 patients (male-to-female ratio 49.9:50.1; mean age at KIMS entry ± SD, 49 ± 13 years; BMI 29.1 ± 5.9 kg/m2) were analyzed. Mean follow-up time was 3.9 years (median 3.1, range 0.01–13), summing up to a total of 20,106 patient-years. In 649 patients, treatment duration was >8 years. Seven countries contributed 85% of the patients and 81% of the patient-years (Belgium, Germany, the Netherlands, Spain, Sweden, the U.K., and the U.S.).
A total of 523 (263 males and 260 females) of the 5,143 patients (10.2%) developed diabetes after a median period of 1.7 years (range 0.02–10.3). Baseline characteristics of GH-deficient patients developing diabetes during GHRT and patients not developing diabetes are shown in Table 1. Patients who developed diabetes were significantly older; had higher BMI, waist circumference, waist-to-hip ratio, and triglyceride concentrations; and had significantly higher systolic and diastolic blood pressure and significantly lower HDL-cholesterol concentrations. Total and LDL-cholesterol concentrations were comparable in the two groups, as were GH dose and IGF-I SDS at 1 year of GHRT.
Table 1.
Characteristics at GHRT start and GH dose and IGF-I SDS at 1 year of subjects developing diabetes or not

Overall diabetes incidence was 2.6 per 100 patient-years, gradually decreasing from the highest value of 4.1 per 100 patient-years during the 1st year of GHRT to 1.0 per 100 patient-years after >8 years of GHRT (Fig. 1). Incidence was equal in both sexes. The overall O/E ratio, compared with the incidence rate in Kronoberg county, was 6.0 (95% CI 5.5–6.6; P < 0.0001) and decreased from 10.8 in the 1st year of GHRT to 1.9 after 8 years (P trend < 0.0001) (Fig. 1). When the diabetes incidence in KIMS was compared with incidence rates in age-matched populations of other European regions and the U.S. (16–19), the O/E ratios ranged from 2.11 (1.86–2.39) to 5.22 (4.76–5.72); for more details, see Supplementary Table 1.
Figure 1.

Diabetes mellitus by years since the start of GHRT. Diabetes incidence per 100 patient-years (gray bar) and O/E cases when compared with a reference population in southern Sweden (15). O/E ratio (black bar) P trend < 0.0001. O/E ratio trend estimate in Poisson regression model −15.3%/year (95% CI −11.5 to −19.0; P < 0.0001).
In the final Poisson regression analysis, sex, BMI, attained age during follow-up, years between pituitary diagnosis and GH treatment start, and years since first treatment were statistically significantly associated with occurrence of diabetes, whereas the other studied variables were not (Tables 2 and 3). O/E ratio compared with the Swedish population increased 1.36% per year for year from diagnosis of pituitary disease to KIMS entry (95% CI 0–2.66) and decreased 15.3% per year for year since treatment start (11.5−19.0). For BMI, the O/E ratio increased 9.4% per unit BMI (7.8–10.95). Females had 22.9% higher O/E ratio than males (2.6–47.2). O/E decreased by ∼4% per year of attained age (P < 0.0001) with a small quadratic adjustment (Table 3). Table 2 shows the explanatory value for each included variable in the multiple regression model.
Table 2.
Likelihood ratio statistics for type 3 analysis of the multiple Poisson regression model giving the magnitude of the explanatory value of each variable on the O/E standardized incidence ratio; reference population Kronoberg county, Sweden, 1998–2001

Table 3.
Contrast estimates from the final multiple Poisson regression model

No statistically significant association between IGF-I SDS at 1 year of GHRT and diabetes incidence or O/E ratio was observed (P trend = 0.47 in the final Poisson regression model structure). In a similar manner, there was no statistical association between prescribed GH dose at 1 year and later occurrence of diabetes (P = 0.74 in the final Poisson regression model structure). It is noteworthy that although diabetes incidence increased as expected with advancing attained age, the O/E ratio, although increased in the younger patients, decreased with advancing attained age. Neither age at GHRT start, the number of additional pituitary deficiencies, nor family history of diabetes had an impact on development of diabetes (data not shown). In addition, O/E diabetes ratio was not statistically significantly different in patients receiving glucocorticoid, males receiving testosterone replacement therapy, or patients who had undergone pituitary surgery prior to entry into KIMS compared with those who had no substitution therapy or surgery.
In the subgroup of patients with available yearly fasting glucose and HbA1c data over a period of 6 years (239 and 451 patients, respectively), plasma glucose concentration increased continuously from 84.4 ± 0.9 mg/dL to 89.5 ± 0.8 mg/dL and HbA1c increased from 4.74 ± 0.04% to 5.09 ± 0.13% (with the effect of age removed). This represents a statistically significant increase of 0.70 mg/dL/year in plasma glucose concentration (95% CI 0.44–0.95; P trend < 0.0001) and of 0.036%/year in HbA1c value (0.024–0.048; P trend < 0.0001).
CONCLUSIONS
This is the first study to report on the incidence of diabetes mellitus in a large cohort of adult-onset GH-deficient patients receiving GHRT followed over a prolonged observation period with a mean of almost 4 years. The exclusion of patients with childhood-onset GH deficiency, Cushing disease, or acromegaly and those who had ever received GH ensured that confounding factors related to the cause or treatment of GH deficiency and possibly contributing to the development/manifestation of diabetes were eliminated to the largest possible extent.
We have shown, using a sample of the Swedish general population as reference population (15), the O/E ratio of 6.0 appeared significantly elevated in GH-deficient patients. This was also true when diabetes incidence in KIMS patients was compared with other reference populations from different European regions and the U.S. (16–19); age- and sex-adjusted O/E ratios ranged from 2.11 to 5.22. However, the GH-deficient patients exhibited at baseline a substantial adverse risk profile for developing diabetes. Indeed, the patients developing diabetes were significantly older; had significantly higher BMI, waist circumference, triglyceride concentrations, and blood pressure; and had significantly lower HDL-cholesterol concentrations when compared with those who did not develop diabetes. It has previously been shown that the presence of any of these risk factors considerably increases the risk for developing diabetes in the general population: 2-fold in the case of dyslipidemia or hypertension, 3-fold when BMI is 25–30 kg/m2, and 10-fold when BMI is >30 kg/m2 (16).
Because diabetes incidence varies in different regions of the world, O/E ratios were determined with reference populations from not only northern Europe (15) but also central (17,19) and southern Europe (16) and the U.S. (18). And again, an increased age- and sex-adjusted diabetes incidence was documented in comparison with these cohorts. All of these reports were population-based studies. The methods of ascertainment of diabetes differed in the different studies: oral glucose tolerance tests (Bruneck and KORA S4/F4), fasting glucose concentrations (Kronoberg), self-reported diagnosis (U.S. adults and MONICA Augsburg), and any of the above-mentioned methods plus an HbA1c value of ≥6.5% or the use of any antidiabetes drug in the KIMS study. In addition to the higher prevalence of risk factors for diabetes in GH-deficient patients, these different procedures certainly influence the reported incidence rates. Self-reporting indeed will give lower incidence rates than studies relying on repeated testing (fasting blood glucose or oral glucose tolerance test) of a representative sample of the whole population of an area. In the Kronoberg study, opportunistic screening (i.e., testing all individuals at routine or acute contact with the medical system, irrespective of the reason of consultation) was chosen. By including HbA1c and allowing all other possible ways of establishing the diagnosis of diabetes, we aimed at the most comprehensive way to identify manifestation of diabetes in any KIMS patient. We are well aware of the limitation of these different approaches; however, the ideal age-, sex-, and risk factor–matched GH-deficient group not receiving GHRT in a prospective controlled trial is not available. As a result of the established indication for GHRT in GH deficiency, it also is unlikely that such a study will ever be performed.
Diabetes incidence was not associated with the GH dose or with the IGF-I concentrations reached after 1 year, and diabetes incidence decreased with increasing duration of GHRT. These observations might be interpreted either as an indication that GH does not play a causative role in the development of diabetes or, alternatively, that diabetes develops above a GH threshold dose and IGF-I concentrations and that patients at risk for developing diabetes do so early after initiation of GHRT. It is noteworthy that an increased incidence of diabetes also was observed in GH-deficient patients not receiving GH (2). Another observation deserves special attention. Although diabetes incidence increased with advancing (attained) age in GH-deficient patients as expected from studies in non–GH deficient populations, the O/E ratio decreased with advancing age. Additional hormonal deficiencies and their replacement therapies were similar in patients who developed diabetes and those who did not, as well as the prevalence of a family history for diabetes and the age at diagnosis of pituitary disease. Also, O/E diabetes ratios were similar in patients receiving glucocorticoid, males receiving testosterone replacement therapy, and patients who had undergone pituitary surgery prior to KIMS entry when compared with those not receiving these therapies or without prior surgery.
The mechanism of the increased diabetes incidence in GH-deficient patients, whether or not on GHRT, is not fully understood. In GH-deficient patients not receiving GHRT, the adverse risk profile for diabetes can be considered an important contributing factor (21). This adverse risk profile is positively influenced by GHRT (21), but GH also opposes insulin action. Several studies in non–GH deficient control subjects and GH-deficient patients suggest a complex role of GH in carbohydrate metabolism, with free fatty acids playing an important role (1,22,23).
Another important finding of the current study is the small but significant increase of fasting glucose concentrations of 0.7 mg/dL/year and HbA1c levels of 0.036%/year. Although this seems low at first glance, it represents an increase of fasting glucose of 7.0 mg/dL and of HbA1c of 0.36% in 10 years, changes that must be considered as clinically relevant. However, these figures need to be compared with observations in GH-deficient patients without GHRT and in control subjects. In a recent smaller study, comparable increases in fasting blood glucose and HbA1c concentrations were observed in GH-deficient patients receiving GHRT and those not receiving GHRT (24). The increase in blood glucose in that study, with a mean observation period of 31.7 months, was 7.4 mg/dL (2.84 mg/dL/year) in untreated patients, a value considerably higher than the one observed in our cohort.
In summary, incidence of diabetes irrespective of reference population appears to be increased in this study of 5,143 patients followed over a mean observation period of 3.9 years. Patients who developed diabetes were significantly older, had a more adverse lipid profile, and had higher BMI and blood pressure at baseline. Fasting blood glucose concentrations and HbA1c also increased significantly; however, in another recent study comparing GH-treated to untreated GH-deficient subjects, no difference was observed. Thus, despite widely demonstrated benefits of GHRT in adult GH deficiency (25), a marked increase in the risk of developing diabetes must be considered. All patients, but particularly those with an adverse risk profile, should be carefully followed regarding parameters of glucose metabolism.
Acknowledgments
KIMS is sponsored by Pfizer Inc. A.L. is a paid consultant to the KIMS Strategic Advisory Board and a member of the KIMS International Board. A.F.M. and M.K.-H. are permanent employees of Pfizer Inc. M.G. and J.V. are members of the KIMS International Board. R.A. is a paid consultant to the KIMS Strategic Advisory Board and a member of the KIMS International Board. The authors were not paid for their contribution to this article. No other potential conflicts of interest relevant to this article were reported.
A.L. researched data and wrote the manuscript. A.F.M. researched data and reviewed the manuscript. M.K.-H. and M.T. researched data, contributed to discussion, and reviewed the manuscript. M.G., J.V., and R.A. contributed to discussion and reviewed the manuscript. A.L., M.K.-H., and R.A. are guarantors for the content of the manuscript.
Parts of this study were presented in abstract form at the 92nd annual meeting of the Endocrine Society, San Diego, California, 19–22 June 2010.
The authors thank the KIMS investigators and their patients for the provided data.
Footnotes
This article contains Supplementary Data online at http://care.diabetesjournals.org/lookup/suppl/doi:10.2337/dc11-0449/-/DC1.
References
- 1.Møller N, Jørgensen JO. Effects of growth hormone on glucose, lipid, and protein metabolism in human subjects. Endocr Rev 2009;30:152–177 [DOI] [PubMed] [Google Scholar]
- 2.Sharp PS, Beshyah SA, Johnston DG. Growth hormone disorders and secondary diabetes. Baillieres Clin Endocrinol Metab 1992;6:819–828 [DOI] [PubMed] [Google Scholar]
- 3.Jørgensen JO, Krag M, Jessen N, et al. Growth hormone and glucose homeostasis. Horm Res 2004;62(Suppl. 3):51–55 [DOI] [PubMed] [Google Scholar]
- 4.Murray RD, Shalet SM. Insulin sensitivity is impaired in adults with varying degrees of GH deficiency. Clin Endocrinol (Oxf) 2005;62:182–188 [DOI] [PubMed] [Google Scholar]
- 5.Cerasi E, Luft R. Insulin response to glucose loading in acromegaly. Lancet 1964;2:769–771 [DOI] [PubMed] [Google Scholar]
- 6.Luger A, Prager R, Gaube S, Graf H, Klauser R, Schernthaner G. Decreased peripheral insulin sensitivity in acromegalic patients. Exp Clin Endocrinol 1990;95:339–343 [DOI] [PubMed] [Google Scholar]
- 7.Riedl M, Ludvik B, Pacini G, et al. The increased insulin sensitivity in growth hormone-deficient adults is reduced by growth hormone replacement therapy. Eur J Clin Invest 2000;30:771–778 [DOI] [PubMed] [Google Scholar]
- 8.Rosenfalck AM, Maghsoudi S, Fisker S, et al. The effect of 30 months of low-dose replacement therapy with recombinant human growth hormone (rhGH) on insulin and C-peptide kinetics, insulin secretion, insulin sensitivity, glucose effectiveness, and body composition in GH-deficient adults. J Clin Endocrinol Metab 2000;85:4173–4181 [DOI] [PubMed] [Google Scholar]
- 9.Svensson J, Fowelin J, Landin K, Bengtsson BA, Johansson JO. Effects of seven years of GH-replacement therapy on insulin sensitivity in GH-deficient adults. J Clin Endocrinol Metab 2002;87:2121–2127 [DOI] [PubMed] [Google Scholar]
- 10.Yuen KCJ, Frystyk J, White DK, et al. Improvement in insulin sensitivity without concomitant changes in body composition and cardiovascular risk markers following fixed administration of a very low growth hormone (GH) dose in adults with severe GH deficiency. Clin Endocrinol (Oxf) 2005;63:428–436 [DOI] [PubMed] [Google Scholar]
- 11.Gasco V, Corneli G, Rovere S, et al. Diagnosis of adult GH deficiency. Pituitary 2008;11:121–128 [DOI] [PubMed] [Google Scholar]
- 12.American Diabetes Association Diagnosis and classification of diabetes mellitus (Position Statement). Diabetes Care 2010;33(Suppl. 1):S62–S69 [DOI] [PMC free article] [PubMed] [Google Scholar]
- 13.Underwood LE, Murphy MG. Radioimmunoassay of the somatomedins/insulin-like growth factors. In Radioimmunoassay in Basic and Clinical Pharmacology. Patrano C, Peskar BA, Eds. Berlin, Springer-Verlag, 1987, p. 561–574 [Google Scholar]
- 14.Brabant G, von zur Mühlen A, Wüster C, et al. ; German KIMS Board Serum insulin-like growth factor I reference values for an automated chemiluminescence immunoassay system: results from a multicenter study. Horm Res 2003;60:53–60 [DOI] [PubMed] [Google Scholar]
- 15.Thunander M, Petersson C, Jonzon K, et al. Incidence of type 1 and type 2 diabetes in adults and children in Kronoberg, Sweden. Diabetes Res Clin Pract 2008;82:247–255 [DOI] [PubMed] [Google Scholar]
- 16.Bonora E, Kiechl S, Willeit J, et al. ; Bruneck study Population-based incidence rates and risk factors for type 2 diabetes in white individuals: the Bruneck study. Diabetes 2004;53:1782–1789 [DOI] [PubMed] [Google Scholar]
- 17.Rathman W, Strassburger K, Heier M, et al. Incidence of type 2 diabetes in the elderly German population and the effect of clinical and lifestyle risk factors: KORA S4/F4 cohort study. Diabet Med 2009;26:1212–1219 [DOI] [PubMed] [Google Scholar]
- 18.Geiss LS, Pan L, Cadwell B, Gregg EW, Benjamin SM, Engelgau MM. Changes in incidence of diabetes in U.S. adults, 1997-2003. Am J Prev Med 2006;30:371–377 [DOI] [PubMed] [Google Scholar]
- 19.Meisinger C, Thorand B, Schneider A, Stieber J, Döring A, Löwel H. Sex differences in risk factors for incident type 2 diabetes mellitus: the MONICA Augsburg cohort study. Arch Intern Med 2002;162:82–89 [DOI] [PubMed] [Google Scholar]
- 20.Breslow NE, Day NE. Statistical methods in cancer research. Vol II—The design and analysis of cohort studies. IARC Sci Publ 1987;(82):1–406 [PubMed] [Google Scholar]
- 21.Abs R, Feldt-Rasmussen U, Mattsson AF, et al. Determinants of cardiovascular risk in 2589 hypopituitary GH-deficient adults—a KIMS database analysis. Eur J Endocrinol 2006;155:79–90 [DOI] [PubMed] [Google Scholar]
- 22.Segerlantz M, Bramnert M, Manhem P, Laurila E, Groop LC. Inhibition of the rise in FFA by Acipimox partially prevents GH-induced insulin resistance in GH-deficient adults. J Clin Endocrinol Metab 2001;86:5813–5818 [DOI] [PubMed] [Google Scholar]
- 23.Krag MB, Gormsen LC, Guo ZK, et al. Growth hormone-induced insulin resistance is associated with increased intramyocellular triglyceride content but unaltered VLDL-triglyceride kinetics. Am J Physiol Endocrinol Metab 2007;292:E920–E927 [DOI] [PubMed] [Google Scholar]
- 24.Woodmansee WW, Hartman ML, Lamberts SWJ, Zagar AJ, Clemmons DR; International HypoCCS Advisory Board Occurrence of impaired fasting glucose in GH-deficient adults receiving GH replacement compared with untreated subjects. Clin Endocrinol (Oxf) 2010;72:59–69 [DOI] [PubMed] [Google Scholar]
- 25.Carroll PV, Christ ER, Bengtsson BÅ, et al. ; Growth Hormone Research Society Scientific Committee Growth hormone deficiency in adulthood and the effects of growth hormone replacement: a review. J Clin Endocrinol Metab 1998;83:382–395 [DOI] [PubMed] [Google Scholar]