

Abstract
Background and Aims
Purple acid phosphatases (PAPs) are members of the metallo-phosphoesterase family and have been known to play important roles in phosphorus (P) acquisition and recycling in plants. Low P availability is a major constraint to growth and production of soybean, Glycine max. Comparative studies on structure, transcription regulation and responses to phosphate (Pi) deprivation of the soybean PAP gene family should facilitate further insights into the potential physiological roles of GmPAPs.
Methods
BLAST searches were performed to identify soybean PAP genes at the phytozome website. Bioinformatic analyses were carried out to investigate their gene structure, conserve motifs and phylogenetic relationships. Hydroponics and sand-culture experiments were carried out to obtain the plant materials. Quantitative real-time PCR was employed to analyse the expression patterns of PAP genes in response to P deficiency and symbiosis.
Key Results
In total, 35 PAP genes were identified from soybean genomes, which can be classified into three distinct groups including six subgroups in the phylogenetic tree. The expression pattern analysis showed flowers possessed the largest number of tissue-specific GmPAP genes under normal P conditions. The expression of 23 GmPAPs was induced or enhanced by Pi starvation in different tissues. Among them, nine GmPAP genes were highly expressed in the Pi-deprived nodules, whereas only two GmPAP genes showed significantly increased expression in the arbuscular mycorrhizal roots under low-P conditions.
Conclusions
Most GmPAP genes are probably involved in P acquisition and recycling in plants. Also we provide the first evidence that some members of the GmPAP gene family are possibly involved in the response of plants to symbiosis with rhizobia or arbuscular mycorrhizal fungi under P-limited conditions.
Keywords: Soybean, Glycine max, purple acid phosphatase, expression analysis, phylogenetic analysis, phosphorus nutrition, symbiosis
INTRODUCTION
Purple acid phosphatases (PAPs) are members of the metallo-phosphoesterase family. They are characterized by the purple/pink colour as the result of a charge-transfer transition at 550–560 nm from the tyrosine residue to ‘chromophoric’ ferric ion (Oddie et al., 2000). PAPs often carry seven invariant amino acid residues distributed in five blocks (DXG/GDXXY/GNH(D/E)/VXXH/GHXH; bold letters indicate metal-ligating residues), which are required for the co-ordination of the bimetal nuclear centre in the active site (Li et al., 2002).
Plant PAPs are traditionally classified into two groups: high-molecular-weight large PAPs and low-molecular-weight small PAPs. Large PAPs belong to oligomeric proteins with a polypeptide of about 55 kDa, which generally possess two domains and are more homologous to the enzymes found in fungi and mycobacteria (Li et al., 2002; Olczak et al., 2003; Tran et al., 2010a). Conversely, small PAPs have only one domain in their structure and are typically monomeric proteins with a molecular mass around 35 kDa and are closely related to mammalian PAPs (Li et al., 2002; Olczak et al., 2003).
The physiological functions of plant PAPs are diverse, including phosphorus (P) acquisition (Tomscha et al., 2004; Lung et al., 2008; Liang et al., 2010), generation of reactive oxygen species (del Pozo et al., 1999; Liao et al., 2003; Zhang et al., 2008), involvement in flower development (Zhu et al., 2005) and cell wall biosynthesis (Kaida et al., 2008, 2009, 2010). Plant PAPs have mostly been studied for their potential involvement in P nutrition, which can catalyse the hydrolysis of various phosphate esters and anhydrides in the pH range 4–7 (Oddie et al., 2000; Li et al., 2002). And the majority of PAPs are inducible by phosphate (Pi) deprivation. Phosphorous is one of the most important macronutrients involved in many physiological and biochemical processes in plants and is also a vital structural constituent of many biomolecules (Duff et al., 1994; Tran et al., 2010a). However, P concentration in soil solution is often low because of intensive erosion, weathering and strong P fixation by organic compounds, free Fe or Al oxides. Therefore, low P availability is a major constraint to plant growth and development. During long-term evolution, plants have developed a number of adaptive strategies to cope with low P, including enhancing secretory and intracellular PAP activity to mobilize the sparingly soluble P from the growth medium and recycle P in plants (Olczak et al., 2003; Xiao et al., 2006; Wang et al., 2009, 2010). Under low-P conditions, a variety of PAP activities are up-regulated, indicating that PAP activity plays a very important role in P acquisition (Li et al., 2002; Bozzo et al., 2006; Zhang et al., 2011). Meanwhile, Nodulin PvNOD33, a putative phosphatase from common bean, was induced during nodule development in mature nodules, and was possibly involved in carbon metabolism (Roussis et al., 2003). In common bean, the activities of phosphatases and phytases had also been increased in the nodules under low-P conditions, indicating that N2-fixing legumes can enhance P utilization within the nodules to tolerate P deficiency (Araújo et al., 2008). In addition, the up-regulation of PAP gene expression and the subsequent secretion of PAP by arbuscular mycorrhizal (AM) roots were also reported to accelerate mineralization of organic P in the rhizosphere through the extraradical hyphae as well as the roots (Ezawa et al., 2005).
PAPs are commonly found in a wide range of plant species. In arabidopsis, 29 different PAP genes were annotated, several of which are transcriptionally induced during Pi deprivation (del Pozo et al., 1999; Li et al., 2002; Hurley et al., 2010; Tran et al., 2010b). Zhang et al. (2011) identified 26 rice PAP genes from O. japonica genomes. Soybean (Glycine max is one of the most important food and oil crops, and also serves as an important protein source for both human consumption and animal feed (Kereszt et al., 2007). Until now, only four soybean PAPs have been reported (LeBansky et al., 1992; Schenk et al., 1999, 2000; Hegeman and Grabau, 2001; Liao et al., 2003). In the present study, we identified 35 soybean PAP genes, and subsequently performed a more thorough phylogenetic analysis of the GmPAP family. A study on expression patterns of these PAPs in soybean was also conducted to investigate the potential functions of this gene family in plant P nutrition. Also we provide the first evidence that some members of the GmPAP gene family are possibly involved in the response of plants to symbiosis with rhizobia or arbuscular mycorrhizal fungi under P-limited conditions.
MATERIALS AND METHODS
Database search and bioinformatics analysis of PAP genes in the soybean genome
A BLAST search was performed with the known soybean (Glycine max) PAP AY151271 at the phytozome website (http://www.phytozome.net). The predicted amino acid sequences of 22 different PAPs with conserved sequence motifs (DXG/GDXXY/GNH(E/D)/VX2H/GHXH) were identified in the soybean genome. Then the BLAST searches using the other known soybean PAPs, AAF60316, AAF19820 and AAK49438, were separately performed using the same website, resulting in 13 additional predicted soybean PAPs. Finally, the predicted protein sequences of 35 PAPs were each used as query sequences for another round of blastp searches on the phytozome website. No more predicted PAPs were found, suggesting that the total number of predicted PAPs in the soybean genome was likely to be 35. The 35 soybean PAPs, with the prefix ‘GmPAP’ for Glycine max PAP, were named according to their positions on the different chromosomes (Li et al., 2002).
Genome sequences of the GmPAPs members were retrieved from the phytozome website. A phylogenetic tree of GmPAPs, AtPAPs and OsPAPs based on entire protein sequence alignments using ClustalX was constructed by the neighbor-joining method with 1000 bootstrap replicates in the MEGA 4·1 program. Complete deletion was used to deal with gaps or missing data in sequences. The distance between sequences was estimated after Poisson correction.
Numbers of exons and introns, first exon length and total exon length were extracted from the phytozome website. The molecular weight and isoelectric point of the protein were predicted by the ExPASy server (www.expasy.org). The subcellular location predication was performed by Target P 1·1. The signal peptide of GmPAPs was predicted by the Signal P 3·0 server. The N-glycosylation site of the protein was predicted by the NetNGlyc 1·0 server.
Plant materials and treatments
The P-efficient soybean genotype HN66 was used as the plant material, which was also the start material for soybean transformation in our laboratory (Wang et al., 2009). Soybean plants were cultured in solution in a glasshouse. For expression analysis of GmPAPs in the different tissues of soybean plants, 1 week after germination, the seedlings were transplanted into full-strength nutrient solution containing 250 µm KH2PO4, 3000 µm KNO3, 2000 µm Ca(NO3)2, 250 µm MgSO4, 25 µm MgCl2, 12·5 µm H3BO3, 1 µm MnSO4, 1 µm ZnSO4, 0·25 µm CuSO4, 0·25 µm (NH4)6Mo7O24 and 25 µm Fe-Na-EDTA. The seedlings were grown for 10 d till the first trifoliate leaves were fully developed and then they were treated with different P concentrations (5 µm and 500 µm KH2PO4). At 18 d after treatment, roots, stems, leaves and flowers were harvested separately. At 29 d after treatment, young pods and seeds were harvested separately. All tissue samples were stored at –80 °C for RNA extraction. Shoots and roots were harvested at 29 d after treatments for total root length, P content and biomass determination.
For the rhizobium inoculation experiment, 1 week after germination, the soybean seedlings were inoculated with rhizobia, Bradyrhizobium sp. BXYD3 and transplanted into LN (100 µm N added) nutrient solution containing 5 µm or 500 µm KH2PO4. Fifty days after planting, the nodules were harvested for RNA extraction and quantitative real-time PCR (q-PCR) analysis.
For the AM fungi infection experiment, soybean seeds were germinated in sand culture with or without the inoculants containing the infected maize roots, Glomus mosseae spores and mycelium. One week after germination, the seedlings were transplanted into sand culture and irrigated by nutrient solution containing 5 µm KH2PO4 every day. Fifty days after planting, the roots were harvested for RNA extraction and q-PCR analysis. The sub-samples from lateral roots of soybean plants were harvested for AM assay according to Wang et al. (2011). All the experiments, unless specified otherwise, had four biological replicates.
Determination of root traits and P content
Plants were harvested after appropriate treatments as described above. Roots were scanned and the digital images were quantified with computer image analysis software (Win-Rhizo Pro, Régent Instruments, Québec, Canada) for measuring total root length (Zhao et al., 2004). P contents of shoots and roots were determined using the phosphorus–molybdate blue colour reaction and by measuring absorbance at 700 nm (Murphy and Riley, 1962).
RNA extraction and quantitative real-time PCR
Total RNA was extracted from roots, stems, leaves, flowers, young pods and seeds of soybean plants using RNAiso™ Plus reagent (TaKaRa) according to the manufacturer's instructions. RNA samples were treated with RNase-free DNase I (Invitrogen) to avoid amplification from genomic DNA. The first cDNA strand was synthesized from total RNA using the MMLV-reverse transcriptase (Promega, USA) according to the protocol from the supplier. Quantitative real-time PCR was performed using SYBR® Premix EX TaqTM (TaKaRa). All the reactions were done on a Rotor-Gene 3000 (Corbett Research, Australia). The soybean housekeeping gene EF-1a was used as an endogenous control to normalize the samples. The specific primer sequences for 35 predicted GmPAPs are listed in Supplementary Data Table S1 (available online). Reaction conditions for thermal cycling were: 95 °C for 1 min, 40 cycles of 95 °C for 15 s, 54–62 °C for 15 s and 72 °C for 30 s. The annealing temperature (54–62 °C) was adjusted to suit the amplification of the individual PAP. Fluorescence data were collected during the cycle at 72 °C.
Statistical analyses
All of the data were analysed using Microsoft Excel 2000 (Microsoft Company, USA) for calculating mean and standard error, and SAS 8·1 (SAS Institute Inc., Cary, NC, USA) for one-way ANOVA.
RESULTS
Comparative analysis and nomenclature of soybean PAPs
In total, 35 putative GmPAP genes were identified according to repeated blastp searches of the protein database of soybean in phytozome website (Table 1). The amino acid sequences were available for all GmPAPs in the Phytozome website (Supplementary Data Text File). Among them, 32 soybean PAPs had the conserved seven metal-binding residues (D, D, Y, N, H, H, H) of PAP metalloesterase in five consensus blocks (Supplementary Data Table S2). However, the three remaining soybean PAPs (GmPAP1, GmPAP5 and GmPAP7) differed in those conserved domains of PAPs. GmPAP1 lost two (fourth and fifth) motifs. In GmPAP5, one conserved residue in the first block was changed. In GmPAP7, three conserved residues in the first, second and fifth blocks, respectively, were changed (Supplementary Data Table S2). However, GmPAP1, GmPAP5 and GmPAP7 were still considered as potential PAPs because their overall amino acid sequences showed the highest homology with the known plant PAPs when BLASTing in NCBI.
Table 1.
General information for the 35 GmPAPs
| Gene loci | Proposed name | No. of exons/introns | First/total exon length (bp) | Predicted size (kDa) | Signal peptide (length, cleave site) | Subcellular location* |
|---|---|---|---|---|---|---|
| Glyma02g13070 | GmPAP1 | 11/10 | 76/1353 | 50·3 | No | Unknown |
| Glyma02g45950 | GmPAP2 | 5/4 | 162/1365 | 51·6 | 22, ATA-TP | S |
| Glyma03g35190 | GmPAP3 | 5/4 | 141/1311 | 49·4 | 22, LLS-QE | S |
| Glyma03g35200 | GmPAP4 | 4/3 | 265/1110 | 42·9 | No | M |
| Glyma04g37180 | GmPAP5 | 10/9 | 90/1281 | 48·9 | No | M |
| Glyma05g03320 | GmPAP6 | 12/11 | 204/1836 | 68·7 | 29, VYG-FA | S |
| Glyma05g26920 | GmPAP7 | 9/8 | 77/930 | 35·2 | No | Unknown |
| Glyma05g26930 | GmPAP8 | 7/6 | 198/1008 | 37·9 | 30, SIA-EL | S |
| Glyma05g33630 | GmPAP9 | 7/6 | 192/996 | 37·6 | 28, ASA-EL | S |
| Glyma05g33640 | GmPAP10 | 7/6 | 177/990 | 37·1 | 23, VSG-LL | S |
| Glyma06g03100 | GmPAP11 | 20/19 | 108/3012 | 114·6 | No | Unknown |
| Glyma06g17860 | GmPAP12 | 12/11 | 198/1872 | 70·5 | 27, AFA-QS | S |
| Glyma08g06090 | GmPAP13 | 7/6 | 183/987 | 37·4 | 25, ASA-EL | S |
| Glyma08g09880 | GmPAP14 | 7/6 | 171/969 | 36·5 | 20, VSS-AV | S |
| Glyma08g09900 | GmPAP15 | 7/6 | 195/999 | 37·3 | 29, SKA-KL | S |
| Glyma08g09910 | GmPAP16 | 7/6 | 198/1008 | 37·9 | 30, SIA-EL | S |
| Glyma08g40210 | GmPAP17 | 12/13 | 183/1851 | 69·1 | 28, VVS-DE | S |
| Glyma08g42670 | GmPAP18 | 5/4 | 243/1410 | 53·1 | No | Unknown |
| Glyma08g46550 | GmPAP19 | 6/5 | 277/1584 | 59·7 | 29, GHC-HI | S |
| Glyma09g36360 | GmPAP20 | 8/7 | 168/1395 | 53·2 | 26, GSS-SP | S |
| Glyma10g08300 | GmPAP21 | 5/4 | 262/1137 | 58·1 | No | Unknown |
| Glyma11g36510 | GmPAP22 | 5/4 | 106/1018 | 48·9 | No | Unknown |
| Glyma12g01000 | GmPAP23 | 8/7 | 168/1395 | 53·1 | 23, CNG-GT | S |
| Glyma12g34960 | GmPAP24 | 8/7 | 57/1275 | 49·4 | No | Unknown |
| Glyma13g23090 | GmPAP25 | 10/9 | 18/1428 | 54·5 | 29, GSA-GI | S |
| Glyma13g35610 | GmPAP26 | 8/7 | 195/1407 | 54·1 | 32, CHG-GK | S |
| Glyma14g02790 | GmPAP27 | 5/4 | 216/1383 | 52·2 | 45, ATP-QY | S |
| Glyma17g11790 | GmPAP28 | 10/9 | 50/1539 | 59·5 | 47, VLA-SF | M |
| Glyma18g00410 | GmPAP29 | 8/7 | 229/1653 | 62·2 | No | Unknown |
| Glyma18g17580 | GmPAP30 | 13/12 | 57/1839 | 69·1 | No | Unknown |
| Glyma19g03220 | GmPAP31 | 7/6 | 208/1532 | 57·2 | No | Unknown |
| Glyma19g37850 | GmPAP32 | 4/3 | 262/1140 | 43·0 | No | Unknown |
| Glyma19g37860 | GmPAP33 | 5/4 | 150/1290 | 48·6 | 27, VYG-YV | S |
| Glyma20g01470 | GmPAP34 | 7/6 | 183/984 | 37·5 | 25, AFA-EL | S |
| Glyma20g03260 | GmPAP35 | 2/1 | 705/1989 | 74·2 | 24, AES-KP | S |
* S and M = secretory and mitochondrial, respectively.
Based on the prediction by Signal P 3·0 and Target P 1·1, 21 soybean PAPs contained a 20- to 45-amino acid N-terminal secretory pathway signal peptide, and three PAPs (GmPAP4, GmPAP5 and GmPAP28) had a mitochondrial-targeting transit peptide (Table 1). All soybean PAPs except GmPAP7 appeared to be heavily glycosylated, containing one to ten potential N-linked glycosylation sites as predicted by NetNGlyc 1·0 (Supplementary Data Table S2).
Thirty-five soybean PAP genes were unevenly distributed on all chromosomes except for chromosomes 1, 7, 15 and 16 (Table 1). Among them, chromosome 8 had the highest number of PAP genes with seven, followed by chromosome 5 with five (Table 1). The nomenclature of soybean PAPs followed the system for naming members of multigene families in arabidopsis, which was based on gene chromosome locations (Table 1; Li et al., 2002). This nomenclature would be of benefit to future studies on individual PAP genes in soybean.
Phylogenetic analysis and classification of soybean PAPs
A phylogenetic tree of the amino acid sequences of the soybean, arabidopsis and rice PAPs is shown in Fig. 1. According to previous analysis in arabidopsis (Li et al., 2002), the 35 GmPAPs, 29 AtPAPs and 26 OsPAPs had been classified into three distinct groups (I, II and III) including eight subgroups (Ia-1, Ia-2, Ib-1, Ib-2, IIa, IIb, IIIa and IIIb; Fig. 1). Thirty-five GmPAPs covered six subgroups in the phylogenetic tree. Among eight subgroups, Subgroup Ia-1 only contained AtPAPs. Subgroup Ia-2 mainly consisted of GmPAPs 11, 20, 23 (previously named GmPAP1), 24, 25, 26 and 28 (previously named GmPAP3), AtPAPs 10, 12 and 26 and five OsPAPs. GmPAP29, which was previously named GmPhy and had high phytase activity in the cotyledons of germinated soybeans (Hegeman and Grabau, 2001), clustered with GmPAPs 19, 22 and 31, AtPAPs 13, 15 and 23 and OsPAPs 15 and 23 to form subgroup Ib-1. GmPAPs 2, 3, 4, 18, 21, 27, 32 and 33, which had high identity to AtPAPs 18, 20, 21, 22 and six OsPAPs, were in subgroup Ib-2. GmPAP35, AtPAP2, AtPAP9 and OsPAP9a were in subgroup IIa, which had a higher molecular weight. GmPAPs 1 and 5, of which the conserve metal-binding residues were changed, clustered with GmPAPs 6, 12, 17 and 30, AtPAPs 1, 24 and 27, and 8 OsPAPs to form the subgroup IIb. Group III consisted of subgroups IIIa and IIIb. Subgroup IIIa had only AtPAP16. Subgroup IIIb contained nine GmPAPs, eight AtPAPs and four OsPAPs. There was a close correlation between the classification of the groups and predicted molecular weight of the PAPs. Groups I and II comprised the high molecular weight PAPs. In contrast, group III consisted of the low molecular weight mammalian-like PAPs (Fig. 1).
Fig. 1.

Phylogenetic analysis of GmPAPs, AtPAPs and OsPAPs. Phylogenetic tree of 35 GmPAPs, 29 AtPAPs and 26 OsPAPs was constructed by the neighbor-joining method with 1000 bootstrap replicates in the MEGA 4·1 program.
Growth responses of soybean plants to Pi deprivation
Growth and P uptake of soybean plants were significantly affected by P availability (Fig. 2). High P significantly increased plant dry weight and P content by about 5- and 24-fold, respectively. Furthermore, sufficient P supply also promoted plant root growth as indicated by a 150 % increase in total root length at the high P level compared with that at the low P level (Fig. 2).
Fig. 2.
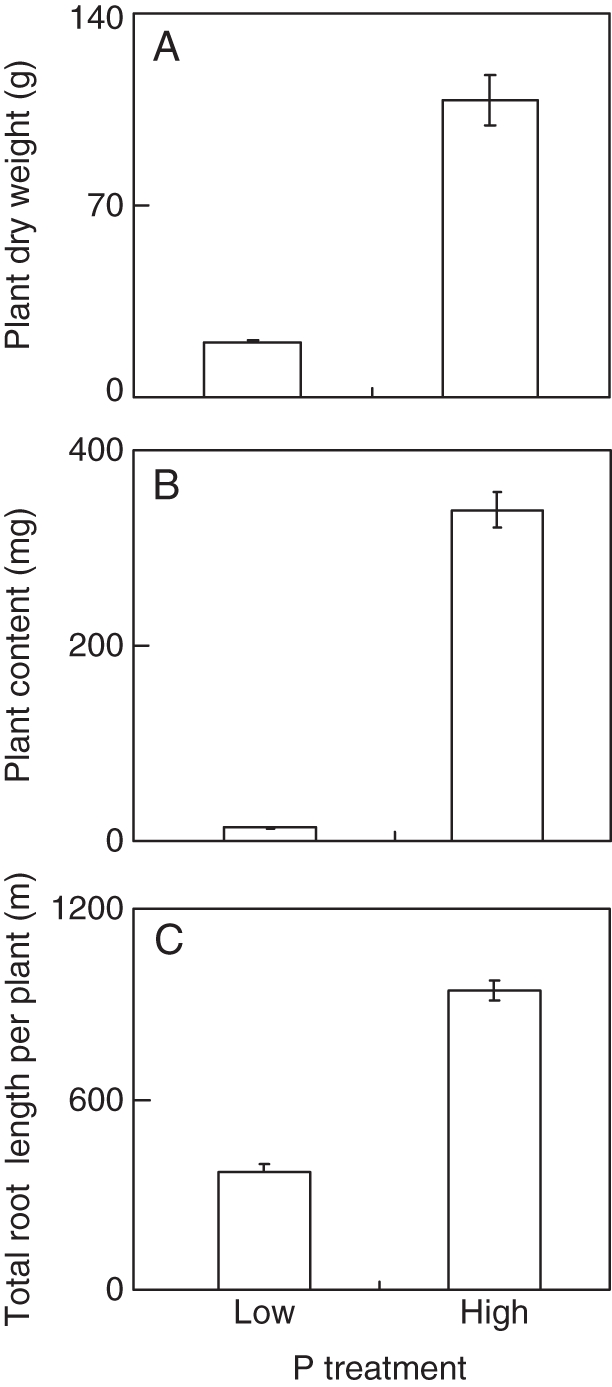
Effects of different P treatments on individual plant dry weight, P content and total root length of soybean. Ten-day-old seedlings were transferred to solutions containing either a low P concentration (5 µm KH2PO4) or a high P concentration (500 µm KH2PO4) for 29 d before measurement. (A) Plant dry weight; (B) P content; (C) total root length. Data in the figure are the mean of four replicates ± s.e. per plant.
Tissue-specific expression of soybean PAP genes and their responses to Pi deprivation
To identify the tissue-specific expression of GmPAP genes in soybean, the expression patterns of 35 GmPAP genes in the six tissues were investigated and analysed according to their tissue specificity. The results showed flowers possessed the largest number of tissue-specific GmPAP genes, followed by seeds and roots (six, four and three genes, respectively; Fig. 3 and Supplementary Data Table S3). This is similar to the results of the soybean gene expression atlas, which found the larger numbers of tissue-specific genes in flowers and seeds (Libault et al., 2010; Severin et al., 2010).
Fig. 3.

Number and identity of GmPAP genes showing tissue-specific expression across six different tissues under normal P treatments. The fold-change between the expression levels of the most highly expressed and second most highly expressed GmPAP genes was calculated (Libault et al., 2010). A threshold of 2-fold was used to determine the tissue specificity of GmPAP genes.
The transcriptional responses of 35 GmPAP genes to Pi deprivation in different tissues were also investigated using q-PCR with gene-specific primers. The results showed that the expression of 23 GmPAPs was induced or increased by Pi-deprivation treatment (Table 2 and Supplementary Data Table S4). Among them, roots and leaves possessed the largest number of P-deficient inducible GmPAP genes, followed by stems, indicating that GmPAPs play very important roles in P acquisition from the growth medium and P recycling in plants. The expressions of GmPAP17 and GmPAP34 were very highly induced in roots and leaves, respectively. Those of GmPAP28 and GmPAP35 were induced in stems and roots, respectively. The expressions of the other 19 GmPAP genes were induced by Pi deprivation in more than two tissues. In contrast, GmPAP2, GmPAP5, GmPAP6 and GmPAP19 were constitutively expressed regardless of P supply (Table 2 and Supplementary Data Table S4). Interestingly, the expressions of GmPAP26, GmPAP29 and GmPAP30 were inhibited by Pi deprivation in roots, leaves and seeds, respectively. Pi deprivation also inhibited the expression of GmPAP22 in both leaves and pods (Table 2 and Supplementary Data Table S4). In addition, the expressions of GmPAP11, GmPAP14 and GmPAP15 were up-regulated in stems and leaves, leaves, roots and leaves, respectively, whereas, they were down-regulated in seeds by Pi deprivation. Conversely, the expression of GmPAP24 was down-regulated in roots and pods, and up-regulated in flowers and seeds by Pi deprivation (Table 2 and Supplementary Data Table S4).
Table 2.
Transcriptional responses of 35 GmPAP genes to Pi deprivation in six tissues
| Gene name | Root |
Stem |
Leaf |
Flower |
Pod |
Seed |
||||||
|---|---|---|---|---|---|---|---|---|---|---|---|---|
| LP/HP | HP/LP | LP/HP | HP/LP | LP/HP | HP/LP | LP/HP | HP/LP | LP/HP | HP/LP | LP/HP | HP/LP | |
| GmPAP1 | + | . | + | . | + | . | . | . | . | . | . | . |
| GmPAP2 | . | . | . | . | . | . | . | . | . | . | . | . |
| GmPAP3 | ++ + | . | . | . | + | . | + | . | . | . | . | . |
| GmPAP4 | ++ | . | ++ | . | ++ | . | + | . | + | . | . | . |
| GmPAP5 | . | . | . | . | . | . | . | . | . | . | . | . |
| GmPAP6 | . | . | . | . | . | . | . | . | . | . | . | . |
| GmPAP7 | . | . | . | . | + | . | . | . | . | . | + | . |
| GmPAP8 | + | . | + | . | ++ | . | . | . | . | . | . | . |
| GmPAP9 | ++ | . | ++ + | . | ++ + | . | ++ | . | ++ | . | . | . |
| GmPAP10 | ++ | . | . | . | ++ | . | + | . | + | . | + | . |
| GmPAP11 | . | . | ++ | . | ++ | . | . | . | . | . | . | ––– |
| GmPAP12 | + | . | ++ | . | + | . | . | . | . | . | . | |
| GmPAP13 | ++ | . | ++ | . | ++ + | . | + | . | ++ | . | . | . |
| GmPAP14 | . | . | . | . | ++ | . | . | . | . | – | . | ––– |
| GmPAP15 | ++ + | . | . | . | + | . | . | . | . | . | . | –– |
| GmPAP16 | ++ | . | . | . | + | . | + | . | + | . | . | . |
| GmPAP17 | ++ + | . | . | . | . | . | . | . | . | . | . | . |
| GmPAP18 | + | . | . | . | . | . | . | . | . | . | ++ + | . |
| GmPAP19 | . | . | . | . | . | . | . | . | . | . | . | . |
| GmPAP20 | ++ | . | ++ | . | + | . | . | . | . | . | . | . |
| GmPAP21 | ++ | . | + | . | + | . | + | . | + | . | . | . |
| GmPAP22 | . | . | . | . | . | – | . | . | . | – | . | . |
| GmPAP23 | ++ | . | ++ | . | + | . | + | . | . | . | . | . |
| GmPAP24 | . | ––– | . | . | . | . | + | . | . | – | ++ + | . |
| GmPAP25 | ++ | . | ++ | . | ++ | . | . | . | . | . | . | . |
| GmPAP26 | . | – | . | . | . | . | . | . | . | . | . | . |
| GmPAP27 | . | . | + | . | . | . | . | . | . | . | ++ + | . |
| GmPAP28 | . | . | + | . | . | . | . | . | . | . | . | . |
| GmPAP29 | . | . | . | . | . | – | . | . | . | . | . | . |
| GmPAP30 | . | . | . | . | . | . | . | . | . | . | . | – |
| GmPAP31 | ++ + | . | + | . | . | . | + | . | . | . | ++ | . |
| GmPAP32 | ++ | . | ++ | . | ++ | . | + | . | + | . | . | . |
| GmPAP33 | ++ | . | ++ | . | ++ + | . | + | . | + | . | . | . |
| GmPAP34 | . | . | . | . | ++ + | . | . | . | . | . | . | . |
| GmPAP35 | + | . | . | . | . | . | . | . | . | . | . | . |
The fold-changes of the expression of GmPAP genes between low P (LP) and high P (HP) were calculated and the expression differences were then classified into four groups, according to their response to Pi deprivation, as follows: +/–, induced/inhibited by Pi deprivation (≥3- and <10-fold changes between the expression levels of LP and HP); ++ /–– highly induced/inhibited (≥10- and <100-fold changes); ++ + /–––, very highly induced/inhibited (≥100-fold changes). A minus sign represents higher expression of GmPAP genes in HP than in LP.
Expression patterns of soybean PAP genes in nodules and AM roots
Soybean genome annotation showed about 100 soybean genes played very important roles in nodulation (Schmutz et al., 2010). RNA-Seq atlas of soybean found that the nodule was one of the organs which was strongly enriched in highly tissue-specific genes (Libault et al., 2010; Severin et al., 2010). To reveal the responses of GmPAP genes in the nodules to Pi deprivation, q-PCR analyses were performed using total RNA from the nodules of soybean under both Pi-sufficient and Pi-deficient conditions (Fig. 4). The results showed that the expressions of nine GmPAP genes were induced by Pi deprivation and highly expressed in the nodules under low-P conditions. Eight GmPAP genes showed predominant expression in the Pi-sufficient nodules. The other members of GmPAPs were expressed in the nodules regardless of P supply (Fig. 4).
Fig. 4.

The fold-change of the expression of GmPAP genes between low-P and high-P treatments in the nodules. Seven-day-old seedlings were innoculated with rhizobia, Bradyrhizobium sp. BXYD3 and transferred to solutions containing either a low P concentration (5 µm KH2PO4) or a high P concentration (500 µm KH2PO4) for 50 d before nodule harvest. The fold-change of the expression of GmPAP genes between low and high treatments in the nodules was calculated (y-axis). Negative values represent higher expression of GmPAP genes in high than in low P. A threshold of 2-fold was used to determine the responsiveness of GmPAP genes in the nodules to P treatments. Data in the figure are the mean of four replicates ± s.e.
In addition, in order to investigate the effects of AM infection on the expression of GmPAPs, the Pi-deprived roots of soybean with and without AM inoculation were harvested for RNA extraction and q-PCR analysis (Fig. 5). The colonization percentage of the soybean roots was above 70 % when inoculated with AM fungi (data not shown). The results showed that only the expression levels of GmPAP4 and GmPAP33 were significantly increased in the roots inoculated with AM fungi compared with those not inoculated. Seventeen GmPAP genes showed predominant expression under no-inoculation conditions. The rest of the GmPAP genes were expressed in the Pi-deprived roots regardless of AM inoculation (Fig. 5).
Fig. 5.

The fold-change of the expression of GmPAP genes between roots with arbuscular mycorrhyza (+AM) and roots without arbuscular mycorrhyza (–AM) under low-P treatments. Soybean seeds were germinated in sand culture with or without the AM inoculants. Seven-day-old seedlings were transferred to solutions with a low concentration of P (5 µm KH2PO4) sand culture for 50 d before harvest. The fold-change of the expression of GmPAP genes between +AM and –AM roots was calculated (y-axis). Negative values represent higher expression of GmPAP genes in –AM roots than that of +AM roots. A threshold of 2-fold was used to determine the responsiveness of GmPAP genes in the roots to AM formation under low-P conditions. Data in the figure are the mean of four replicates ± s.e.
DISCUSSION
Soybean PAP gene family
Although PAPs are found in a wide variety of organisms, only four PAP genes have previously been reported in soybean (LeBansky et al., 1992; Schenk et al., 1999, 2000; Hegeman and Grabau, 2001; Liao et al., 2003). In the present study, more PAP genes were found in soybean than in arabidopsis and rice (Li et al., 2002; Zhang et al., 2011). In total, 35 GmPAPs were identified by blastp searches on the phytozome website (Table 1 and Supplementary Data Text File), 32 of which possessed the seven metal-binding residues characteristic of PAP metalloesterase (Supplementary Data Table S2). GmPAPs 1, 5 and 7 missed some of the conserved metal-binding residues, but showed the highest homology with the known AtPAPs 1, 24 and 7, respectively (Fig. 1). A search in Gbrowse on the phytozome site indicated that gene structures of GmPAPs 1, 5 and 7 were well supported by Blast and EST alignments, but the alignment evidence was sparse in some areas within these genes. Therefore, future work with PCR, ESTs or RNAseq might be needed to confirm the results of sequencing and assembly.
Previous studies have shown that the soybean genome has undergone at least two rounds of large-scale duplication events, approx. 59 and 13 million years ago, which resulted in more homeologous gene pairs in soybean, such as GmPAP9 and GmPAP13, GmPAP7 and GmPAP14, GmPAP17 and GmPAP30 and GmPAP4 and GmPAP33 (Schmutz et al., 2010; Libault et al., 2010). The two duplication events also resulted in more complex transcriptional controls in soybean. Many single-gene activities in arabidopsis were encoded by multigene families in soybean (Schmutz et al., 2010). These might explain why there are more PAP genes in soybean than in arabidopsis and rice.
Structural and phylogenetic analysis of GmPAPs
Some studies have shown that most of the known PAPs are secreted and are soluble proteins (Olczak et al., 2003). In this study, protein sequence analyses predicted that 24 out of the 35 GmPAPs contained an N-terminal secretory pathway signal peptide, indicating either vacuolar localization or secretion (Table 1). Three GmPAPs were located in the mitochondria, which was the source of reactive oxygen species, particularly in non-photosynthetic tissues (Table 1; Dat et al., 2000). This implied these three GmPAPs had a unique physiological role distinguishing them from the other GmPAPs (Liao et al., 2003). Glycosylation is an important post-translational modification, which influences protein folding, localization and trafficking, biological activity and half-life (Olczak et al., 2003; Tran et al., 2010a). All GmPAPs (except GmPAP7) were predicted to contain various numbers of N-glycosylation sites, implying that they are all initially targeted to the Golgi apparatus where glycosylation occurs, and control secretion of PAPs (Supplementary Data Table S2; Olczak et al., 2003; Tran et al., 2010a).
Gene expression could be closely related to gene size in soybean (Severin et al., 2010). The soybean genes with large coding regions were often transcriptionally active. Our results found that all the 35 GmPAP genes had a greater number of exons and a longer total exon length compared with the genes identified as neither highly confident nor transcriptionally active in previous studies, and belonged to highly confident genes and were transcriptionally active (Table 1; Severin et al., 2010). However, the number of exons and first exon length varied greatly among the 35 GmPAP genes and did not show the same trends as previous reports, which found the genes with preferential expression for underground tissues had a longer first exon than seed and aerial tissues. Conversely, aerial tissues had a greater number of exons than seed and underground tissues (Table 1, Fig. 3 and Supplementary Data Table S3; Severin et al., 2010).
In arabidopsis, phylogenetic analysis showed that there was a close correlation between the classification of the groups and the molecular weight of the predicted AtPAPs (Li et al., 2002). Our studies also found the 35 GmPAPs, 29 AtPAPs and 26 OsPAPs can be classified into three distinct groups (I, II and III) with different molecular weights (Fig. 1 and Table 1). This indicates that this classification may reflect the structure and biochemical differences among the different types of PAPs (Li et al., 2002). At the subgroup level, GmPAPs grouped with AtPAPs and OsPAPs together, suggesting a close relationship between PAPs from different species. In addition, PAPs clustered in the same group show similar biochemical properties (Li et al., 2002). For instance, GmPAP29 (previously named GmPhy) grouped with AtPAP15 in subgroups Ib-1. Both of them had high phytase activity (Hegeman and Grabau, 2001; Zhang et al., 2008; Kuang et al., 2009; Wang et al., 2009).
Tissue-specific expression of GmPAP genes and their involvement in P nutrition
The soybean genome annotation showed 69 145 putative genes were predicted in palaeopolyploid soybean, 46 430 genes of which were identified as highly confident genes (Schmutz et al., 2010). All 35 GmPAP genes have already been annotated in the soybean genome, and could be found in the transcriptionally active genes identified by Libault et al. (2010) and Severin et al. (2010). Libault et al. (2010) reported that soybean nodule, flower and pod exhibited the highest degree of tissue-specific gene expression. Severin et al. (2010) found dramatic tissue-specific gene expression in seed development and nodule tissues. In agreement with these, our studies found that soybean flowers and seeds possessed the largest numbers of tissue-specific GmPAP genes (Fig. 3). In addition, some GmPAP genes showed similar tissue-specific expression patterns to the results reported by Libault et al. (2010) and Severin et al. (2010). For example, GmPAP21 genes were very specifically expressed in the roots under normal P treatments in the present study (Fig. 3 and Supplementary Data Table S3), which was consistent with the results from Libault et al. (2010) and Severin et al. (2010). However, in the present study, GmPAP14 genes were expressed very specifically in the seeds (Fig. 3 and Supplementary Data Table S3) but Libault et al. (2010) and Severin et al. (2010) found that they exhibited the highest expression in the roots. Such differences might be caused by the different sampling times, plant materials and Rhizobium inoculation in these three independent experiments.
A number of plant PAPs were induced by P deficiency and were suggested to play crucial roles in P acquisition and assimilation (Li et al., 2002; Lung et al., 2008; Tran et al., 2010b). Previous studies have demonstrated that two GmPAP genes (GmPAP15 and GmPAP23) were induced in roots and leaves under Pi-starvation conditions to synthesize more PAP enzymes to cope with P deficiency (Liao et al., 2003). Our results showed the transcript level of 66 % GmPAP genes were induced or increased by Pi-deprivation treatment (Table 2 and Supplementary Data Table S4), which was higher than those of OsPAP (48 %) (Zhang et al., 2011) and AtPAP (14 %) genes (Li et al., 2002; Tran et al., 2010a), indicating different evolution history in different plant species. The up-regulation of more GmPAP genes in Pi-deprived plants also implied that they could be involved in plant P nutrition. In contrast, four GmPAP genes were constitutively expressed regardless of P supply, and four GmPAP genes were highly expressed under high-P conditions, indicating that PAPs may also perform other biochemical functions in plants as well as being involved in P acquisition (Table 2 and Supplementary Data Table S4). Expression analysis also found that some GmPAP genes were expressed in specific tissues under Pi starvation conditions (Table 2 and Supplementary Data Table S4). For instance, two GmPAP genes were expressed specifically in the root, implying that their potential functions are in hydrolysing and mobilizing Pi from organic P in the soil for extracellular P acquisition. In contrast, several GmPAP genes were predominantly expressed in leaves or seeds, suggesting their involvement in the intracellular utilization of Pi reserves or other Pi-containing compounds in plants. It is interesting to note that the Pi starvation-induced GmPAPs often clustered together in the phylogenetic tree. However, PAPs with phytase activity in subgroup Ib-1 showed low responsive to P deficiency (Fig. 1, Table 2 and Supplementary Data Table S4).
The involvement of GmPAPs in plant symbiosis
The root nodule is formed by the interaction of the root systems of leguminous plants with rhizobia (Mylona et al., 1995). Generally, higher levels of phosphorus are required by nodulated legumes for optimal symbiotic performance (Deng et al., 1998). The biological N2 fixation in P-deficient plants is usually impaired by a low P supply (Almeida et al., 2000). Some studies have revealed that acid phosphatase existed in the symbiosome membrane of soybean root nodules (Sarath et al., 1993). The RNA-Seq atlas showed that GmPAP16 and GmPAP30 had highest tissue-specific expression in nodules (Libault et al., 2010; Severin et al., 2010). Bean plants in Pi-deficient conditions showed increased activity of phosphatases and phytases in nodules (Araújo et al., 2008). Our results showed that nine out of the 35 GmPAPs were highly expressed in the nodules under low-P conditions (Fig. 4) and were possibly involved in Pi homeostasis in the nodules (Pereira and Bliss, 1987), Pi absorption directly by the nodules and bacteroids (Al-Niemi et al,. 1998), or increased N2 fixation ability to compensate for reduced nodulation (Almeida et al., 2000). In addition, it is interesting to note that all GmPAP genes expressed in Pi-deprived root nodules showed predominant expression in soybean plants under P-limited conditions. In contrast, some GmPAP genes (not GmPAP7 and GmPAP34) which were highly expressed in Pi-sufficient root nodules showed a low response to P deficiency in soybean plants (Fig. 4, Table 2 and Supplementary Data Table S4).
AM fungi play an important role in plant growth. Generally, AM formation improves P nutrition and results in decreased PAP gene expression. The expression of the PAP genes was reduced by AM formation in Medicago (Liu et al., 1998). In our studies, most of the GmPAP genes showed reduced expression levels in AM roots under low-P conditions (Fig. 5). However, it has also been found that in some plants, such as wheat and onion (Dodd et al., 1987), maize (Fries et al., 1998) and marigold (Ezawa and Yoshida, 1994; Ezawa et al., 2005), the increased acid phosphatase activity of the roots was in response to AM formation. Ezawa et al. (2005) found one PAP gene (TpPAP1) from marigold had higher transcript levels in response to AM formation under Pi-deficient conditions. Our studies also found that the expression levels of two GmPAP genes, GmPAP4 and GmPAP33, were significantly increased by AM infection under P-limited conditions (Fig. 5), suggesting that AM fungi might activate part of the plant systems which respond to low-P, subsequently promoting hydrolysation of organic P in the rhizosphere, and salvaging P esters leaked from the root cell for P recycling (Barrett-Lennard et al., 1993; Ezawa et al., 2005). In addition, it is interesting to note that GmPAP4 and GmPAP33 were grouped into one small group in the phylogenetic tree, and also showed predominant expression in P-limited soybean plants (Fig. 5, Table 2 and Supplementary Data Table S4).
In summary, the present study has characterized and compared the molecular features of the GmPAP gene family, and conducted the expression pattern analysis of GmPAPs in soybean. The results suggested that flowers possessed the largest number of tissue-specific GmPAP genes under normal P conditions, and most GmPAP genes were possibly involved in P acquisition and recycling in plants. Also we provide the first evidence that some members of the GmPAP gene family are possibly involved in the response of plants to symbiosis with rhizobia or arbuscular mycorrhizal fungi under P-limited conditions. Further investigations are required to reveal their biological functions as well as the biochemical mechanisms of their actions by combined application of genetic, biochemical and immunological methods.
SUPPLEMENTARY DATA
ACKNOWLEDGEMENTS
We thank Dr B. L. Lim at the University of Hong Kong and Dr H. X. Shou at Zhejiang University for their critical comments which improved the manuscript. We also thank our colleagues Drs J. Tian, J. Zhao and J. X. Wang for helpful discussions and comments. This research is supported by the National Natural Science Foundation of China (30971853, 30890131).
LITERATURE CITED
- Almeida JPF, Hartwig UA, Frehner M, Nösberger J, Lüscher A. Evidence that P deficiency induces N feedback regulation of symbiotic N2 fixation in white clover (Trifolium repens L.) Journal of Experimental Botany. 2000;51:1289–1297. [PubMed] [Google Scholar]
- Al-Niemi TS, Kahn ML, McDermott TR. Phosphorus uptake by bean nodules. Plant and Soil. 1998;198:71–78. [Google Scholar]
- Araújo AP, Plassard C, Drevon JJ. Phosphatase and phytase activities in nodules of common bean genotypes at different levels of phosphorus supply. Plant and Soil. 2008;312:129–138. [Google Scholar]
- Barrett-Lennard EG, Dracup M, Greenway H. Role of extracellular phosphatases in the phosphorus-nutrition of clover. Journal of Experimental Botany. 1993;44:1595–1600. [Google Scholar]
- Bozzo GG, Dunn EL, Plaxton WC. Differential synthesis of phosphate-starvation inducible purple acid phosphatase isozymes in tomato (Lycopersicon esculentum) suspension cells and seedlings. Plant, Cell & Environment. 2006;29:303–313. doi: 10.1111/j.1365-3040.2005.01422.x. [DOI] [PubMed] [Google Scholar]
- Dat J, Vandenabeele S, Vranova E, Van Montagu M, Inze D, Van Breusegem F. Dual action of the active oxygen species during plant stress responses. Cellular and Molecular Life Sciences. 2000;57:779–795. doi: 10.1007/s000180050041. [DOI] [PMC free article] [PubMed] [Google Scholar]
- Deng S, Summers ML, Kahn ML, McDermott TR. Cloning and characterization of a Rhizobium meliloti nonspecific acid phosphatase. Archives of Microbiology. 1998;170:18–26. doi: 10.1007/s002030050610. [DOI] [PubMed] [Google Scholar]
- Dodd JC, Burton CC, Burns RG, Jeffries P. Phosphatase activity associated with the roots and the rhizosphere of plants infected with vesicular-arbuscular mycorrhizal fungi. New Phytologist. 1987;107:163–172. [Google Scholar]
- Duff SMG, Sarath G, Plaxton WC. The role of acid phosphatases in plant P metabolism. Physiologia Plantarum. 1994;90:791–800. [Google Scholar]
- Ezawa T, Yoshida T. Characterization of phosphatase in marigold roots infected with vesicular-arbuscular mycorrhizal fungi. Soil Science and Plant Nutrition. 1994;40:255–264. [Google Scholar]
- Ezawa T, Hayatsu M, Saito M. A new hypothesis on the strategy for acquisition of phosphorus in arbuscular mycorrhiza: up-regulation of secreted acid phosphatase gene in the host plant. Molecular Plant–Microbe Interactions. 2005;18:1046–1053. doi: 10.1094/MPMI-18-1046. [DOI] [PubMed] [Google Scholar]
- Fries LLM, Pacovsky RS, Safir GR, Kaminski J. Phosphorus effect on phosphatase activity in endomycorrhizal maize. Physiologia Plantarum. 1998;103:162–171. [Google Scholar]
- Hegeman CE, Grabau EA. A novel phytase with sequence similarity to purple acid phosphatases is expressed in cotyledons of germinating soybean seedlings. Plant Physiology. 2001;126:1598–1608. doi: 10.1104/pp.126.4.1598. [DOI] [PMC free article] [PubMed] [Google Scholar]
- Hurley BA, Tran HT, Marty NJ, et al. The dual-targeted purple acid phosphatase isozyme AtPAP26 is essential for efficient acclimation of Arabidopsis to nutritional phosphate deprivation. Plant Physiology. 2010;153:1112–1122. doi: 10.1104/pp.110.153270. [DOI] [PMC free article] [PubMed] [Google Scholar]
- Kaida R, Hayashi T, Kaneko TS. Purple acid phosphatase in the walls of tobacco cells. Phytochemistry. 2008;69:2546–2551. doi: 10.1016/j.phytochem.2008.07.008. [DOI] [PubMed] [Google Scholar]
- Kaida R, Satoh Y, Bulone V, et al. Activation of β-glucan synthases by wall-bound purple acid phosphatase in tobacco cells. Plant Physiology. 2009;150:1822–1830. doi: 10.1104/pp.109.139287. [DOI] [PMC free article] [PubMed] [Google Scholar]
- Kaida R, Serada S, Norioka N, et al. Potential role for purple acid phosphatase in the dephosphorylation of wall proteins in tobacco cells. Plant Physiology. 2010;153:603–610. doi: 10.1104/pp.110.154138. [DOI] [PMC free article] [PubMed] [Google Scholar]
- Kereszt A, Li D, Indrasumunar A, et al. Agrobacterium rhizogenes-mediated transformation of soybean to study root biology. Nature Protocols. 2007;2:948–952. doi: 10.1038/nprot.2007.141. [DOI] [PubMed] [Google Scholar]
- Kuang R, Chan K, Yeung E, Lim BL. Molecular and biochemical characterization of AtPAP15, a purple acid phosphatase with phytase activity, in Arabidopsis. Plant Physiology. 2009;151:199–209. doi: 10.1104/pp.109.143180. [DOI] [PMC free article] [PubMed] [Google Scholar]
- LeBansky BR, McKnight T, Griffing LR. Purification and characterization of a secreted purple phosphatase from soybean suspension culture. Plant Physiology. 1992;99:391–395. doi: 10.1104/pp.99.2.391. [DOI] [PMC free article] [PubMed] [Google Scholar]
- Li D, Zhu H, Liu K, et al. Purple acid phosphatases of Arabidopsis thaliana: comparative analysis and differential regulation by phosphate deprivation. Journal of Biological Chemistry. 2002;277:27772–27781. doi: 10.1074/jbc.M204183200. [DOI] [PubMed] [Google Scholar]
- Liang C, Tian J, Lam H, Lim BL, Yan X, Liao H. Biochemical and molecular characterization of PvPAP3, a novel purple acid phosphatase isolated from common bean enhancing extracellular ATP utilization. Plant Physiology. 2010;152:854–865. doi: 10.1104/pp.109.147918. [DOI] [PMC free article] [PubMed] [Google Scholar]
- Liao H, Wong FL, Phang TH, et al. GmPAP3, a novel purple acid phosphatase-like gene in soybean induced by NaCl stress but not phosphorus deficiency. Gene. 2003;318:103–111. doi: 10.1016/s0378-1119(03)00764-9. [DOI] [PubMed] [Google Scholar]
- Libault M, Farmer A, Joshi T, et al. An integrated transcriptome atlas of the crop model Glycine max, and its use in comparative analyses in plants. The Plant Journal. 2010;63:86–99. doi: 10.1111/j.1365-313X.2010.04222.x. [DOI] [PubMed] [Google Scholar]
- Liu H, Trieu AT, Blaylock LA, Harrison MJ. Cloning and characterization of two phosphate transporters from Medicago truncatula roots: regulation in response to phosphate and to colonization by arbuscular mycorrhizal (AM) fungi. Molecular Plant–Microbe Interactions. 1998;11:14–22. doi: 10.1094/MPMI.1998.11.1.14. [DOI] [PubMed] [Google Scholar]
- Lung SC, Leung A, Kuang R, Wang Y, Leung P, Lim BL. Phytase activity in tobacco (Nicotiana tabacum) root exudates is exhibited by a purple acid phosphatase. Phytochemistry. 2008;69:365–373. doi: 10.1016/j.phytochem.2007.06.036. [DOI] [PubMed] [Google Scholar]
- Murphy J, Riley J. A modified single solution method for the determination of phosphate in natural water. Analytica Chimica Acta. 1962;27:31–35. [Google Scholar]
- Mylona P, Pawlowski K, Bisseling T. Symbiotic nitrogen fixation. The Plant Cell. 1995;7:869–885. doi: 10.1105/tpc.7.7.869. [DOI] [PMC free article] [PubMed] [Google Scholar]
- Oddie GW, Schenk G, Angel NZ, et al. Structure, function, and regulation of tartrate-resistant acid phosphatase. Bone. 2000;27:575–584. doi: 10.1016/s8756-3282(00)00368-9. [DOI] [PubMed] [Google Scholar]
- Olczak M, Morawiecka B, Watorek W. Plant purple acid phosphatases: genes, structures and biological function. Acta Biochemica Polonica. 2003;50:1245–1256. [PubMed] [Google Scholar]
- Pereira PAA, Bliss FA. Nitrogen fixation and plant growth of common bean (Phaseolus vulgaris L.) at different levels of phosphorus availability. Plant and Soil. 1987;104:79–84. [Google Scholar]
- del Pozo JC, Allona I, Rubio V, et al. A type 5 acid phosphatase gene from Arabidopsis thaliana is induced by phosphate starvation and by some other types of phosphate mobilizing/oxidative stress conditions. The Plant Journal. 1999;19:579–589. doi: 10.1046/j.1365-313x.1999.00562.x. [DOI] [PubMed] [Google Scholar]
- Roussis A, Flemetakis E, Dimou M, et al. A putative phosphatase whose expression is induced during Phaseolus vulgaris nodule development. Plant Physiology and Biochemistry. 2003;41:719–725. [Google Scholar]
- Sarath G, Duff SMG, Pegden R, Wade KL. Acid phosphatases from soybean nodules. Plant Physiology. 1993;102(Suppl. 1):55. [Google Scholar]
- Schenk G, Ge YB, Carrington LE, et al. Binuclear metal centers in plant purple acid phosphatases: Fe–Mn in sweet potato and Fe–Zn in soybean. Archives of Biochemistry and Biophysics. 1999;370:183–189. doi: 10.1006/abbi.1999.1407. [DOI] [PubMed] [Google Scholar]
- Schenk G, Guddat LW, Ge Y, et al. Identification of mammalian-like purple acid phosphatases in a wide range of plants. Gene. 2000;250:117–125. doi: 10.1016/s0378-1119(00)00186-4. [DOI] [PubMed] [Google Scholar]
- Schmutz J, Cannon SB, Schlueter J, et al. Genome sequence of the palaeopolyploid soybean. Nature. 2010;463:178–183. doi: 10.1038/nature08670. [DOI] [PubMed] [Google Scholar]
- Severin AJ, Woody JL, Bolon YT, et al. RNA-Seq Atlas of Glycine max: a guide to the soybean transcriptome. BMC Plant Biology. 2010;10:160. doi: 10.1186/1471-2229-10-160. [DOI] [PMC free article] [PubMed] [Google Scholar]
- Tomscha JL, Trull MC, Deikman J, Lynch JP, Guiltinan MJ. Phosphatase under-producer mutants have altered phosphorus relations. Plant Physiology. 2004;135:334–345. doi: 10.1104/pp.103.036459. [DOI] [PMC free article] [PubMed] [Google Scholar]
- Tran HT, Hurley BA, Plaxton WC. Feeding hungry plants: the role of purple acid phosphatases in phosphate nutrition. Plant Science. 2010a;179:14–27. [Google Scholar]
- Tran HT, Qian W, Hurley BA, She Y, Wang D, Plaxton WC. Biochemical and molecular characterization of AtPAP12 and AtPAP26: the predominant purple acid phosphatase isozymes secreted by phosphate-starved Arabidopsis thaliana. Plant, Cell & Environment. 2010b;33:1789–1803. doi: 10.1111/j.1365-3040.2010.02184.x. [DOI] [PubMed] [Google Scholar]
- Wang X, Wang Y, Tian J, Lim B, Yan X, Liao H. Overexpressing AtPAP15 enhances phosphorus efficiency in soybean. Plant Physiology. 2009;151:233–240. doi: 10.1104/pp.109.138891. [DOI] [PMC free article] [PubMed] [Google Scholar]
- Wang XR, Shen JB, Liao H. Acquisition or utilization, which is more critical for enhancing phosphorus efficiency in modern crops? Plant Science. 2010;179:302–306. [Google Scholar]
- Wang XR, Pan Q, Chen FX, Yan XL, Liao H. Effects of co-inoculation with arbuscular mycorrhizal fungi and rhizobia on soybean growth as related to root architecture and availability of N and P. Mycorrhiza. 2011;27:173–181. doi: 10.1007/s00572-010-0319-1. [DOI] [PubMed] [Google Scholar]
- Xiao K, Katagi H, Harrison M, Wang ZY. Improved phosphorus acquisition and biomass production in Arabidopsis by transgenic expression of a purple acid phosphatase gene from M. truncatula. Plant Science. 2006;170:191–202. [Google Scholar]
- Zhang Q, Wang C, Tian J, Li K, Shou H. Identification of rice purple acid phosphatases related to posphate starvation signaling. Plant Biology. 2011;13:7–15. doi: 10.1111/j.1438-8677.2010.00346.x. [DOI] [PubMed] [Google Scholar]
- Zhang W, Gruszewski HA, Chevone BI, Nessler CL. An Arabidopsis purple acid phosphatase with phytase activity increases foliar ascorbate. Plant Physiology. 2008;146:431–440. doi: 10.1104/pp.107.109934. [DOI] [PMC free article] [PubMed] [Google Scholar]
- Zhao J, Fu J, Liao H, et al. Characterization of root architecture in an applied core collection for phosphorus efficiency of soybean germplasm. Chinese Science Bulletin. 2004;49:1611–1620. [Google Scholar]
- Zhu H, Qian W, Lu X, et al. Expression patterns of purple acid phosphatase genes in Arabidopsis organs and functional analysis of AtPAP23 predominantly transcribed in flowers. Plant Molecular Biology. 2005;59:581–594. doi: 10.1007/s11103-005-0183-0. [DOI] [PubMed] [Google Scholar]
Associated Data
This section collects any data citations, data availability statements, or supplementary materials included in this article.