

Abstract
The similarity in the three-dimensional structures of homologous proteins imposes strong constraints on their sequence variability. It has long been suggested that the resulting correlations among amino acid compositions at different sequence positions can be exploited to infer spatial contacts within the tertiary protein structure. Crucial to this inference is the ability to disentangle direct and indirect correlations, as accomplished by the recently introduced direct-coupling analysis (DCA). Here we develop a computationally efficient implementation of DCA, which allows us to evaluate the accuracy of contact prediction by DCA for a large number of protein domains, based purely on sequence information. DCA is shown to yield a large number of correctly predicted contacts, recapitulating the global structure of the contact map for the majority of the protein domains examined. Furthermore, our analysis captures clear signals beyond intradomain residue contacts, arising, e.g., from alternative protein conformations, ligand-mediated residue couplings, and interdomain interactions in protein oligomers. Our findings suggest that contacts predicted by DCA can be used as a reliable guide to facilitate computational predictions of alternative protein conformations, protein complex formation, and even the de novo prediction of protein domain structures, contingent on the existence of a large number of homologous sequences which are being rapidly made available due to advances in genome sequencing.
Keywords: statistical sequence analysis, residue–residue covariation, contact map prediction, maximum-entropy modeling
Correlated substitution patterns between residues of a protein family have been exploited to reveal information on the structures of proteins (1–10). However, such studies require a large number (e.g., the order of 1,000) of homologous yet variable protein sequences. In the past, most studies of this type have therefore been limited to a few exemplary proteins for which a large number of such sequences happened to be already available. However, rapid advances in genome sequencing will soon be able to generate this many sequences for the majority of common bacterial proteins (11). Sequencing a large number of simple eukaryotes such as yeast can in principle generate a similar number of common eukaryotic protein sequences. In this paper, we provide a systematic evaluation of the information contained in correlated substitution patterns for predicting residue contacts, a first step toward a purely sequence-based approach to protein structure prediction.
The basic hypothesis connecting correlated substitution patterns and residue–residue contacts is very simple: If two residues of a protein or a pair of interacting proteins form a contact, a destabilizing amino acid substitution at one position is expected to be compensated by a substitution of the other position over the evolutionary timescale, in order for the residue pair to maintain attractive interaction. To test this hypothesis, the bacterial two-component signaling (TCS) proteins (12) have been used because of the large number of TCS protein sequences, which already numbered in the thousands 5-y ago (13). Simple covariance-based analysis was first applied to characterize interactions between residues belonging to partner proteins of the TCS pathways (14, 15); it was found to partially predict correct interprotein residue contacts, but also many residue pairs which are far apart. A major shortcoming of covariance analysis is that correlations between substitution patterns of interacting residues induce secondary correlations between noninteracting residues. This problem was subsequently overcome by the direct-coupling analysis (DCA) (16, 17), which aims at disentangling direct from indirect correlations. The top 10 residue pairs identified by DCA were all shown to be true contacts between the TCS proteins, and they were used to guide the accurate prediction (3-Å rmsd) of the interacting TCS protein complex (18, 19). Furthermore, DCA was used to shed light on interaction specificity and interpathway cross-talk in bacterial signal transduction (20).
Due to rapid advances in sequencing technology, there exists by now a large number of bacterial genome projects, approximately 1,700 completed and 8,300 ongoing (11). These genome sequences can be used to compute correlated substitution patterns for a large number of common bacterial proteins and interacting protein pairs, even if they are not duplicated (i.e., present at one copy per genome on average). DCA can then be used in principle to infer the interacting residues and eventually predict tertiary and quaternary protein structures for the majority of bacterial proteins, as has been done so far for the TCS proteins. Here we address a critical question for this line of pursuit—how well does DCA identify native residue contacts in proteins other than TCS?
Previously, a message-passing algorithm was used to implement DCA (16). This approach, here referred to as mpDCA, was rather costly computationally because it is based on a slowly converging iterative scheme. This cost makes it unfeasible to apply mpDCA to large-scale analysis across many protein families. Here we will introduce mfDCA, an algorithm based on the mean-field approximation of DCA. The mfDCA is 103 to 104 times faster than mpDCA, and hence can be used to analyze many long protein sequences rapidly. By analyzing 131 large domain families for which accurate structural information is available, we show that mfDCA captures a large number of intradomain contacts across these domain families. Together, the predicted contacts are able to recapitulate the global structure of the contact map. Many cases, where mfDCA finds strong correlation between distant residue pairs, have interesting biological reasons, including interdomain contacts, alternative structures of the same domain, and common interactions of residues with a ligand. The mfDCA results are found to outperform those generated by simple covariance analysis as well as a recent approximate Bayesian analysis (10).
Results and Discussion
A Fast DCA Algorithm.
In this study, we wish to characterize the correlation between the amino acid occupancy of residue positions as a predictor of spatial proximity of these residues in folded proteins. Starting with a multiple-sequence alignment (MSA) of a large number of sequences of a given protein domain, extracted using Pfam’s hidden Markov models (HMMs) (21, 22), the basic quantities in this context are the frequency count fi(A) for a single MSA column i, characterizing the relative frequency of finding amino acid A in this column, and the frequency count fij(A,B) for pairs of MSA columns i and j, characterizing the frequency that amino acids A and B coappear in the same protein sequence in MSA columns i and j. Alignment gaps are considered as the 21st amino acid. Mathematical definitions of these counts are provided in Methods.
The raw statistical correlation obtained above suffers from a sampling bias, resulting from phylogeny, multiple-strain sequencing, and a biased selection of sequenced species. The problem has been discussed extensively in the literature (10, 23–26). In this study, we implemented a simple sampling correction, by counting sequences with more than 80% identity and reweighting them in the frequency counts. All the frequency calculations and results reported below are obtained using this sampling correction; the number of nonredundant sequences is measured as the effective sequence number Meff after reweighting (see Methods). The comparison to results without reweighting and to reweighting at 70% in SI Appendix, Fig. S1 shows that reweighting systematically improves the performance of DCA, but results are robust with respect to precise value of reweighting.
A simple measure of correlation between these two columns is the mutual information (MI), defined by Eq. 3 in Methods. As we will show, the MI turns out to be an unreliable predictor of spatial proximity. Central to our approach is the disentanglement of direct and indirect correlations, which is attempted via DCA, which takes the full set of fi(A) and fij(A,B) as inputs, and infers “direct statistical couplings,” which generate the empirically measured correlations. Their strength is quantified by the direct information (DI) for each pair of MSA columns; see Eq. 12 in Methods and ref. 16. However, the message-passing algorithm used to implement DCA in ref. 16, mpDCA, was computationally intensive, thus limiting its use in large-scale studies. Here we developed a much faster heuristic algorithm based on a mean-field approach; see Methods. This algorithm, termed mfDCA, is able to perform DCA for alignments of up to about 500 amino acids per row, as compared to 60–70 amino acids in the message-passing approach. For the same protein length, mfDCA is about 103 to 104 times faster, which results mainly from the fact that the costly iterative parameter learning in mpDCA can be solved analytically in a single step in mfDCA. This performance gain enabled us to systematically analyze hundreds of protein domains and examine the extent to which a high DI value is a predictor of spatial proximity in a folded protein. Many residue-position pairs, which are close neighbors along the sequence, also show high MI and/or DI. To evaluate nontrivial predictions, we therefore restricted our analysis throughout the paper to pairs, which are separated by at least five positions along the protein’s backbone.
Intradomain Contacts.
We shall first illustrate the correlation between the DI values and the spatial proximity of residue pairs through a specific example, namely the domain family homologous to the DNA-recognition domain (region 2) of the bacterial Sigma-70 factor (Pfam ID PF04542). The mfDCA was used to compute the DI values using an Meff of approximately 3,700 nonredundant sequences—i.e., below a threshold of 80% sequence identity. The MSA columns with the 20 largest DI and MI values are mapped to the sequence of the SigmaE factor of Escherichia coli (encoded by rpoE) whose structure has been solved to 2-Å resolution [Protein Data Bank (PDB) ID 1OR7; ref. 27]. The residue pairs with the 20 highest ranked DI values are connected by bonds of different colors in Fig. 1A. Those residue pairs with minimum atomic distances < 8 Å are defined as “contacts” and are shown in red, the others in green.* Because only one out of the top 20 DI pairs is green, DI is seen as a good predicator of spatial contact, characterized by a true positive (TP) rate of 95% for this protein. A similar analysis using the 20 highest MI values (Fig. 1B) yielded 13 contacts (TP = 65%), illustrating a reduced predictive power by the simple covariance analysis. Furthermore, we see that the DI predictions are more evenly distributed over the entire domain, whereas many of the MI predictions are associated with a few residues; this difference is significant for contact map prediction and will be elaborated upon below.
Fig. 1.

Contact predictions for the family of domains homologous to Region 2 of the bacterial Sigma factor (Pfam ID PF04542) mapped to the sequence of the SigmaE factor of E. coli (encoded by rpoE) (PDB ID 1OR7). A shows the top 20 DI predictions, and B shows the top 20 MI predictions for residue–residue contacts, both with a minimum separation of five positions along the backbone. Each pair with distance < 8 Å is connected by a red link, and the more distant pairs are connected by the green links.
In order to test the generality of the predictive power of DI ranking as contacts, we applied the above analysis to 131 predominantly bacterial domain families (with > 90% of the sequences belonging to bacterial organisms). These families were selected according to the following two criteria (see Methods for details): (i) The family contains Meff > 1,000 nonredundant sequences after applying sampling correction for > 80% identity, in order to ensure statistical enrichment, and (ii) there exist at least two available high-quality X-ray crystal structures (independent PDB entries of resolution < 3 Å), so that the degree of spatial proximity between each residue pair can be evaluated. The selected domain families encompassed a total of 856 different PDB structures (see SI Appendix, Table S1). Note that Meff is found to be typically in the range of one-third to one-half of the total sequence number M (see SI Appendix, Fig. S2).
We computed the DI values for each residue pair of the 131 domain families and evaluated the degree to which high-ranking DI pairs corresponded to actual contacts (minimum atomic distances < 8 Å), based on the available structures for each domain. The results are shown in Fig. 2A (black star). The x axis represents the number of top-ranked DI pairs (separation > 5 positions along the sequence) considered and the y axis is the average fraction of pairs up to this DI ranking that are true contacts. The latter was calculated using the best-predicted structure† (i.e., the PDB structure with the highest TP value) for each of the 131 families. Similar results were obtained when considering all the available structures; see below. In contrast, results computed using MI ranking (red circle) gave significantly reduced TP rates.‡ Also shown in Fig. 2A are results generated by an approximate Bayesian approach, which has been established as the currently best-performing algorithm in identifying contacts from sequence correlation analysis (10). The Bayesian approach (yellow triangle) is seen to perform better than the simple covariance analysis (MI), but TP rates are not as high as the ones obtained by mfDCA. Analogous results for the relative performance of these methods are also observed for a collection of 25 eukaryotic proteins analyzed (see SI Appendix, Fig. S3), suggesting that the applicability of DCA is not restricted to bacterial proteins.
Fig. 2.

(A) Mean TP rate for 131 domain families, as a function of the number of top-ranked contacts and histogram of the distances of all predicted structures for each of the 131 domains studied. DI results (★) clearly outperform the other two methods: MI (red ●) and an approximate Bayesian approach (yellow ▾) developed by Burger and van Nimwegen (10). Their method aims at disentangling direct and indirect correlations by averaging over tree-shaped residue–residue coupling networks, and it contains a phylogeny correction. The method can also reach length-400 multiple alignments as mfDCA does; our implementation follows closely the description in ref. 6. However, coupling trees do not allow for multiple coupling paths between two residues as DCA does, possibly accounting for its lower TP rates compared to mfDCA. (B) The mfDCA predictions for the top 10, 20, and 30 residue pairs show a bimodal distribution of intradomain distances with two frequency peaks around 3–5 and 7–8 Å.
As seen in Fig. 2A, on average 84% of the top 20 DI pairs found by mfDCA (black star, black solid curve) are true contacts. The average TP rate is indicative of the TP of typical domain families, as the individual TPs for the 131 families examined are distributed mostly in the range of 0.7–1.0; see SI Appendix, Fig. S4A evaluated using the best-predicted structure and SI Appendix, Fig. S4B when all 856 structures are used. This figure also shows little difference in the quality of the prediction using the top 10, 20, or 30 DI pairs, and coherent results between the best-predicted and all 856 structures, despite the somewhat uneven distribution of available PDB structures over the 131 domain families. The distribution of the actual (minimum atomic) intradomain distances between residue pairs with the top 10, 20, and 30 DI ranking are shown in Fig. 2B, using the complete set of 856 PDB structures. The distribution exhibits a strong peak around 3–5 Å with a weaker secondary peak around 7–8 Å, for all three sets of DI rankings used. This double-peak structure is a characteristic feature of the DCA results. It is not observed in the background distribution of all residue pairs (see SI Appendix, Fig. S5, which has a single maximum around 20–25 Å). In Fig. 2B, this background is reflected by a small bump in the histograms for the top 20 and 30 DI ranking pairs. The two short-distance peaks are consistent with the biophysics of molecular contacts: The first peak presumably arises from short-ranged interactions like hydrogen bonding or pairings involved in secondary structure formation, whereas the second peak likely corresponds to long-ranged, possibly water-mediated contacts (28–30). The observation of this second, biologically reasonable peak in Fig. 2B also motivates the choice of 8 Å as a cutoff distance for what is considered a residue–residue contact in Figs. 1 and 2A.
To understand how many sequences are actually needed for mfDCA, we randomly generated subalignments for two protein families; see SI Appendix, Fig. S6. For at least these two families, an effective number of Meff of approximately 250 is already sufficient to reach TP rates close to one for the top predicted residue pairs, and the predictive power increases monotonously when more sequences are available. These numbers are consistent with but slightly larger than the sequence requirements reported in ref. 31 for the statistical-coupling analysis originally proposed in ref. 5.
Long-Distance High-DI Residue Pairs.
The results from the previous section illustrate the ability of mfDCA to identify intradomain contacts with high sensitivity. However, a small fraction of pairs showed high DI values (in the top 20–30 ranking) but were located far away according to the available crystal structure. Here we investigate various biological reasons for the appearance of such long-distance direct correlations.
Interdomain Residue Contacts.
Given the biological role of some interdomain contacts (32), we studied if the appearance of long-distance high-DI pairs may be due to interactions between proteins which form oligomeric complexes, as described previously for the dimeric response regulators of the bacterial two-component signaling system (16). To further investigate this possibility, we examined members of the 131 proteins which formed homodimers or higher-order oligomers according to the corresponding X-ray crystal structures.
A first example is the ATPase domain of the family of the nitrogen regulatory protein C (NtrC)-like sigma54-dependent transcriptional activators (Pfam PF00158). Upon activation, different subunits of this domain are known to pack in the front-to-back orientation to form a heptameric ring, wrapping DNA around the complex (33). We compared the DCA results to the structure of NtrC1 of Aquifex aeolicus (PDB ID 1NY6; ref. 33). Among the top 20 DI pairs, 17 were intradomain contacts. The three remaining pairs were long-distance (> 10 Å) within the domain. Strikingly, all three were within 5 Å when paired with the closest position in an adjacent subunit of the heptamer complex; see Fig. 3. These pairs appear to have coevolved to maintain the proper formation of the heptamer complex. A second example of high-DI interdomain contact is shown in SI Appendix, Fig. S7 for the multidrug resistance protein MexA of Pseudomonas aeruginosa, where nine subunits oligomerize to form a funnel-like structure across the periplasmic space for antibiotic efflux (PDB ID 1VF7; ref. 34).
Fig. 3.

The only three long-distance high-DI predictions found out of the top 20 DI pairs in the Sigma54 interaction domain of protein NtrC1 of A. aeolicus (PDB ID 1NY6) out of the top 20 predicted couplets are multimerization contacts. Structures showing each of these three interdomain contacts which are separated by less than 5 Å in a ring-like heptamer formed by Sigma54 interaction domains. (A) Residue pair GLU(174)-ARG(253), (B) residue pair PHE(226)-TYR(261), and (C) residue pair ALA(197)-ALA(249). (D) Oligomerization contacts are found in 21 structures of the 131 families studied (see SI Appendix, Table S3). These contacts represent a significant percentage of long-distance high-DI contacts observed in our predictions.
We further tested the occurrence of interdomain contacts at a global level. Out of the 131 studied domain families, 21 families feature X-ray crystal structures involving oligomers with predicted interdomain contacts (see SI Appendix, Table S3). Among the top 20 DI pairs that are not intradomain contacts, about half of them turned out to be interdomain contacts as shown in Fig. 3D.
Alternative Domain Conformations.
Another cause of long-distance high-DI pairs is the occurrence of alternative conformations for domains within the same family. As an illustration, we examine the domain family GerE (Pfam PF00196), whose members include the DNA-binding domains of many response regulators in two-component signaling systems.
Using the DNA-bound DNA-binding domain of the nitrate/nitrite response regulator NarL of E. coli (PDB ID 1JE8; ref. 35) as a structural template, we found that all of the top 20 DI pairs are true contacts (red bonds in Fig. 4A). However, when mapping the same DI pairs to the structure of the full-length transcriptional regulatory protein DosR of Mycobacterium tuberculosis (PDB ID 3C3W; ref. 36), seven pairs are found at distances > 8 Å (green bonds in Fig. 4B, with the response-regulator domain shown in gray). Comparison of Fig. 4 A and B clearly shows that all of the green bonds involve pairing with the C-terminal helix (shown in light blue), which is significantly displaced in the full-length structure, presumably due to interaction with the (unphosphorylated) regulatory domain. As proposed by Wisedchaisri et al. (36), a likely scenario is that the DNA-binding domain of DosR is broken up by the interdomain interaction in the absence of phosphorylation, whereas phosphorylation of DosR restores its DNA-binding domain into the active form represented by the DNA-bound NarL structure.
Fig. 4.

The figures show the top 20 contacts predicted by DI for the family of response-regulator DNA-binding domain (GerE, PF00196) (containing both the dark- and light-blue colored regions). In A, the contacts are mapped to the DNA-binding domain of E. coli NarL, bound to the DNA target (PDB ID 1JE8). The TP rate for the top 20 DI pairs is 100%, and they are all shown as red links. In B, the contacts are mapped to the full-length response-regulator DosR of M. tuberculosis (PDB ID 3C3W), with the (unphosphorylated) response-regulator domain shown in gray. The top 20 DI pairings is only 65% in this case (13 red and 7 green links). The difference in prediction quality for the two structures can be traced back to a major reorientation of the C-terminal helix of the GerE domain (light blue) in B.
It is difficult to estimate the extent to which alternative conformations may be responsible for the observed long-distance high-DI contacts, for less characterized domains for which alternative conformations may not be known. However, the example shown in Fig. 4 may motivate future studies to use these long-distance high-DI contacts to explore possible alternative conformations.
Ligand-Mediated Interactions.
Another special case of interdomain residue interactions and another cause of long-distance high-DI pairing is shown in Fig. 5. Here, mfDCA found the metalloenzyme domain family (PF00903) to have a high-DI intradomain residue pair which is separated by more than 14 Å when mapped to the glutathione transferase FosA of P. aeruginosa (PDB ID 1NKI; ref. 37). FosA is a metalloglutathione transferase which confers resistance to fosfomycin by catalyzing the addition of glutathione to fosfomycin. It is a homodimeric enzyme whose activity is dependent on Mn(II) and K+, and the Mn(II) center has been proposed as part of the catalytic mechanism (37). We observed that the two residues belonging to the different subunits of the high-DI pair, Glu110 (pink) and His7 (yellow), are in direct contact (3 Å residue pair and 1.5 Å residue-ligand separation) with the Mn(II) ion (red) in the dimer configuration (Fig. 5). Thus, the “direct interaction” between these residues found by mfDCA is presumably mediated through their common interaction with a third agent, the metal ion in this case. There may well be other cases with interactions mediated by binding to other metabolites, RNA, DNA, or proteins not captured in the available crystal structures.
Fig. 5.

The metalloenzyme domain (PF00903) of protein FosA (PDB ID 1NKI) is an example of a case where long-distance high-DI pairs are in fact residue pairs coordinating a ligand. The high-DI pair involving the residues Glu110 (pink) and His7 (yellow) coordinate a metal ion Mn(II) (red) in its dimer configuration. K+ ions are shown as larger spheres (gray and blue), each coordinated by a monomer of the corresponding color.
Contact Map Reconstruction.
So far, we have focused on the top 20 DI pairs, which are largely intra- or interdomain contacts. However, one of the most striking features of the DI result in Fig. 2A is how gradually the average TP rate declines with increasing DI ranking. It is therefore possible to turn the question around: How many residue pairs are predicted, when we require a given minimum TP rate? For instance, one can go up to a DI ranking of 70 before the average TP rate declines to 70%, meaning that, if one were to predict contacts using the top 70 DI pairs, one would have obtained approximately 50 true contacts on average. This feature may be exploited for sequence-based structure prediction and deserves further analysis.
To become more quantitative, we define the number of acceptable pairs NAPx as the (largest) number of DI-ranked pairs where the specified TP rate (x%) is reached for a given protein. NAPx can be viewed as an index that characterizes the number of contact predictions at a certain acceptable quality level (given by x). We computed this index for every domain in all 856 structures in our database, for TP levels of 0.9, 0.8, and 0.7. The results are shown as cumulative distributions in Fig. 6. A casual inspection of these distributions shows that there are many structures with high NAP. Suppose the acceptable TP level is 0.7. The median of NAP70 is 52, meaning that, in half of the structures examined, the number of high-ranking, predictive DI pairs is at least 52. Furthermore, 70% of the structures have NAP70 > 30 and 34% of the structures have NAP70 > 100. A normalized version of Fig. 6 with respect to the length of the domain L is shown in SI Appendix, Fig. S8. In one extreme case involving the family of bacterial tripartite tricarboxylate receptors (PF03401), NAP70 was 600—i.e., 70% of the top 600 DI pairs correspond to true contacts when mapped to the best-predicted structure (PDB ID 2QPQ; ref. 38); see SI Appendix, Fig. S9A. This domain has a length of L = 274 and has approximately 2,300 contacts. In another example, the extracellular solute-binding family (PF00496) mapped to the structure of the periplasmic oligopeptide-binding protein OppA of Salmonella typhimurium (PDB ID 1JET; ref. 39) has a NAP70 of 497 (SI Appendix, Fig. S9B, L = 372, and approximately 2,530 contacts).
Fig. 6.

Cumulative distribution of the number of acceptable pairs (NAPx) for a given TP rate x. The curves show the probability of NAPx to be larger than a given number n for contacts at given TP rates of 0.9, 0.8, and 0.7. The curves are computed for all 856 PDB structures in the dataset. We observe that the probability of NAP70 > 30 is 70% and NAP70 > 100 is 34%, which implies that a substantial number of protein domains can have accurate predictions that go beyond the top 30 DI pairings. We also identify some exceptional cases with NAP70 > 600.
We also computed the NAP70 distribution using MI; see SI Appendix, Fig. S10. The difference between DI and MI, about 10–20% in TP rate according to Fig. 2A, is seen much more significantly when displayed according to the NAP index, with the median NAP70 being 5 for MI and 52 for DI, which shows that DCA generates many more high-valued contact pair predictions. We also compared the performance of DCA with the approximate Bayesian method (red dashed curve in SI Appendix, Fig. S10), which gives a median NAP70 of 25 that is halfway between that of MI and mfDCA.
The large number of contacts correctly predicted by DCA prompted us to explore the extent to which DCA may be used to predict the contact maps of protein domains. For a domain with L amino acids, we calculated the inferred maps by sorting residue pairs according to their DI, and keeping the 2L highest-ranking pairs with minimum separation of five positions along the sequence. For the contact map prediction, we included further those pairings which have equal or larger DI than the ones mentioned above, but with shorter separation along the sequence because they may be informative about secondary structures. Fig. 7 shows two examples of such contact map predictions, for the prokaryotic promoter recognition domain of SigmaE already shown in Fig. 1 (PDB ID 1OR7, L = 71) and for the eukaryotic H-Ras protein (PDB ID 5P21; ref. 40, L = 160). The figure shows the native contact maps, together with the predictions by MI (Fig. 7, Left) and DI (Fig. 7, Center). Correctly predicted native contacts (i.e., the TPs) are indicated in red. The unpredicted native contacts taken from the X-ray crystal structures are shown in gray, and the incorrect predictions are shown in green. It is evident that, for both proteins, DI works substantially better than MI, both in terms of the TP rate and the representation of the native contact map. To become more quantitative, we have binned the predicted pairs according to their separation along the primary amino acid sequence (Fig. 7, Right). We observe that DI captures in particular a higher number and more accurately those contacts between residues, which are very distant along the sequence. Also, the DI predictions are more evenly distributed, whereas MI predictions tend to cluster together.
Fig. 7.

Two examples of contact map predictions using MI (A and D) and mfDCA (B and E). Gray symbols represent the native map with a cutoff of 8 Å, colored symbols the computational contact predictions using MI or DI ranking (red squares for TP and green squares for spatially distant pairs). The number of pairs is determined such that there are 2L pairs with minimum separation five along the sequence, where L is the domain length. The right-most panels (C and F) bin the predictions of MI (blue) and mfDCA (red) according to their separation along the protein sequence. The overall bars count all predictions, the shaded part the TPs. Note in particular that mfDCA leads to a higher number of more accurate predictions for large separations. (A–C) The promoter recognition helix domain of the SigmaE factor (PDB ID 1OR7). (D–F) The eukaryotic signaling protein Ras (PDB ID 1P21). For better comparability of native vs. predicted contacts, the predictions are displayed only above the diagonal.
Discussion.
We have shown the ability of DCA to identify with high-accuracy residue pairs in domain families that might have coevolved together and hence are representative of physical proximity in the three-dimensional fold of the domain. We have done an extensive evaluation of these capabilities for a large number of families and individual PDB structures. We found that DCA is not only able to identify intradomain contacts but also interdomain residue pairs that are part of oligomerization interfaces. Although we focused on bacterial proteins, this methodology can be applied to the ever-increasing number of eukaryotic sequences. Our initial results suggest that mfDCA performance is conserved for nonbacterial proteins. One potential application is the identification of interaction interfaces for homodimers that could ultimately help in complex structure prediction, e.g., the cases in Fig. 3 and SI Appendix, Fig. S7. Our results might open unexplored avenues of research for which full contact maps could be estimated and used as input data for de novo protein structure identification, which is particularly interesting in the case of interdomain contacts in multidomain proteins. Ultimately, this methodology can be utilized with pairs of proteins rather than single proteins to identify potential protein–protein interactions. An example of this approach was introduced in ref. 16, however, the current mathematical formulation of the method as well as its computational implementation allows an analysis to a much larger scale.
Despite the accuracy of the extracted signal, mfDCA cannot be expected to extract all biological information contained in the pair correlations. This idea can be illustrated by comparing the mfDCA results to those of statistical-coupling analysis (SCA), developed by Lockless and Ranganathan (5) and used to identify “coevolving protein sectors” (41). We have applied mfDCA to the data of ref. 41 for the Trypsin protein family (Serine protease), where SCA identified three sectors related to different functionalities of the protein, which cover almost 30% of all residues. The mfDCA leads to an 83.3% TP rate for the top 30 contact predictions (PDB ID 3TGI; ref. 42)—i.e., to a performance which is comparable to the other protein families analyzed here. Out of the resulting 25 true contact pairs, only eight are found within the identified sectors. Among them, three are disulfide bonds (C42∶C58, C136∶C201, C191∶C220) and another two are inside a catalytic triad crucial for the catalytic activity of the protein family (H57∶S195, D102∶S195). The other 17 true contacts predicted by mfDCA are distributed over the protein fold, without obvious relation to the sectors (see SI Appendix, Table S4). The difference in prediction can be traced back to differences in the algorithmic approaches: SCA uses clustering to identify larger groups of coevolving sites (sectors), whereas DCA uses maximum-entropy modeling to extract pairs of directly coupled residues. Thus, the two algorithms extract different and, in both cases, biologically important information. It remains a future challenge to develop techniques unifying SCA and DCA, and to extract even more coevolutionary information from multiple-sequence alignments.
Methods
Data Extraction.
Sequence datasets were extracted primarily from Pfam families with more than 1,000 nonredundant sequences. We decided to focus on families that are predominantly bacterial (i.e., more than 90% of the family sequences belong to bacterial organisms). Another requirement in this dataset is that such families must have at least two known X-ray crystal structures with a resolution of  or better. The PDB (43) was accessed to obtain crystal structures of proteins. An additional criterion to improve statistical significance when picking sequences that belong to a particular Pfam (22) family, was to use a stricter E-value threshold than the standard used by the software package HMMER (21) to classify domain membership. An in-house mapping application was developed to map domain family alignments and predicted couplets to specific residues in PDB structures. Some of the data extraction tools used in this study are described in more detail in ref. 17. A total of 131 families were selected that complied with all these criteria. A list of these Pfam families and the 856 PDB structures analyzed can be accessed in the SI Appendix, Tables S1 and S2).
For each family, the protein sequences are collected in one MSA denoted by  , where L denotes the number of MSA columns (i.e., the length of the protein domains). Alignments are local alignments to the Pfam HMM; because of the large number of proteins in each MSA, we refrained from refinements using global alignment techniques.
Sequence Statistics and Reweighting.
As already mentioned in Results and Discussion, the main inputs of DCA are reweighted frequency counts for single MSA columns and column pairs:
 |
[1] |
In this equation, δA,B denotes the Kronecker symbol, which equals one if A = B, and zero otherwise. Furthermore, we have defined q = 21 for the number of different amino acids (also counting the gap), and a pseudocount λ (44), whose value will be discussed below. The weighting of the influence of a single sequence by the factor 1/ma aims at correcting for the sampling bias. It is determined by the number
| [2] |
of sequences  , b∈{1, ...,M}, which have more than 80% sequence identity (seqid) with
  , where a itself is counted. The same reweighting, but with a 100% sequence-identity threshold, would remove multiple counts of repeated sequences. Reweighting systematically improves the results (see SI Appendix, Fig. S1), with only a weak dependence on the precise threshold value (in the range of 70–90%) and the specific protein family. Last, we introduced the effective sequence number
  as the sum over all sequence weights. These counts allow for calculating the mutual information,
 |
[3] |
which equals zero if and only if i and j are uncorrelated, and is positive otherwise.
Maximum-Entropy Modeling.
To disentangle direct and indirect couplings, we aim at inferring a statistical model P(A1, ...,AL) for entire protein sequences (A1, ...,AL). To achieve coherence with data, we require this model to generate the empirical frequency counts as marginals,
 |
[4] |
Besides this constraint, we aim at the most general, least-constrained model P(A1, ...,AL). This model can be achieved by applying the maximum-entropy principle (45, 46), and it leads to an explicit mathematical form of P(A1, ...,AL) as a Boltzmann distribution with pairwise couplings eij(A,B) and local biases (fields) hi(A):
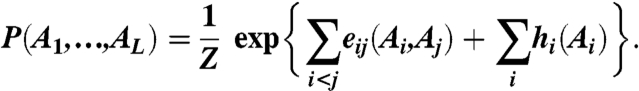 |
[5] |
The model parameters have to be fitted such that [4] is satisfied. In this fitting procedure, one has to consider that Eq. 5 contains more free parameters than there are independent conditions in [4], which allows one to change couplings and fields together without changing the sum in the exponent. Therefore, multiple but equivalent solutions for the fitting are possible. To remove this freedom, we consider all couplings and fields measured relative to the last amino acid A = q, and set
| [6] |
Details on the maximum-entropy approach are given in the SI Appendix.
Small-Coupling Expansion.
Eq. 5 contains the normalization factor Z, in statistical physics also called the partition function, which is defined as
 |
[7] |
and includes a sum of qL terms. Its direct calculation is infeasible for any realistic protein length and approximations have to be used. In a prior paper (16), several of us introduced a message-passing approach, which allows the treatment of about 70 MSA columns simultaneously in about 2-d running time on a standard desktop computer (larger MSAs need preprocessing to decrease the number of columns before running message passing). Here we introduce a much more efficient scheme, which for L = 70 is about 3–4 orders of magnitude faster, and which allows one to directly analyze alignments with L ≤ 1,000 (L ≤ 500 on a standard computer because of limited working memory). The total algorithmic complexity is O(q3N3). The major speedup compared to the iterative message-passing solver results from the fact that parameter inference can be done in a single computational step in the new algorithm.
The approach is based on a small-coupling expansion (47, 48), which is explained in detail in the SI Appendix: The exponential of Σi<jeij(Ai,Aj) in Eq. 7 is expanded into a Taylor series. Keeping only the linear order of this expansion, we obtain the well-known mean-field equations
 |
[8] |
containing the single-column counts, as well as a simple relation between the coupling eij(A,B) and the pair counts fij(A,B) for all i,j = 1, ...,L and A,B = 1, ...,q - 1
| [9] |
where
| [10] |
Eqs. 6 and 9 completely determine the couplings in terms of the data. Note that the connected-correlation matrix C defined in Eq. 10 is a (q - 1)L × (q - 1)L matrix; the pairs (i,A) and (j,B) have to be understood as joint single indices in the inversion in Eq. 9.
In general, when constructed without pseudocounts (λ = 0), this matrix is not invertible, and formally Eq. 9 leads to infinite couplings. Even introducing site-specific reduced amino acid alphabets (only those actually observed in the corresponding MSA column) is found to be not sufficient for invertibility. The matrix can, however, be regularized by setting λ > 0. For small λ, elements diverging in the λ → 0 limit dominate the DI calculation discussed in the next paragraph. To avoid such spurious high DI values, we have to go to relatively large pseudocounts; λ = Meff is found to be a reasonable value throughout families and is used exclusively in this paper. SI Appendix, Fig. S11 shows a sensitivity analysis for different values of the pseudocount for two domain families. The mean TP rates are computed for pseudocount values λ = w·Meff, with the weights w ranging from 0.11 to 9. The optimum value of λ is found for 1 ≤ w ≤ 1.5. Therefore, we used λ = Meff throughout this study.
Because of the long run time of the message-passing approach (mpDCA), we could not compare its performance for all proteins studied in this paper. SI Appendix, Fig. S12 contains two examples: Trypsin (PF00089) and Trypsin inhibitor (PF00014). In both cases, mfDCA outperforms mpDCA. Furthermore, it is straightforward to include into DCA also the next order of the small-coupling expansion beyond the mean-field approximation (which corresponds to the so-called Thouless, Anderson, and Palmer (TAP) equations in spin-glass physics; ref. 49). We do not find any systematic improvement of the resulting algorithm, called tapDCA, when compared to mfDCA; see SI Appendix, Fig. S12.
Direct Information.
After having estimated the direct coupling eij(A,B) through Eq. 8, we need a strategy for ranking the L(L - 1) possible interactions according to their direct-coupling strength. Following the idea that MI is a good measure for correlations, in ref. 16 we introduced a quantity called direct information. It can be understood as the amount of MI between columns i and j, which results from direct coupling alone.
To this end, we introduce for each column pair (i,j) an isolated two-site model
 |
[11] |
where the couplings eij(A,B) are computed using Eq. 8, and the auxiliary fields  are given implicitly by compatibility with the empirical single-residue counts:
 |
[12] |
As before, in order to reduce the number of free parameters to the number of independent constraints, these fields are required to fulfill  . Note that the auxiliary fields have to be determined for each pair (i,j) independently to fit Eq. 12. Finally, we define the DI as the MI of model
 |
[13] |
Algorithmic Implementation.
The algorithmic implementation of the mean-field approximation is sketched in the following steps:
Estimate the frequency counts fi(A) and fij(A,B) from the MSA, using the pseudocount λ = Meff in Eqs. 1 and 2.
Determine the empirical estimate of the connected-correlation matrix Eq. 10.
Determine the couplings eij(A,B) according to the second of Eq. 9.
For each column pair i < j, estimate the direct information DIij by solving Eqs. 11 and 12 for
 , and plug the result into Eq. 13.
An implementation of the code in Matlab is available upon request.
Note Added in Proof.
Our direct-coupling analysis was recently used to infer all-atom protein 3D structures, indicating that the high quality of contact prediction reported here is capable of translating to good quality predicted 3D folds (50).
Supplementary Material
Acknowledgments.
We thank Hendrik Szurmant, Joanna Sulkowska, and Lucy Colwell for useful discussions during the course of this work. This work was supported by a European Commission Grant 267915 (to R.Z.), the Center for Theoretical Biological Physics sponsored by the National Science Foundation (NSF Grant PHY-0822283), and by NSF Grant MCB-1051438 (to J.N.O.).
Footnotes
The authors declare no conflict of interest.
See Author Summary on page 19459.
This article contains supporting information online at www.pnas.org/lookup/suppl/doi:10.1073/pnas.1111471108/-/DCSupplemental.
*The choice of the relatively large value of 8-Å minimum atom distance as a cutoff value for contacts is supported later in the discussion of Fig. 2B, where the distance distribution of the top DI pairings is analyzed.
†The best-predicted structures were used due to the variance in the quality of PDB structures. Also, for the number of cases where substantially different structures of the same protein exist in the PDB, the existence of a single structure containing the predicted contacts substantiates them as contacts of a native conformation of that protein.
‡Both DI and MI benefited modestly from sampling correction; see SI Appendix, Fig. S1 for a comparison of the performance of these methods with/without sampling correction.
References
- 1.Altschuh D, Lesk A, Bloomer A, Klug A. Correlation of co-ordinated amino acid substitutions with function in viruses related to tobacco mosaic virus. J Mol Biol. 1987;193:693–707. doi: 10.1016/0022-2836(87)90352-4. [DOI] [PubMed] [Google Scholar]
- 2.Göbel U, Sander C, Schneider R, Valencia A. Correlated mutations and residue contacts in proteins. Proteins Struct Funct Genet. 1994;18:309–317. doi: 10.1002/prot.340180402. [DOI] [PubMed] [Google Scholar]
- 3.Neher E. How frequent are correlated changes in families of protein sequences? Proc Natl Acad Sci USA. 1994;91:98–102. doi: 10.1073/pnas.91.1.98. [DOI] [PMC free article] [PubMed] [Google Scholar]
- 4.Shindyalov IN, Kolchanov NA, Sander C. Can three-dimensional contacts in protein structures be predicted by analysis of correlated mutations? Protein Eng. 1994;7:349–358. doi: 10.1093/protein/7.3.349. [DOI] [PubMed] [Google Scholar]
- 5.Lockless SW, Ranganathan R. Evolutionarily conserved pathways of energetic connectivity in protein families. Science. 1999;286:295–299. doi: 10.1126/science.286.5438.295. [DOI] [PubMed] [Google Scholar]
- 6.Atchley WR, Wollenberg KR, Fitch WM, Terhalle W, Dress AW. Correlations among amino acid sites in bHLH protein domains: An information theoretic analysis. Mol Biol Evol. 2000;17:164–178. doi: 10.1093/oxfordjournals.molbev.a026229. [DOI] [PubMed] [Google Scholar]
- 7.Fodor AA, Aldrich RW. Influence of conservation on calculations of amino acid covariance in multiple sequence alignments. Proteins Struct Func Bioinf. 2004;56:211–221. doi: 10.1002/prot.20098. [DOI] [PubMed] [Google Scholar]
- 8.Liu Z, Chen J, Thirumalai D. On the accuracy of inferring energetic coupling between distant sites in protein families from evolutionary imprints: Illustrations using lattice model. Proteins Struct Func Bioinf. 2009;77:823–831. doi: 10.1002/prot.22498. [DOI] [PubMed] [Google Scholar]
- 9.Lashuel HA, Pappu R. Amyloids go genomic: Insights regarding the sequence determinants of prion formation from genome‐wide studies. Chembiochem. 2009;10:1951–1954. doi: 10.1002/cbic.200900373. [DOI] [PMC free article] [PubMed] [Google Scholar]
- 10.Burger L, van Nimwegen E. Disentangling direct from indirect co-evolution of residues in protein alignments. PLoS Comput Biol. 2010;6:e1000633. doi: 10.1371/journal.pcbi.1000633. [DOI] [PMC free article] [PubMed] [Google Scholar]
- 11.Liolios K, et al. The Genomes On Line Database (GOLD) in 2009: Status of genomic and metagenomic projects and their associated metadata. Nucleic Acids Res. 2009;38:D346–D354. doi: 10.1093/nar/gkp848. [DOI] [PMC free article] [PubMed] [Google Scholar]
- 12.Hoch JA. Two-component and phosphorelay signal-transduction. Curr Opin Microbiol. 2000;3:165–170. doi: 10.1016/s1369-5274(00)00070-9. [DOI] [PubMed] [Google Scholar]
- 13.Ulrich LE, Zhulin IB. The MiST2 database: A comprehensive genomics resource on microbial signal transduction. Nucleic Acids Res. 2009;38:D401–D407. doi: 10.1093/nar/gkp940. [DOI] [PMC free article] [PubMed] [Google Scholar]
- 14.White RA, Szurmant H, Hoch JA, Hwa T. Features of protein-protein interactions in two‐component signaling deduced from genomic libraries. Methods Enzymol. 2007;422:75–101. doi: 10.1016/S0076-6879(06)22004-4. [DOI] [PubMed] [Google Scholar]
- 15.Skerker JM, et al. Rewiring the specificity of two-component signal transduction systems. Cell. 2008;133:1043–1054. doi: 10.1016/j.cell.2008.04.040. [DOI] [PMC free article] [PubMed] [Google Scholar]
- 16.Weigt M, White RA, Szurmant H, Hoch JA, Hwa T. Identification of direct residue contacts in protein–protein interaction by message passing. Proc Natl Acad Sci USA. 2009;106:67–72. doi: 10.1073/pnas.0805923106. [DOI] [PMC free article] [PubMed] [Google Scholar]
- 17.Lunt B, et al. Inference of direct residue contacts in two-component signaling. Methods Enzymol. 2010;471:17–41. doi: 10.1016/S0076-6879(10)71002-8. [DOI] [PubMed] [Google Scholar]
- 18.Schug A, Weigt M, Onuchic JN, Hwa T, Szurmant H. High-resolution protein complexes from integrating genomic information with molecular simulation. Proc Natl Acad Sci USA. 2009;106:22124–22129. doi: 10.1073/pnas.0912100106. [DOI] [PMC free article] [PubMed] [Google Scholar]
- 19.Schug A, Weigt M, Hoch J, Onuchic J. Computational modeling of phosphotransfer complexes in two-component signaling. Methods Enzymol. 2010;471:43–58. doi: 10.1016/S0076-6879(10)71003-X. [DOI] [PubMed] [Google Scholar]
- 20.Procaccini A, Lunt B, Szurmant H, Hwa T, Weigt M. Dissecting the specificity of protein-protein interaction in bacterial two-component signaling: Orphans and crosstalks. PLoS One. 2011;6:e19729. doi: 10.1371/journal.pone.0019729. [DOI] [PMC free article] [PubMed] [Google Scholar]
- 21.Eddy SR. Profile hidden Markov models. Bioinformatics. 1998;14:755–763. doi: 10.1093/bioinformatics/14.9.755. [DOI] [PubMed] [Google Scholar]
- 22.Finn RD, et al. The Pfam protein families database. Nucleic Acids Res. 2010;38:D211–D222. doi: 10.1093/nar/gkp985. [DOI] [PMC free article] [PubMed] [Google Scholar]
- 23.Wollenberg KR, Atchley WR. Separation of phylogenetic and functional associations in biological sequences by using the parametric bootstrap. Proc Natl Acad Sci USA. 2000;97:3288–3291. doi: 10.1073/pnas.070154797. [DOI] [PMC free article] [PubMed] [Google Scholar]
- 24.Tillier ERM, Lui TWH. Using multiple interdependency to separate functional from phylogenetic correlations in protein alignments. Bioinformatics. 2003;19:750–755. doi: 10.1093/bioinformatics/btg072. [DOI] [PubMed] [Google Scholar]
- 25.Gouveia-Oliveira R, Pedersen AG. Finding coevolving amino acid residues using row and column weighting of mutual information and multi-dimensional amino acid representation. Algorithms Mol Biol. 2007;2:12–24. doi: 10.1186/1748-7188-2-12. [DOI] [PMC free article] [PubMed] [Google Scholar]
- 26.Dunn SD, Wahl LM, Gloor GB. Mutual information without the influence of phylogeny or entropy dramatically improves residue contact prediction. Bioinformatics. 2007;24:333–340. doi: 10.1093/bioinformatics/btm604. [DOI] [PubMed] [Google Scholar]
- 27.Campbell E, et al. Crystal structure of Escherichia coli sigmaE with the cytoplasmic domain of its anti-sigma RseA. Mol Cell. 2003;11:1067–1078. doi: 10.1016/s1097-2765(03)00148-5. [DOI] [PubMed] [Google Scholar]
- 28.Tanaka S, Scheraga HA. Medium- and long-range interaction parameters between amino acids for predicting three-dimensional structures of proteins. Macromolecules. 1976;9:945–950. doi: 10.1021/ma60054a013. [DOI] [PubMed] [Google Scholar]
- 29.Go N, Taketomi H. Respective roles of short- and long-range interactions in protein folding. Proc Natl Acad Sci USA. 1978;75:559–563. doi: 10.1073/pnas.75.2.559. [DOI] [PMC free article] [PubMed] [Google Scholar]
- 30.Miyazawa S, Jernigan RL. Long- and short-range interactions in native protein structures are consistent/minimally frustrated in sequence space. Proteins Struct Funct Genet. 2003;50:35–43. doi: 10.1002/prot.10242. [DOI] [PubMed] [Google Scholar]
- 31.Dima RI, Thirumalai D. Determination of network of residues that regulate allostery in protein families using sequence analysis. Protein Sci. 2006;15:258–268. doi: 10.1110/ps.051767306. [DOI] [PMC free article] [PubMed] [Google Scholar]
- 32.Myers RS, Amaro RE, Luthey-Schulten ZA, Davisson VJ. Reaction coupling through interdomain contacts in imidazole glycerol phosphate synthase. Biochemistry. 2005;44:11974–11985. doi: 10.1021/bi050706b. [DOI] [PubMed] [Google Scholar]
- 33.Lee S-Y. Regulation of the transcriptional activator NtrC1: Structural studies of the regulatory and AAA+ ATPase domains. Genes Dev. 2003;17:2552–2563. doi: 10.1101/gad.1125603. [DOI] [PMC free article] [PubMed] [Google Scholar]
- 34.Akama H, et al. Crystal structure of the membrane fusion protein, MexA, of the multidrug transporter in Pseudomonas aeruginosa. J Biol Chem. 2004;279:25939–25942. doi: 10.1074/jbc.C400164200. [DOI] [PubMed] [Google Scholar]
- 35.Maris AE, et al. Dimerization allows DNA target site recognition by the NarL response regulator. Nat Struct Biol. 2002;9:771–778. doi: 10.1038/nsb845. [DOI] [PubMed] [Google Scholar]
- 36.Wisedchaisri G, Wu M, Sherman DR, Hol WGJ. Crystal structures of the response regulator DosR from Mycobacterium tuberculosis suggest a helix rearrangement mechanism for phosphorylation activation. J Mol Biol. 2008;378:227–242. doi: 10.1016/j.jmb.2008.02.029. [DOI] [PMC free article] [PubMed] [Google Scholar]
- 37.Rigsby RE, Rife CL, Fillgrove KL, Newcomer ME, Armstrong RN. Phosphonoformate: A minimal transition state analogue inhibitor of the fosfomycin resistance protein, FosA. Biochemistry. 2004;43:13666–13673. doi: 10.1021/bi048767h. [DOI] [PubMed] [Google Scholar]
- 38.Herrou J, et al. Structure-based mechanism of ligand binding for periplasmic solute-binding protein of the Bug family. J Mol Biol. 2007;373:954–964. doi: 10.1016/j.jmb.2007.08.006. [DOI] [PubMed] [Google Scholar]
- 39.Tame JRH, Sleigh SH, Wilkinson AJ, Ladbury JE. the role of water in sequence independent ligand binding by an oligopeptide transporter protein. Nat Struct Biol. 1996;3:998–1001. doi: 10.1038/nsb1296-998. [DOI] [PubMed] [Google Scholar]
- 40.Pai EF, et al. Refined crystal structure of the triphosphate conformation of H-ras p21 at 1.35 A resolution: Implications for the mechanism of GTP hydrolysis. EMBO J. 1990;9:2351–2359. doi: 10.1002/j.1460-2075.1990.tb07409.x. [DOI] [PMC free article] [PubMed] [Google Scholar]
- 41.Halabi N, Rivoire O, Leibler S, Ranganathan R. Protein sectors: Evolutionary units of three-dimensional structure. Cell. 2009;138:774–786. doi: 10.1016/j.cell.2009.07.038. [DOI] [PMC free article] [PubMed] [Google Scholar]
- 42.Pasternak A, Ringe D, Hedstrom L. Comparison of anionic and cationic trypsinogens: The anionic activation domain is more flexible in solution and differs in its mode of BPTI binding in the crystal structure. Protein Sci. 1999;8:253–258. doi: 10.1110/ps.8.1.253. [DOI] [PMC free article] [PubMed] [Google Scholar]
- 43.Berman HM, et al. The Protein Data Bank. Nucleic Acids Res. 2000;28:235–242. doi: 10.1093/nar/28.1.235. [DOI] [PMC free article] [PubMed] [Google Scholar]
- 44.Durbin R, Eddy S, Krogh A, Mitchison G. Biological Sequence Analysis: Probabilistic Models of Proteins and Nucleic Acids. New York: Cambridge Univ Press; 1998. pp. 319–321. [Google Scholar]
- 45.Jaynes ET. Information theory and statistical mechanics. Phys Rev. 1957;106:620–630. [Google Scholar]
- 46.Jaynes ET. Information theory and statistical mechanics. II. Phys Rev. 1957;108:171–190. [Google Scholar]
- 47.Plefka T. Convergence condition of the TAP equation for the infinite-ranged Ising spin glass model. J Phys A Math Gen. 1982;15:1971–1978. [Google Scholar]
- 48.Georges A, Yedidia J. How to expand around mean-field theory using high-temperature expansions. J Phys A Math Gen. 1991;24:2173–2192. [Google Scholar]
- 49.Thouless DJ, Anderson PW, Palmer RG. Solution of “Solvable model of a spin glass”. Philos Mag. 1977;35:593–601. [Google Scholar]
- 50.Marks DS, et al. 3D protein structure predicted from sequence. arXiv:1110.5091v2 [q-bio.BM]
