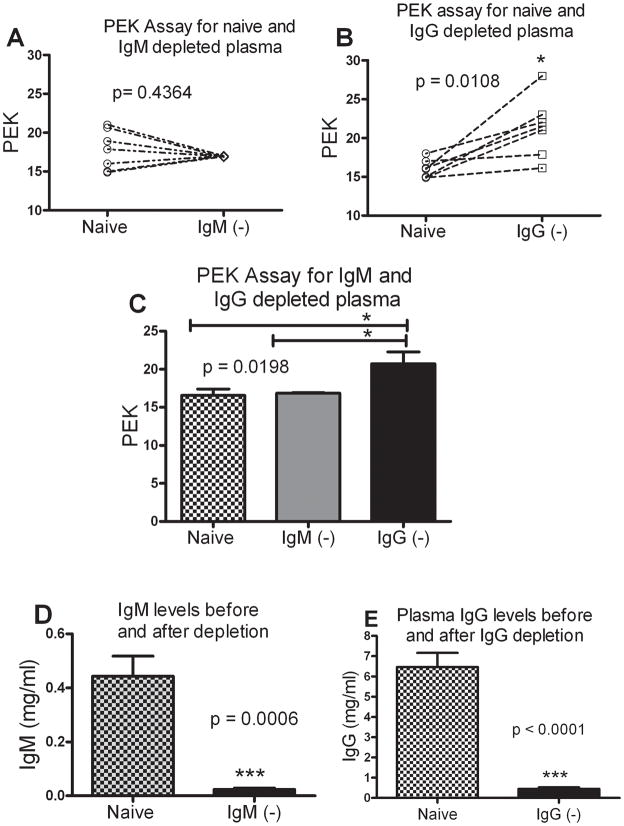
Figure 6. Critical role of plasma IgG in determining PEK capacity.
(A) PEK of IgM depleted plasma when compared to the naïve pre-CLP plasma. Each symbol is an individual mouse comparing naïve and IgM depleted (IgM−) PEK values. (B) Change in PEK of IgG depleted plasma when compared to the naïve pre-CLP plasma. Each symbol is an individual mouse comparing naïve and IgG depleted (IgG−) PEK values. In every sample, depletion of IgG increases the PEK numbers. (C) Depletion of IgM does not change the PEK value, while depletion of IgG results in a significant increase. n=7 both groups. p < 0.05 when compared to naive and IgG depleted plasma. (D) Plasma IgM levels before and after depletion. (E) Plasma IgG levels before and after depletion.

