Abstract
The pKa values of Lys-66, Glu-66 and Asp-66 buried in the interior of the staphylococcal nuclease Δ+PHS variant were reported to be shifted by as much as 5 pKa units from their normal values. Reproducing the pKa of these buried ionizable residues using continuum electrostatic calculations required the use of a high protein dielectric constant of 10 or higher. The apparent high dielectric constant has been rationalized as a consequence of a local structural reorganization or increased fluctuations in the microenvironment of the mutation site We have calculated the dielectric constant of Δ+PHS and the Lys-66, Asp-66 and Glu-66 mutants from first principles using the Kirkwood-Fröhlich equation, and discovered that staphylococcal nuclease has a naturally high dielectric constant ranging from 20 to 30. This high dielectric constant does not change significantly with the mutation of residue 66 or with the ionization of the mutated residues. Calculation of the spatial dependence of the dielectric constant for the microenvironment of residue-66 produces a value of about 10, which matches well with the apparent dielectric constant needed to reproduce pKa values from continuum electrostatic calculations. Our results suggest an alternative explanation that the high dielectric constant of staphylococcal nuclease is a property resulting from the intrinsic backbone fluctuations originating from its structural architecture.
Keywords: dielectric constant, pKa values, Kirkwood-Fröhlich equation, staphylococcal nuclease.
Fundamental biochemical processes, such as catalysis1,2 hydrogen transport3 and electron transfer4 involve the participation of ionizable residues located in the interior of proteins. Investigating the structural basis of such biological processes requires a quantitative understanding of electrostatic contributions, and this often entails the determination of pKa values of ionizable residues. The sensitivity of protein stability to pH and temperature changes has limited the options available to investigate the molecular mechanisms whereby such buried charges are stabilized or to probe the structural and dynamic response of proteins to the ionization of such residues.
The Δ+PHS variant of staphylococcal nuclease is known for its stability in a wide range of temperature and pH conditions, and has aided investigators in attempting to seek a more fundamental understanding of such biochemical processes.5,6 It was discovered that ionizable residues not exposed to bulk water in the interior of proteins titrate with pKa values that are shifted from the typical values adopted by surface ionizable groups exposed to water. The pKa values of Lys, Glu and Asp buried at position 66 of Δ+PHS that were reported previously,7-9 all exhibit such a phenomenon. The dielectric constants required to reproduce experimental pKa values of these interior residues with FDPB calculations are 10 or higher,8,9 which is significantly higher than experimental measurements of the dielectric constant of dry protein powders of 4.10-12
Locating the source of this apparent high dielectric constant of Δ+PHS has remained elusive until recent work by García-Moreno and co-workers, who suggested that the apparent high dielectric constant of staphylococcal nuclease stems from a local structural reorganization of the microenvironment surrounding residue-66, based on observations made from CD spectroscopy which suggests a loss of helicity upon the introduction of a charged residue into the interior of the protein.13 Recent NMR studies have also suggested a change in chemical environment of the residues surrounding the mutation site, and this may imply an increase in fluctuations and/or local structural reorganization of the area around the mutation site.14 Data gathered from MD simulations also support this hypothesis, as it was observed that the local structural reorganization may be manifested as a transient loss of helicity in the α-helix that holds residue-66.15
One implicit assumption made in the above-mentioned hypothesis is that the dielectric constant of staphylococcal nuclease and all its variant forms has a low value of about 4. There are two different microscopic phenomena contributing to a protein’s dielectric constant – electronic polarizability and dipolar relaxation. Previous work by Simonson and Perahia has demonstrated that the electronic polarizability component for cytochrome c is 2.16 This suggests that the low dielectric constant of 4 obtained from experimental measurements on dry protein powder10-12 originates from approximately equal contributions from electronic polarization and the dipolar relaxation. For proteins that are found in their native aqueous environment, backbone and sidechain motions further increase dipolar relaxation, which necessitates introducing the protein to an aqueous environment in order to determine the true extent of dipolar relaxation contributions. This however, poses a complication because the experimentally measured value will be dominated by water and not represent the protein. In such cases where there exists challenging practical constraints on experimental studies, computational methodologies have emerged as viable alternatives. To address the problem of determining the total protein dielectric constant that consists of both electronic polarizability and dipolar relaxation contributions, we will use the methodology developed by Simonson and co-workers for calculating the dielectric constant of a protein from first principles using the Kirkwood-Fröhlich theory of dielectrics.17,18
Crystal structures were used as the input structures for MD simulations (PDB accession code: 3BDC, 3HZX, 1U9R, 2OXP, 1STN). For each residue-66 variant of Δ+PHS, an alternate protonation state was created by manually patching the residue to its neutral state. MD simulations for both native and alternate protonation states were performed in CHARMM2719 using the GBSW implicit solvent model20,21 as reported previously.18,22 Using a method adapted from Feng et. al.,23 we calculated the average protein structure for the entire MD trajectory, which was used as a reference to determine the mass-weighted fluctuations of each residue in terms of cartesian coordinates and torsion (phi and psi) angles. Chemical shift values were calculated from the MD trajectory using SHIFTS.24 Further details of the simulation setup can be found in Supporting Information [SI].
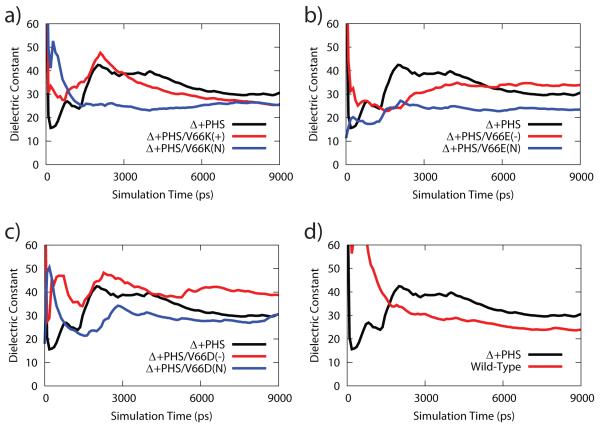
As shown in Figure 1, the dielectric response of Δ+PHS and the Δ+PHS V66K/E/D variants achieved convergence at the end of 9 ns. The dielectric constant of Δ+PHS converged to 30 ± 7, while the wild type had a comparably high dielectric constant of 24 ± 6. The dielectric constant of Δ+PHS did not change significantly upon mutation of Val-66 to Lys-66, Glu-66 or Asp-66, which converged to values of 25 ± 3, 33 ± 6 and 38 ± 5, respectively. In addition, the protonation states of the ionizable residues did not significantly alter the protein dielectric constant (Table 1). On the whole, our simulation results suggest that staphylococcal nuclease and its variants possess a naturally high dielectric constant with values ranging from 20 to 30, which is much higher than the dielectric constant of 4 obtained from dry powder experiments.10-12
Figure 1.
Time evolution of the dielectric constant for the course of the MD simulation for Δ+PHS in comparison to (a) V66K variant, (b) V66E variant, (c) V66D variant, (d) wild type protein.
Table 1.
Converged values of G factor and protein dielectric constant at the end of the 9 ns MD simulation are shown. Numbers in parenthesis indicate the uncertainty of calculated values.
| <ΔM2> (eÅ)2 |
G factor | ε p | |
|---|---|---|---|
| Wild-Type | 245 (62) | 20 (5) | 24 (6) |
| Δ+PHS | 292 (67) | 25 (6) | 30 (7) |
| Δ+PHS/V66K (Charged) | 244 (26) | 21 (2) | 25 (3) |
| Δ+PHS/V66K (Neutral) | 250 (52) | 21 (4) | 25 (5) |
| Δ+PHS/V66E (Charged) | 321 (58) | 27 (5) | 33 (6) |
| Δ+PHS/V66E (Neutral) | 224 (48) | 19 (4) | 23 (5) |
| Δ+PHS/V66D (Charged) | 362 (41) | 30 (3) | 38 (5) |
| Δ+PHS/V66D (Neutral) | 289 (155) | 25 (13) | 30 (16) |
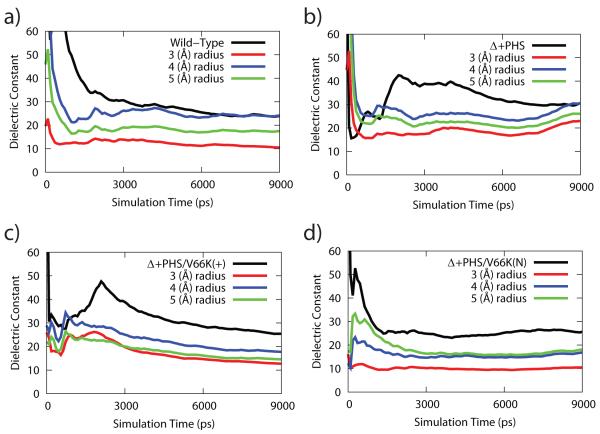
Previous work by Simonson and Brooks has indicated that the dielectric constant of a protein exhibits a spatial-dependence as one moves from the center of mass of a globular protein toward its surface, where the hydrophobic interior yielded a lower dielectric constant than the overall value for the protein.18 In a similar fashion, we have performed a calculation of the spatial dependence of the dielectric constant about residue-66 to ascertain the native value of the dielectric constant in the microenvironment surrounding residue-66. However, as residue-66 is situated less than 6 Å from the surface of the protein, we only analyzed the dipole fluctuations of the residues that were located within a 3 Å to 5 Å radius around residue-66. The lower limit was determined by noting that it was the smallest radius that includes a reasonable number of residues (12). The upper limit was determined by noting it was lower than the distance of residue-66 to the protein surface, and further increase of the radius would incorporate too much solvent in the spherical volume.
The convergence of the spatially-dependent dielectric constant is shown in Figure 2. Minor variations between the spatially-dependent dielectric constant for the four protein systems exist, but in almost all cases the dielectric constants were well above 4. Similar results (data not shown) were also found for the spatially-dependent dielectric constant of the V66D and V66E variants of Δ+PHS. While previous work has suggested that a protein’s high dielectric constant stems primarily from the fluctuations of surface charged residues,18 our calculation of the spatial dependence of the dielectric constant included very few surface residues but still produced a high dielectric constant value, which indicates that staphylococcal nuclease has an above average degree of dipole fluctuation than other proteins previously studied by Simonsonand co-workers. 17,18 As this phenomenon has been consistently observed in the wild-type, Δ+PHS and Δ+PHS residue-66 variants, we suggest that the high dielectric constant of staphylococcal nuclease may be a feature of the intrinsic rapid backbone fluctuations stemming from their shared structural architecture, and is not related to increases in fluctuations and/or local structural reorganization upon ionization of the Δ+PHS residue-66 variants.
Figure 2.
Time evolution of the spatially-dependent dielectric constant for the course of the MD simulation for (a) wild type, (b) Δ+PHS, (c) Δ+PHS/V66K variant in its charged form, (d) Δ+PHS/V66K variant in its neutral form.
To determine the presence of local structural reorganization and/or local fluctuations as suggested by the experimental studies, we performed an analysis of the RMSD, fluctuations in Cartesian space and fluctuations in torsion angles, and compared these between the various MD trajectories (Supporting Information [SI]). While there were minor variations, most notably in the region of residues 15-20, 75-85 and 110-120, there were no predictable patterns in our simulations in which one form of the protein had consistently larger fluctuations than the others. We conclude that our simulations did not capture the local structural reorganization phenomenon or increased fluctuations that were inferred from experimental data. This, however, may not be surprising since it was reported that the unwinding of the α-helix for Δ+PHS/V66K is a highly transient event and could only be observed though the application of multiple self-guided Langevin dynamics simulations, and such an extensive sampling methodology was not utilized in our study.15
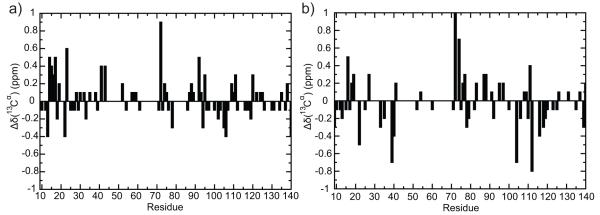
Next, we calculated the 13Cα chemical shift values of Δ+PHS/V66K from the simulation and compared the change in chemical shift values between the charged and neutral species with previously reported experimental data (Figure 3). We identified the following residues that were observed to be in a 7 Å radius from residue-66 during the simulation, which we consider to make up the microenvironment of residue-66: 13-14, 16-17, 23, 61-72, 92-94 and 99. Our simulated chemical shifts were qualitatively consistent for residues 13 (−0.2 vs −0.4), 16 (0.5 vs 0.3), 72 (1.1 vs 0.9) but were inconsistent for residues 14 (0.0 vs 0.5), 17 (−0.1 vs 0.5), 23 (0.0 vs 0.6), 92 (−0.2 vs 0.5). The remaining residues listed either had missing experimental chemical shift data or their chemical shifts were too small to draw any conclusion. It should be noted that our results should only be interpreted qualitatively as the standard deviation of the calculated chemical shift values are almost of the same order of magnitude as some of the Δδ ppm values. However, on the whole the results obtained from both simulated and experimental data have a considerable degree of similarity.
Figure 3.
Δδ(13Cα) (ppm) chemical shift difference between Δ+PHS/V66K at pH 6.7 and Δ+PHS/V66K at pH 4.6 as obtained from (a) experimental data and (b) simulation data. Residues that had missing experimental data have been excluded in this comparison.
In conclusion, we have calculated from first principles the dielectric constant of staphylococcal nuclease using the Kirkwood-Fröhlich equation and found that the wild-type, Δ+PHS and Δ+PHS/V66K/D/E variants all have a naturally high dielectric constant of value 20 to 30, and a value of about 10 for the microenvironment around residue-66. This matches well with the apparent dielectric constant needed to reproduce experimental pKa values from continuum electrostatic calculations. The mutation of Val-66 to an ionizable residue did not significantly alter the calculated value of dielectric constant, and neither did the protonation state of Lys-66, Asp-66 or Glu-66. These findings strongly suggest that the dielectric constant Δ+PHS and its variants is much higher than 4. Based on our analysis of the fluctuations of the Cartesian coordinates and torsion angles, we saw no evidence for the increased local fluctuations and/or structural reorganization of the Δ+PHS/V66K variant as inferred from experimental studies. Our calculated chemical shift values, however, do show a degree of similarity with experimental values, although admittedly not perfect. We suggest that increased local fluctuations and/or structural reorganization may not be a necessary condition to explain the high dielectric constant of staphylococcal nuclease. We provide an alternative explanation: the high dielectric constant is a feature arising from the intrinsic rapid backbone fluctuations that are a result of the common structural architecture shared between the wild-type staphylococcal nuclease, Δ+PHS and Δ+PHS/V66K/D/E variants. Our findings also imply that nanosecond time-scale motions may be the primary determinant of the dielectric response of a protein. Nevertheless, our study does not rule out the possibility that increased local fluctuations and/or structural reorganization occurring on the millisecond timescale may still increase the dielectric constant of staphylococcal nuclease, but such an effect would be in addition to the naturally high dielectric constant that staphylococcal nuclease possesses.
Supplementary Material
ACKNOWLEDGMENT
This work is supported by grants to CLB from NIH (RR012255), (GM057513) and NSF (PHY0216576) and grants to BEG from NIH (GM-061597).
ABBREVIATIONS
- MD
molecular dynamics
- CD
circular dichroism.
Footnotes
ASSOCIATED CONTENT
Supporting Information. Materials, methods and additional analysis. This material is available free of charge via the Internet at http://pubs.acs.org.
REFERENCES
- (1).Li YK, Kuliopulos A, Mildvan AS, Talalay P. Biochemistry. 1993;32:1816. doi: 10.1021/bi00058a016. [DOI] [PubMed] [Google Scholar]
- (2).Luecke H, Lanyi JK. Adv. Protein. Chem. 2003;63:111. doi: 10.1016/s0065-3233(03)63005-6. [DOI] [PubMed] [Google Scholar]
- (3).Czerwinski RM, Harris TK, Massiah MA, Mildvan AS, Whitman CP. Biochemistry. 2001;40:1984. doi: 10.1021/bi0024714. [DOI] [PubMed] [Google Scholar]
- (4).Parson WW, Chu ZT, Warshel A. Biochim. Biophys. Acta. 1990;1017:251. doi: 10.1016/0005-2728(90)90192-7. [DOI] [PubMed] [Google Scholar]
- (5).Shortle D, Meeker AK. Proteins. 1986;1:81. doi: 10.1002/prot.340010113. [DOI] [PubMed] [Google Scholar]
- (6).Byrne MP, Manuel RL, Lowe LG, Stites WE. Biochemistry. 1995;34:13949. doi: 10.1021/bi00042a029. [DOI] [PubMed] [Google Scholar]
- (7).Garcia-Moreno B, Dwyer JJ, Gittis AG, Lattman EE, Spencer DS, Stites WE. Biophys. Chem. 1997;64:211. doi: 10.1016/s0301-4622(96)02238-7. [DOI] [PubMed] [Google Scholar]
- (8).Dwyer JJ, Gittis AG, Karp DA, Lattman EE, Spencer DS, Stites WE, Garcia-Moreno EB. Biophys. J. 2000;79:1610. doi: 10.1016/S0006-3495(00)76411-3. [DOI] [PMC free article] [PubMed] [Google Scholar]
- (9).Karp DA, Gittis AG, Stahley MR, Fitch CA, Stites WE, Garcia-Moreno EB. Biophys. J. 2007;92:2041. doi: 10.1529/biophysj.106.090266. [DOI] [PMC free article] [PubMed] [Google Scholar]
- (10).Harvey SC, Hoekstra P. J. Phys. Chem. 1972;76:2987. doi: 10.1021/j100665a011. [DOI] [PubMed] [Google Scholar]
- (11).Bone S, Pethig R. J. Mol. Biol. 1982;157:571. doi: 10.1016/0022-2836(82)90477-6. [DOI] [PubMed] [Google Scholar]
- (12).Bone S, Pethig R. J. Mol. Biol. 1985;181:323. doi: 10.1016/0022-2836(85)90096-8. [DOI] [PubMed] [Google Scholar]
- (13).Karp DA, Stahley MR, Garcia-Moreno B. Biochemistry. 2010;49:4138. doi: 10.1021/bi902114m. [DOI] [PMC free article] [PubMed] [Google Scholar]
- (14).Chimenti MS, Castaneda CA, Majumdar A, Garcia-Moreno EB. J. Mol. Biol. 2011;405:361. doi: 10.1016/j.jmb.2010.10.001. [DOI] [PMC free article] [PubMed] [Google Scholar]
- (15).Damjanovic A, Wu X, Garcia-Moreno EB, Brooks BR. Biophys. J. 2008;95:4091. doi: 10.1529/biophysj.108.130906. [DOI] [PMC free article] [PubMed] [Google Scholar]
- (16).Simonson T, Perahia D. J. Am. Chem. Soc. 1995;117:7987. [Google Scholar]
- (17).Simonson T, Perahia D. Proc. Natl. Acad. Sci. U S A. 1995;92:1082. doi: 10.1073/pnas.92.4.1082. [DOI] [PMC free article] [PubMed] [Google Scholar]
- (18).Simonson T, Brooks CL., III J. Am. Chem. Soc. 1996;118:8452. [Google Scholar]
- (19).Brooks BR, et al. J. Comput. Chem. 2009;30:1545. doi: 10.1002/jcc.21287. [DOI] [PMC free article] [PubMed] [Google Scholar]
- (20).Im W, Lee MS, Brooks CL., III J. Comput. Chem. 2003;24:1691. doi: 10.1002/jcc.10321. [DOI] [PubMed] [Google Scholar]
- (21).Chen J, Im W, Brooks CL., III J. Am. Chem. Soc. 2006;128:3728. doi: 10.1021/ja057216r. [DOI] [PMC free article] [PubMed] [Google Scholar]
- (22).Dominy BN, Minoux H, Brooks CL., III Proteins. 2004;57:128. doi: 10.1002/prot.20190. [DOI] [PubMed] [Google Scholar]
- (23).Feng J, Wong KY, Lynch GC, Gao X, Pettitt BM. J. Phys. Chem. B. 2009;113:9472. doi: 10.1021/jp902537f. [DOI] [PMC free article] [PubMed] [Google Scholar]
- (24).Moon S, Case DA. J. Biomol. NMR. 2007;38:139. doi: 10.1007/s10858-007-9156-8. [DOI] [PubMed] [Google Scholar]
Associated Data
This section collects any data citations, data availability statements, or supplementary materials included in this article.


