

Abstract
Introduction
Multidrug-resistance Protein-3 (MRP3), a membrane bound transporter, facilitates efflux of toxic compounds, including certain chemotherapies, out of cells. Aberrant MRP3 expression has been linked to drug resistance in NSCLC. We sought to determine if tumor MRP3 expression patterns correlate with the mutational status of upstream regulators, including nuclear factor erythroid-2–related factor 2 (Nrf2) and its functional repressor Keap1 in NSCLC cell lines and patient samples.
Methods
To identify putative Nrf2 binding sites in the MRP3 promoter and to evaluate Keap1, Nrf2, and p53 mutations status in 4 cell lines and 33 NSCLC surgically resected tumor specimens with regard to their impact on MRP3 levels.
Results
ChIP analysis of the MRP3 promoter revealed an almost threefold increase in Nrf2 binding to the third putative Nrf2 binding sequence distal to the start site, demonstrating direct regulation of MRP3 by Nrf2. In NSCLC cell lines elevated Nrf2 protein was observed in cell lines with increased MRP3 RNA expression. In patient tumor specimens, the presence of mutations in Keap1/Nrf2 correlated with MRP3 RNA levels (p<0.05). p53 mutations were observed in 33% of cases, and all Keap1 mutant-positive tumors possessed a p53 mutation (n=5; p=0.0019).
Conclusions
We demonstrate direct involvement between the transcription factor Nrf2 and the MRP3 promoter, which leads to the upregulation of the MRP3 gene. Additionally, we found a statistically significant correlation between the presence of Keap1/Nrf2 mutations and increased MRP3 mRNA levels in our NSCLC patient samples.
Keywords: Keap1, Nrf2, p53, MRP3, NSCLC
Introduction
Multidrug-resistant proteins (MRPs) are a 9-member branch of the ATP-binding cassette superfamily 1. The role of MRP3 is to facilitate transport of toxic compounds out of cells; however, this increased transport can contribute to the chemoresistance of cancer cells 2. Chemotherapy, radiation, and xenobiotic stresses have been shown to induce levels of select MRPs as part of a stress response program. Three members of the MRP family, MRPs 1–3, have been associated with increased resistance to chemotherapeutic compounds, and are thought to play a role in drug resistance of non-small cell lung carcinoma (NSCLC) 3, 4. MRP1 levels have been reported to increase with NSCLC cancer stage and invasiveness 5, 6. MRP3 is the closest structural ABCC family member to MRP1 (~58% homology) 3. MRP3 protein levels have been correlated with decreased sensitivity of lung cancer cell lines to doxorubicin, vincristine, etoposide, and cisplatin 4. Additionally, MRP3 expression correlates with increased resistance to methotrexate and doxorubicin in NSCLC cell lines and patient tumor samples 2, 3.
The current accepted model for Nrf2 regulation is one in which two amino-terminal motifs in the Neh2 domain, a weak binding DLG motif and a strong binding ETGE motif, act as binding sites for Keap1, which in turn promotes ubiquitination and rapid degradation; also known as the hinge and latch model 7. We and others have demonstrated that inhibition of Nrf2 decreases resistance to chemotherapeutic agents 8, 9. Further, Shibata et al. found that Nrf2 mutations occurred in approximately 11% of lung cancer samples, with a striking frequency in the Neh2 domain, and that these patients had a poor prognosis 7. Keap1, the key functional repressor of Nrf2 is comprised of an N-terminal region (AA 1–60), a BTB domain (AA 61–179), a central IVR (AA 180–314), six Kelch motifs (AA 315–359, 361–410, 412–457, 459–504, 506–551, and 553–598), and a C-terminal domain (AA 599–624) 10. Singh et al. found that Keap1 loss-of-function mutations occurred in approximately 19% of NSCLC tumors and 50% of NSCLC cell lines examined 10. In NSCLC cell lines with mutant (mt) Keap1, Nrf2 was found to be constitutively active and MRP1&2 expression was elevated 10. In addition to enhanced drug resistance, Keap1 mutants may also possess rapid growth characteristics 11. The goals of this study were to 1) determine whether Nrf2 interacts with the putative (EpRE) binding sites located −434, −628, −805, and −1049 bp upstream of the MRP3 promoter; and 2) determine whether tumor MRP3 expression patterns correlate with the mutational status of Keap1, Nrf2, and p53 in NSCLC cell lines and patient samples.
Materials and Methods
Chemicals and Reagents
Unless otherwise noted, all chemicals were obtained from Sigma (St. Louis, MO). Rabbit Nrf2 antibodies at 1/200 (sc-722), and mouse β-actin antibody at 1:10,000 (A5441, Sigma) were obtained from Santa Cruz Biotechnology (Santa Cruz, CA). DNA-free reagents were obtained from Fermentas (Glen Burnie, MD). TaqMan Reverse Transcription Reagent and SYBR Green PCR Master Mix were obtained from Applied Biosystems (Foster City, CA).
Cell Culture and Treatments
The cell lines H358 (p53 null/Keap1 wt), H1666 (p53 wt/Keap1 wt), A549 (p53 wt/Keap1 mt), H1650 (p53 wt/Keap1 wt), and DU-145 (p53 mt/Keap1 wt*) were obtained from the ATCC (Manassas, VA) and maintained in RPMI 1640 (Biowhittacker, Walkersville, MD) supplemented with 10% heat-inactivated FBS (Omega Scientific, Tarzana, CA) to which was added MEM Essential Vitamin Mix, Penicillin-Streptomycin, L-Glutamine. All cultures were grown at 37°C in 5% CO2 atmosphere. Cells were plated on 60 mm cell culture dishes at a density of 300,000 cells per dish. Cells were treated at approximately 70% confluence. Agents were diluted to appropriate concentrations in media before use.
RT-PCR
The content of MRP3 and β-actin mRNA was determined with real-time RT-PCR method. RNA samples were treated with DNA-free reagent and reverse transcribed by using the TaqMan reverse transcription system. Real-time PCR was performed with a BioRad iQ5 iCycler PCR machine (Hercules, CA). β-actin was used as internal control. The primers are as follows: MRP3, forward 5′-CAGAGAAGGTGCAGGTGACA-3′, reverse 5′-CTAAAGCAGCATA GACGCCC-3′; β-actin, forward 5′-TGGGTGTGAACCATGAGAAG-3′, reverse 5′-CCATCACGACACAGTTTCC-3′.
SSCP PCR
Analysis was performed in 25 μl reactions using 1x AmpliTaq Gold PCR Master Mix (Applied Biosystems, Foster City, CA), 10 μM of primers, and one μl of genomic DNA were used. The primer sequences for p53 exons 5–8 are as follows; p53 exon 5: forward, 5′-TTCAACTCTGTCTCCTTCT-3′; reverse, 5′-CAGCCCTGTCGTCTCTCCAG-3′; p53 exon 6: forward, 5′-GCCTCTGATTCCTCACTGAT-3′; reverse, 5′-TTAACCCCTCCTCCCAGAGA-3′; p53 exon 7; forward, 5′-CTTGCCACAGGTCTCCCCAA-3′; reverse, 5′-TGTGCAGGGTGGCAAGTGGC-3′; p53 exon 8: forward, 5′-TTCCTTACTGCCTCTTGCTT-3′; reverse, 5′-CGCTTCTTGTCCTGCTTGCT-3′. PCR was performed in a BioRad PTC-200 DNA Engine Thermal Cycler (BioRad, Hercules, CA) for 35 cycles at 95°C for 15s, 55°C for 30s, and 68°C for 60s with a final extension at 68°C for 10 minutes. After PCR, 5 μl of PCR products were checked by gel electrophoresis using ethidium bromide. Subsequently, 3 μl of PCR products were mixed with 3 μl of SSCP loading buffer (95% formamide, 5% xylene, and 10 mg bromophenol blue), incubated at 95°C for 5 minutes, and immediately placed on ice. DNA samples were electrophoresed using the Gene Gel Excel 12.5/24 Kit (Amersham Pharmacia Biotech, Sweden) at 600 volts for 90 minutes. Exons 5, 7, and 8 were run at 18°C while exon 6 was run at 10°C. The GenePhor Elecotrophoresis Unit (Amersham Pharmacia Biotech, Sweden) was used for all SSCP reactions. DNA samples were visualized by silver stain. Any exon fragments migrating abnormally in SSCP gels were sequenced to define the base changes. The specific positions and types of nucleotide changes were recorded.
Tumor Specimens
IRB-approved NSCLC tumor tissues were acquired from the UC Davis Cancer Center Specimen Repository (CCSR). Specimens were collected at time of surgery, pathologically reviewed and annotated. Tissue was stored at −80°C until extraction of DNA, RNA, and protein, as described.
Preparation of Frozen Tissue
Genomic DNA was extracted from minced tissue using the QIAamp DNA extraction kit (Qiagen, Valencia, Ca) according to manufacturer’s protocol. RNA was extracted using Qiagen RNeasy Kit (Valencia, CA). Quantity and quality of both RNA and DNA were determined using a ND-1000 spectrophotometer (NanoDrop Technologies, Wilmington, DE).
Western blotting
Western blotting was performed as previously reported 12. Briefly, soluble proteins were extracted with the addition of RIPA lysis solution (RIPA Buffer, Leupeptin, Aprotinin, PMSF, NaVO4 and DNase, Rnase-free). The lysates were cleared by centrifugation at 12,000 rpm at 4°C for 15 minutes, and soluble protein extracts were stored frozen at −80°C. Protein concentrations were quantitated from duplicate readings using a modified Bradford assay (Bio-Rad Laboratories, Hercules, CA). Cell lysates were diluted with RIPA lysis buffer to either 20 or 30 μg/μl to facilitate equal loading of samples, and added to electrophoresis SDS sample buffer and boiled at 95°C for 5 minutes. Total cell extracts were separated by 10 or 15% SDS-PAGE gels using a mini-gel system (Bio-Rad laboratories, Hercules, CA) for 120–150 minutes. Proteins were transferred to nitrocellulose membranes (Bio-Rad Laboratories, Hercules, CA) overnight at a constant 40 volts. Membranes were then blocked with a powdered milk solution. Blots were incubated at room temperature for 1 h with Nrf2 (1: 200) and mouse anti-β-actin antibody (1:10,000). After washing, blots were incubated in horseradish peroxidase-conjugated antimouse IgG or antirabbit IgG antibodies (1:2500), (Promega) in TBS-T for 1 h, followed by incubation with chemiluminescent detection reagents (ECL, Fisher Scientific). Membranes were exposed to Kodak XAR film, the film developed and the results interpreted.
ChIP Assay
ChIP assay was performed following a protocol provided with the kit from Millipore (Temecula, CA). Briefly, cells were incubated with formaldehyde (final concentration is 1%) at room temperature for 10 minutes. Cell pellet was lysed on ice for 10 minutes and sonicated using a Branson sonifier 150 (Branson, Danbury, CT) under conditions that cause DNA to be broken into 200- to 800-bp fragments (5 sets of 10-second pulses on wet ice with output power at 3). Sonicated cell lysate was precleared with 60 μl of protein G agarose, and the supernatant was used for immunoprecipitation with antibodies to specific transcription factors overnight at 4°C. The protein/DNA complex was collected with 60 ml of protein G agarose and then it was washed and eluted from agarose in elution buffer. Next the crosslink of DNA/protein was reversed by adding 5 M NaCl and incubating the mixture at 65°C for 5 h. The DNA was extracted with Spin filter. GAPDH was used as the input control. The real time PCR was run for 50 cycles under the conditions: 95°C 25s, 61°C 30s and 72°C 31s. Primers used for PCR in the ChIP assay were as follows; EpRE1 forward, 5′-AGCCAAGGAAGGAAACACCT-3′; reverse, 5 ′-ATCTCTCAATCCCGCTGTTG-3′; EpRE2 forward, 5′-AGCCTTAGGAGGAGGACGAG-3′; reverse, GAATCTTCCTCCCAGGGTTC; EpRE3 forward, 5′-AGTAGAGGCCCAGAGACGTG-3′; reverse, 5′-GGGTGTGTACCCGTGAGG-3′; EpRE4 forward, 5′-CCAGTGGTCTCTGGAACCTG-3′; reverse, 5′-GTTCCTCTCCGGAGGTCAGT-3′; GAPDH: forward, 5′-TACTAGCGGTTTTACGGGCG-3′, reverse, 5′-TCGAACAGGAGGAGCAGAGAGCGA-3′.
DNA sequencing
PCR Primers for Keap1 sequencing 13 are as follows; Keap1 exon 2F1, 5′-TGGTGGTGTTGCTTATCTTCTGG-3′; Keap1 exon 2R1: 5′-TACCCTCAATGGACACCACCTCC-3′; Keap1 exon 2F2: 5′-AAGGTGGTGCTGGCCTCATCCAG-3′; Keap1 exon 2 R2: 5′-AGACAGTGATGAGCACTCGTCCA-3′; Keap1 exon 3F1: 5′-GGTGACTGGAGAGTCAGCCCGTC-3′; Keap1 exon 3R1: 5′-CTCCAGGTAGCTGAGCGACTGTC-3′; Keap1 exon3F2: 5′-TGCACAAGCCCACGCAGGTGATG-3′; Keap1 exon3R2: 5′-TTGGGACTTGCCAGGAGCAGGAC-3′; Keap1 exon 4F: 5′-CACGAAGGTCAGCTATAATGGCC-3′; Keap1 exon 4R: 5′-TCAGTTTCACCCCAGGATGGTAG-3′; Keap1 exon 5F: 5′-TCTCCCTCAAGGAGGTGATGGCT-3′; Keap1 exon 5 R: 5′-GCAAAAGCAGTCCACAAAAGATG-3′; Keap1 exon 6F: 5′-GCTCTTGGATGTGGTGTGACAGG-3′; Keap1 exon 6R: 5′-CAATGATACTCCCCATTGGACTG-3′. Primers for Nrf2 sequencing 7 are as follows; Nrf2 exon 2: forward, 5′-ACCATCAACAGTGGCATAATGTG-3′; reverse, 5′-GGCAAAGCTGGAACTCAAATCCAG-3′. All DNA sequencing was performed on an ABI 3730 Capillary Electrophoresis Genetic Analyzer using ABI BigDye Terminator v3.1 Cycle Sequencing chemistry.
Software
Scion Image software was used in this study to quantitate protein levels of western blots, by deriving a ratio between absorbance values. Qgene was used to quantitate relative mRNA levels.
Statistics
Comparisons of variants between experimental groups were conducted using one-way analysis of variance (ANOVA). Fisher’s Exact Test was used to determine nonrandom associations. All data is expressed as the mean ± standard error of the mean (SEM). In-Stat software was used for statistical analysis. Statistical significance was accepted when p < 0.05. The Tukey-Kramer Multiple comparisons test was used for comparison of mRNA levels.
Results
Nrf2 binds to an MRP3 upstream electrophilic response element (EpRE)
The genomic sequence of the human MRP3 gene (ABCC3) revealed four EpREs sequences in the promoter region from −11 bp through −1103 bp. EpRE binding sites are located −434, −628, −805, and −1049 bp. The Nrf2-EpRE signaling activator 4-hydroxy-2-nonenal (HNE) was used as a surrogate for oxidative stress 14, 15. We have previously demonstrated that HNE caused increases of MRP3 mRNA and protein levels in a Keap1-wt NSCLC cell line, but not in Keap1-mt NSCLC cell lines. As an extension of our previous work we sought to further establish the relationship of Nrf2 and MRP3 8. The interaction between Nrf2 and the MRP3 promoter was elucidated by use of a Chromatin immunoprecipitation (ChIP) assay of the Nrf2/DNA complex. Nrf2 binding was increased at the −805 bp EpRE after exposure to 10 μM of HNE for 3 h (Figure 1). Increased Nrf2 binding was not observed at other putative EpRE binding sites.
Figure 1.

EpRE binding sites are located −434, −628, −805, and −1049 bp. Nrf2 binding was increased ~2.8 fold vs. control at the −805 bp EpRE after 3 h exposure to 15μM HNE.
Keap1 and Nrf2 mutational status correlates with MRP3 levels in patient NSCLC specimens
The presence of mutations in Keap1, Nrf2, or p53 was investigated in 33 surgically-resected NSCLC tumor specimens and four NSCLC cell lines. (Figure 2A and 2B). Four homozygous and one heterozygous Keap1 mutations were detected in the patient samples. All were missense mutations: three homozygous G→T transversions, one G→A transition and one heterozygous C→T transition. One Nrf2 exon 2 mutation, a heterozygous missence G→A transition, was observed (Table 1). Eleven of the patient samples were mt for p53 (33%), which were cross checked with the IARC TP53 data base (www-p53.iarc.fr), and are defined in Table 2. All five of the patient samples that were mt for Keap1 also were mt for p53; a statistically significant association albeit from a highly limited sample size (p<0.0019) (Figure 2C). Sequencing of Keap1 and Nrf2 in our cell line models confirmed the homozygous mutation at amino acid 333 found by Singh et al. in A549; all other cell lines evaluated were wild type for Keap1 and Nrf2.
Figure 2.
A, PCR amplification of p53. Exons 5–8 were successfully amplified in patient samples. B, Single-Strand Conformation Polymorphism (SSCP). Single-Strand Conformation Polymorphism (SSCP). Mutations were found in eleven of thirty-three samples, and confirmed by sequencing. C, The left column represents the number of p53 wt patient samples in our cohort (22/33), the right column is the number of p53 mt patient samples (11/33). All five Keap1 mutations occurred in conjunction with a p53 mutation; Fisher’s Exact Test= two-sided P value is 0.0019.
Table 1.
| Cell Line/Sample | Mutation | Base Change | Amino Acid Change | Domain | Tumor Histology | Smoking Status |
|---|---|---|---|---|---|---|
| A549 | Keap1/Homo | G→T | G333C=non- polar to polar | First Kelch Domain | Adenocarcinoma | Unk |
| PT377 | Keap1/Homo | G→T | G333V=non- polar to non- polar | First Kelch Domain | Metastatic | Never |
| PT146 | Keap1/Homo | G→A | D422N=acidic to polar | Third Kelch Domain | Squamous | Current |
| PT135 | Keap1/Homo | G→T | W497C=non- polar to polar | Fourth Kelch Domain | Neuroendocrine | Former |
| PT423 | Keap1/Homo | G→T | A548S=non- polar to polar | Fifth Kelch Domain | Metastatic | Former |
| PT373 | Keap1/Hetro | C→T | T598I=polar to non-polar | Sixth Kelch Domain | Adenocarcinoma | Current |
| PT367 | Nrf2/Hetro | G→A | R43Q=basic to polar | Neh2 | Adenocarcinoma | Never |
Table 2.
| Sample | p53 Mutation |
|---|---|
| PT377 | E298X/E298X |
| PT373 | Deletion-Codons 244–246 |
| PT126 | P151S |
| PT421 | D281E |
| PT140 | Deletion-Codons 158–161 |
| PT423 | G154V |
| PT369 | C141G |
| PT135 | R248Q |
| PT297 | Insertion-Codon 201 |
| PT130 | P190L |
| PT146 | D259Y |
MRP3 levels are higher in mutant Keap1/Nrf2 cell line and NSCLC patient samples
Levels of MRP3 mRNA were evaluated in four NSCLC and one prostate cancer cell lines (Figure 3A), and mutational status of Keap1, Nrf2, and p53 were analyzed in thirty-three surgical NSCLC specimens. Cell lines H1650 (Keap1 wt, p53 wt) and H358 (Keap1 wt, p53 null) expressed relatively low levels of MRP3 mRNA, whereas A549 (Keap1 mt, p53 wt) had high levels of MRP3 mRNA, consistent with their functional status of Keap1. In contrast, H1666 (Keap1 wt, p53 wt) expressed high levels of MRP3. We then evaluated the prostate cancer cell line DU-145 (Keap1 wt, p53 mt), as it has recently been demonstrated to produce low levels of Keap1 due to promoter methylation and differentially spliced Keap1 mRNA. Total levels of ~67 KD Nrf2 were low in H1650 and H358, and high in A549. In contrast, H1666 cells showed considerable levels of ~110 KD Nrf2, which was also detected in DU-145 (Figure 3B). All tested cell lines had similar ratios of total Nrf2 protein to MRP3 mRNA levels (H1650 Nrf2 levels were below level of detection) (Figure 3C). Patient tumor specimens were evaluated for MRP3 levels with regard to their Keap1-Nrf2 functional status. Those harboring a mutation in Keap1 or Nrf2 had significantly elevated MRP3 levels compared to wild-type specimens (p<0.05) (Figure 4).
Figure 3.

A, H1650 (p53 wt/Keap1 wt/Nrf2 wt), H358 (p53 null/Keap1 wt/Nrf2 wt), H1666 (p53 wt/Keap1 wt/Nrf2 wt), A549 (p53 wt/Keap1 mt/Nrf2 wt), and DU-145 (p53 mt/Keap1 wt*). Levels of MRP3 mRNA of our cell line model are compared. B, Western blot of standard and ~110 KD Nrf2 in our cell line model. C, Scion Image absorbance measurements. Levels of total ~67KD and ~110KD Nrf2 as a ratio to respective β-actin levels. Legend: Horizontal lines= Keap1 wt, Black= Keap1 mt, Gray shading= Keap1 splicing errors. Results are expressed as means ± SEM (n= 3).
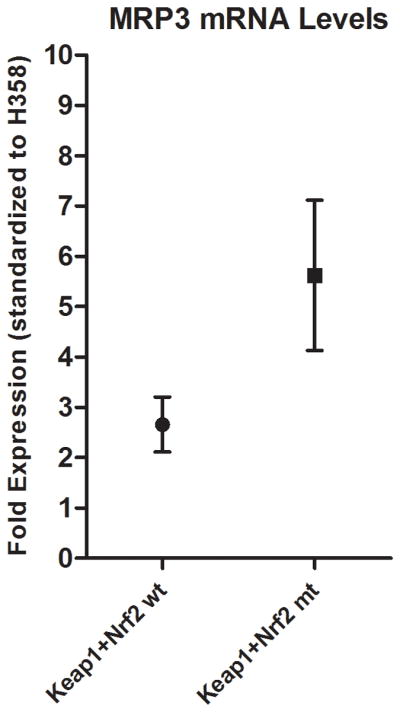
Figure 4.

Patient MRP3 mRNA levels were normalized to those of H358. Keap1/Nrf2 wt patient samples (Mean ~2.6 fold vs. H358) and Keap1/Nrf2 homozygous mt patient samples (Mean ~5.6 fold vs. H358) were significantly different (p<0.05). Results are expressed as means ± SEM.
Discussion
Chemotherapy, specifically platinum doublets, remains the primary treatment for advanced NSCLC. Unfortunately, NSCLCs have either acquired or inherent drug resistance. Such multifactorial drug resistance is one contributing factor to the abysmal five-year survival rate for metastatic NSCLC, which is just 2%. Chemoresistance is thought to be derived by two principle mechanisms: the first involves an improved capacity for DNA repair; the second involves up-regulation of the cellular detoxification pathways such as the super family of P-glycoproteins. Studies of clinical specimens and cell lines have shown an increased capacity for drug transport, and subsequent resistance, due to increased levels of the multidrug resistance transporters (MDRs) and MRPs.
Our analysis of the human MRP3 gene revealed four putative Nrf2 binding sites (EpREs) in the tentative promoter region. This finding led us to hypothesize that activation of Nrf2 could contribute to the induction of MRP3. ChIP analysis demonstrated increased Nrf2 binding to the −805bp EpRE after treatment with the Nrf2 activator, HNE. This data, in conjunction with our previous work involving Nrf2 and MRP3 regulation, would strongly implicate direct involvement of Nrf2 in the upregulation of MRP3 8. In NSCLC cell lines, total basal levels of MRP3 mRNA and Nrf2 protein were concordant, showing a positive correlation. While the cell lines H1650, H358, and A549 had MRP3 mRNA levels that corresponded to our hypothesis based on their respective mutational status, the NSCLC cell line H1666 (Keap1 wt, Nrf2 wt, p53 wt) had levels of MRP3 that exceeded those of the Keap1 mt A549. Recent data from Johns Hopkins University suggests an epigenetic explanation for this finding: they demonstrated that hypermethylation of the promoter and aberrant splicing of Keap1 mRNA occurred in the Keap1 wt cell line DU-145, causing low levels of Keap1, increased growth rates, and upregulation of Nrf2-controlled genes 16. We examined DU-145 and found modest induction of MRP3. Additionally, ~110 KD Nrf2 was present in only DU-145 and H1666. This variant of Nrf2 has been previously reported, and has been shown to be functionally active. What precisely is modifying Nrf2 migration is a subject of debate, with some evidence pointing to polyubiquitination or actin complexes 17–18. The prevalence of promoter hypermethylation and aberrant splicing of Keap1 in NSCLC patient populations could be of clinical relevance in defining chemoresistant populations. Another potential contributor to differences in basal Nrf2 activation that warrants further exploration is the endogenous production of oxidants that has been shown to be high in some cancer cells 19.
Sequencing of Keap1 and the Neh2 domain of Nrf2 in 33 primary tumors from lung cancer patients revealed missense mutations in a total of six tumors. Singh et al. found a frequency of Keap1 mutations of 18.5%, similar to our findings of 15%. Shibata et al. found approximately 11% of their patients analyzed were Nrf2 mt, compared to our findings of 3%. All but one of our mt patient specimens, the only sample of neuroendocrine histology, expressed high levels of MRP3. All of the Keap1 mutations were found to occur in the kelch domains, and intriguingly they all occurred in tumors that were also mt for p53. The veracity of this latter finding in NSCLC will require larger study populations. It has been demonstrated that human lymphoblastoid cells that have mt p53 acquire new mutations at a higher frequency 20. Patients who have mt p53 would consequently have reduced ability to preserve genomic integrity; as such one would expect these patients to acquire new mutations at an increased rate over their p53 wt counterparts. Alternatively, the concurrence of p53 and Keap1 mutations may cooperate synergistically to promote tumorigenesis.
Constitutive activation of Nrf2 has been demonstrated to be involved in the upregulation of a number of genes associated with cellular detoxification, including the drug transporter MRP3. Further studies are needed to determine the prevalence of Keap1 inactivation in the patient population due to mutation, transcriptional, and posttranscriptional mechanisms such as splicing errors. Future directions of this work could lead to: A) identification and development of tools for screening of tumor profiles that place NSCLC patients at increased risk for chemoresistance and metastasis, making this a prognostic as well as a predictive marker. B) understanding the molecular mechanisms that lead to clinically significant lung cancer could lead to improved therapies. For example, NSCLC patients harboring a loss of either wt Keap1 could have improved benefit from chemotherapy or radiotherapy when given in combination with compounds designed to inhibit the Nrf2 pathway. This research could lead to improve understanding of tumor genetic interactions on NSCLC treatment efficacy, and further, provide the proof-of-principle required for expanded basic, translation and clinical research that will have direct impact on patient care.
Acknowledgments
The authors would like to thank Christine Kwong and Leslie Solis for their assistance in this project. This work was supported by Grants 14RT-0059 from the California Tobacco Related Diseases Research Program and ES05511 from the National Institutes of Health, with additional support from the UC Davis Cancer Center P30 CA093373, Developmental Award.
References
- 1.Gerk PM, Vore M. Regulation of expression of the multidrug resistance-associated protein 2 (MRP2) and its role in drug disposition. J Pharmacol Exp Ther. 2002;302:407–415. doi: 10.1124/jpet.102.035014. [DOI] [PubMed] [Google Scholar]
- 2.Kool M, van der Linden M, de Haas M, et al. MRP3, an organic anion transporter able to transport anti-cancer drugs. Proc Natl Acad Sci U S A. 1999;96:6914–6919. doi: 10.1073/pnas.96.12.6914. [DOI] [PMC free article] [PubMed] [Google Scholar]
- 3.Lockhart AC, Tirona RG, Kim RB. Pharmacogenetics of ATP-binding cassette transporters in cancer and chemotherapy. Mol Cancer Ther. 2003;2:685–698. [PubMed] [Google Scholar]
- 4.Young LC, Campling BG, Voskoglou-Nomikos T, et al. Expression of multidrug resistance protein-related genes in lung cancer: correlation with drug response. Clin Cancer Res. 1999;5:673–680. [PubMed] [Google Scholar]
- 5.Sullivan GF, Amenta PS, Villanueva JD, et al. The expression of drug resistance gene products during the progression of human prostate cancer. Clin Cancer Res. 1998;4:1393–1403. [PubMed] [Google Scholar]
- 6.Sullivan GF, Yang JM, Vassil A, et al. Regulation of expression of the multidrug resistance protein MRP1 by p53 in human prostate cancer cells. J Clin Invest. 2000;105:1261–1267. doi: 10.1172/JCI9290. [DOI] [PMC free article] [PubMed] [Google Scholar]
- 7.Shibata T, Ohta T, Tong KI, et al. Cancer related mutations in NRF2 impair its recognition by Keap1-Cul3 E3 ligase and promote malignancy. Proc Natl Acad Sci U S A. 2008;105:13568–13573. doi: 10.1073/pnas.0806268105. [DOI] [PMC free article] [PubMed] [Google Scholar]
- 8.Mahaffey CM, Zhang H, Rinna A, et al. Multidrug-resistant protein-3 gene regulation by the transcription factor Nrf2 in human bronchial epithelial and non-small-cell lung carcinoma. Free Radic Biol Med. 2009;46:1650–1657. doi: 10.1016/j.freeradbiomed.2009.03.023. [DOI] [PMC free article] [PubMed] [Google Scholar]
- 9.Homma S, Ishii Y, Morishima Y, et al. Nrf2 enhances cell proliferation and resistance to anticancer drugs in human lung cancer. Clin Cancer Res. 2009;15:3423–3432. doi: 10.1158/1078-0432.CCR-08-2822. [DOI] [PubMed] [Google Scholar]
- 10.Singh A, Misra V, Thimmulappa RK, et al. Dysfunctional KEAP1-NRF2 interaction in non-small-cell lung cancer. PLoS Med. 2006;3:e420. doi: 10.1371/journal.pmed.0030420. [DOI] [PMC free article] [PubMed] [Google Scholar]
- 11.Ohta T, Iijima K, Miyamoto M, et al. Loss of Keap1 function activates Nrf2 and provides advantages for lung cancer cell growth. Cancer Res. 2008;68:1303–1309. doi: 10.1158/0008-5472.CAN-07-5003. [DOI] [PubMed] [Google Scholar]
- 12.Mahaffey CM, Davies AM, Lara PN, Jr, et al. Schedule-dependent apoptosis in K-ras mutant non-small-cell lung cancer cell lines treated with docetaxel and erlotinib: rationale for pharmacodynamic separation. Clin Lung Cancer. 2007;8:548–553. doi: 10.3816/clc.2007.n.041. [DOI] [PubMed] [Google Scholar]
- 13.Shibata T, Kokubu A, Gotoh M, et al. Genetic alteration of Keap1 confers constitutive Nrf2 activation and resistance to chemotherapy in gallbladder cancer. Gastroenterology. 2008;135:1358–1368. 1368 e1351–1354. doi: 10.1053/j.gastro.2008.06.082. [DOI] [PubMed] [Google Scholar]
- 14.Tirumalai R, Rajesh Kumar T, Mai KH, et al. Acrolein causes transcriptional induction of phase II genes by activation of Nrf2 in human lung type II epithelial (A549) cells. Toxicol Lett. 2002;132:27–36. doi: 10.1016/s0378-4274(02)00055-3. [DOI] [PubMed] [Google Scholar]
- 15.Zhang H, Court N, Forman HJ. Submicromolar concentrations of 4-hydroxynonenal induce glutamate cysteine ligase expression in HBE1 cells. Redox Rep. 2007;12:101–106. doi: 10.1179/135100007X162266. [DOI] [PMC free article] [PubMed] [Google Scholar]
- 16.Zhang P, Singh A, Yegnasubramanian S, et al. Loss of Kelch-like ECH-associated protein 1 function in prostate cancer cells causes chemoresistance and radioresistance and promotes tumor growth. Mol Cancer Ther. 9:336–346. doi: 10.1158/1535-7163.MCT-09-0589. [DOI] [PMC free article] [PubMed] [Google Scholar]
- 17.Li J, Johnson D, Calkins M, et al. Stabilization of Nrf2 by tBHQ confers protection against oxidative stress-induced cell death in human neural stem cells. Toxicol Sci. 2005;83:313–328. doi: 10.1093/toxsci/kfi027. [DOI] [PubMed] [Google Scholar]
- 18.Kang KW, Lee SJ, Park JW, et al. Phosphatidylinositol 3-kinase regulates nuclear translocation of NF-E2-related factor 2 through actin rearrangement in response to oxidative stress. Mol Pharmacol. 2002;62:1001–1010. doi: 10.1124/mol.62.5.1001. [DOI] [PubMed] [Google Scholar]
- 19.Kumar B, Koul S, Khandrika L, et al. Oxidative stress is inherent in prostate cancer cells and is required for aggressive phenotype. Cancer Res. 2008;68:1777–1785. doi: 10.1158/0008-5472.CAN-07-5259. [DOI] [PubMed] [Google Scholar]
- 20.Morris SM. A role for p53 in the frequency and mechanism of mutation. Mutat Res. 2002;511:45–62. doi: 10.1016/s1383-5742(01)00075-8. [DOI] [PubMed] [Google Scholar]