Abstract
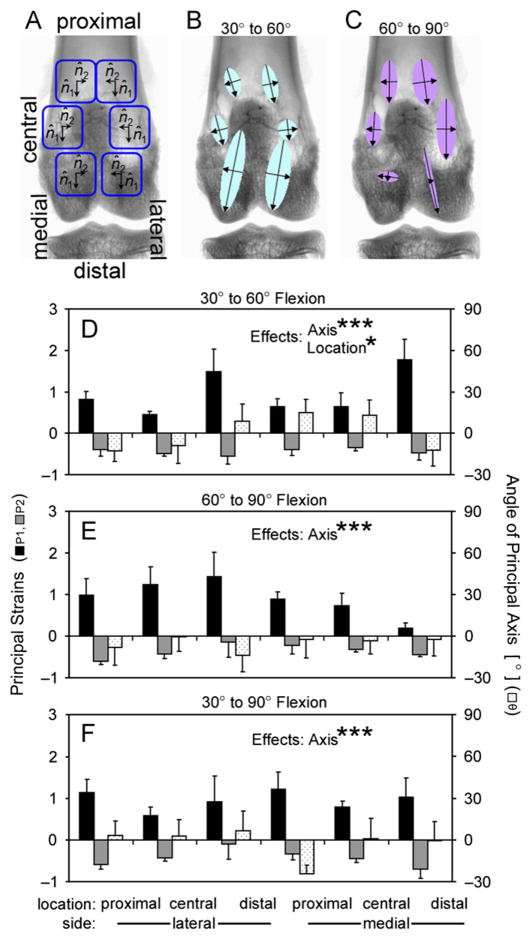
Diarthrodial joints are freely moveable joints containing synovial fluid (SF) within a connective tissue joint capsule that allows for low-friction and low-wear articulation of the cartilaginous ends of long bones. Biomechanical cues from joint articulation regulate synoviocyte and cartilage biology via joint capsule strain, in turn altering the composition of SF. Joint flexion is clinically associated with pain in knees with arthritis and effusion, with the nociception possibly originating from joint capsule strain. The hypothesis of this study was that knee fluid volume distribution and joint capsule strain are altered with passive flexion in the rabbit model. The aims were to (a) determine the volume distribution of fluid in the joint at different total volumes and with flexion of rabbit knees ex vivo, (b) correlate the volume distribution for the ex vivo model to in vivo data, and (c) determine the strains at different locations in the joint capsule with flexion. During knee flexion, ~20% of anteriorly located joint fluid moved posteriorly, correlating well with the fluid motion observed in in vivo joints. Planar joint capsule principal strains were ~100% (tension) in the proximal–distal direction and ~ −40% (shortening) in the circumferential direction, relative to the femur axis and 30° strain state. The joint capsule strains with flexion are consistent with the mechanics of the tendons and ligaments from which the capsule tissue is derived. The movement and mixing of SF volume with flexion determine the mechanical and biological fluid environment within the knee joint. Joint fluid movement and capsular strains affect synovial cell biology and likely modulate trans-synovial transport.
Keywords: Joint capsule, Strain, Rabbit model, Synovial fluid, Mechanobiology
1. Introduction
Diarthrodial joints are freely moveable and contain synovial fluid (SF) within a connective tissue capsule that allows for low-friction and low-wear articulation. In the knee, the joint capsule (a.k.a. articular capsule or capsular ligament) is a thin, but strong and flexible fibrous membrane derived from the fascia lata, quadriceps tendon, and surrounding ligaments (Gray, 1918). The intra-articular face of the joint capsule is covered by the synovial membrane, which contains a highly fibrillar intimal matrix layer, synovium, that is densely populated with synoviocytes (McDonald and Levick, 1988; Simkin, 1991).
Biomechanical cues from joint articulation regulate synoviocyte biology, in turn altering the composition of SF. SF contains several lubricant molecules, including high molecular weight hyaluronan (HA) (Balazs, 1974; Dahl et al., 1985; Mazzucco et al., 2004) mainly secreted by synoviocytes (Smith and Ghosh, 1987). The secretion rate of HA by synoviocytes is mechanosensitive at the cellular (Momberger et al., 2005) and joint scale (Ingram et al., 2008). Despite the mechanosensitive nature of these tissues, the biomechanics of knee joint capsule in situ are largely unexplored.
The overall and local SF volumes are important physiological quantities, as the biological and biomechanical effects of SF are concentration-dependent, and joint effusions may alter such concentrations. SF exhibits a number of volume-dependent mechanobiological features, including modulation of tissue biology by providing cytokines and alteration of joint friction and wear biomechanics based on lubricant concentration (Schmidt et al., 2007). SF volume can be increased with therapeutic injections, in diseases such as osteoarthritis (OA), and after traumatic injury.
In addition to the basic science motivations for understanding synovial fluid movement and capsule strain during articulation, joint flexion is clinically associated with pain in knees with effusion, and the nociception possibly originates from joint capsule strain. Patients typically maintain knees with effusion at 30–60° flexion, with pain and intra-articular fluid pressure increasing during further flexion (Eyring and Murray, 1964; Jayson and Dixon, 1970). The nociception of such joint pain may originate in the capsule, as joint capsule strain has been correlated with afferent nerve impulses in an animal model (Lu et al., 2005). Elucidation of the patterns of fluid movement and capsule strain with flexion may help explain the origin of this pain.
Micro-computed tomography (μCT) enhanced with contrast agents can provide high resolution 3D structural information of soft tissues and cavities, but has not previously been applied to quantify and localize joint fluid volume or capsule strains. Barium sulfate is a nearly insoluble contrast agent with high X-ray attenuation used clinically with CT to image the gastrointestinal tract (Ott and Gelfand, 1983; Johnson et al., 2008). Intra-articular injection of a contrast agent suspension allows for visualization of the bursae that compose the joint space.
The rabbit model has frequently been used for studies in biomechanics and orthopedics. The structural mechanics of the knee joint have been investigated using the rabbit model, both ex vivo (Woo et al., 1987) and in vivo (Gushue et al., 2005). In addition, rabbit models of osteoarthritis, such as the anterior cruciate ligament transection model, have been well-characterized (Yoshioka et al., 1996; Chang et al., 1997; Sah et al., 1997). In this study, in vivo and ex vivo fluid motions with flexion were determined and correlated; capsule strains were determined ex vivo, as the imaging and marker methods could not be used in vivo due to the size of live rabbits and the capacity of the μCT scanner.
Thus, the hypothesis of this study was that the knee fluid volume distribution and joint capsule strain are altered with flexion. The aims were to (1) determine the volume distribution of fluid in the joint at different total volumes and with flexion in ex vivo rabbit knees, (2) compare and correlate the volume distribution for the ex vivo model with the more physiological in vivo data, and (3) determine the strains at different locations in the joint capsule with flexion ex vivo.
2. Methods
2.1. Study design
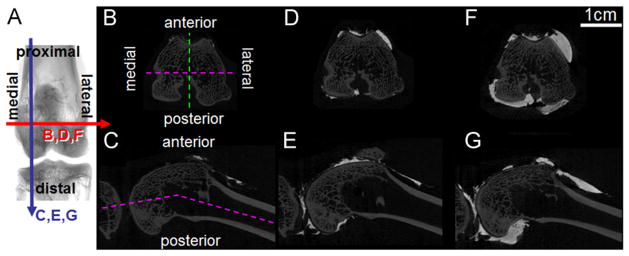
Fluid movement and joint capsule strains during flexion were investigated using ex vivo and in vivo rabbit knees. The joint space was divided into 4 quadrants—medial and lateral, anterior and posterior (Fig. 1A–C)—following knee anatomy, which includes distinct, but connected, medial and lateral posterior bursae, and the anterior bursa being conveniently divided along the proximal–distal axis by the patellofemoral groove. Fluid volume was localized to these quadrants in (n=6) ex vivo rabbit knees (3 right, 3 left) using contrast-enhanced μCT. SF volume in rabbit knees has been estimated as 50–400 μL in normal knees, increasing to 600–2200 μL with induced arthritis or arthroplasty (Delecrin et al., 1994; Coleman et al., 1997; Matsuzaka et al., 2002; Choi et al., 2007). Rabbit knees were injected sequentially with volumes in these ranges, totaling (i) 0.05 mL, (ii) 0.25 mL, and (iii) 0.95 mL and imaged by μCT at 60° flexion, and also subsequently imaged (with 0.95 mL) at (iv) 30° and (v) 90° flexion, to mimic flexion during hopping (~30–60°) and sitting (~90°) (Mansour et al., 1998).
Fig. 1.
Typical μCT slices (A) of ex vivo rabbit knees (right knee shown) with 0.05 (B, C), 0.25 (D, E), or 0.95 mL (F, G) injected fluid volume in transverse (B, D, F) or longitudinal (C, E, G) sections at 60° flexion.
As a more physiological comparison to the ex vivo data, fluid was also localized in in vivo rabbit knees using plain X-rays. Six rabbits were anesthetized and one knee (3 right, 3 left) received a 0.95 mL injection of contrast agent. Frontal and anteroposterior (AP) plain X-rays were taken at 30, 60, and 90° flexion and the % fluid area in the medial vs. lateral and anterior vs. posterior joint spaces was assessed and compared to the μCT data.
Plane strains in the joint capsule during flexion were determined from marker locations in ex vivo rabbit knees. Principal strains for 30–60°, 60–90°, and 30–90° flexions were determined in (n=6) rabbit knees (3 right, 3 left) by creating triads of radio-opaque fiducial markers using stainless steel suture and tracking their relative motion after scanning the joints with contrast-enhanced μCT at 30, 60, and 90° flexion. Principal strains were calculated from the relative changes in the triad coordinates in the proximal–distal and circumferential directions as defined by the long axis of the femur.
2.2. Animal use, tissue harvest, and storage
All animal protocols for these studies were approved by the local IACUC committee. For the in vivo experiments, New Zealand white rabbits (~4.5 kg) were anesthetized, contrast agent was injected into one knee, X-rays were taken at 3 different flexion angles, and then the rabbit was euthanized. For the ex vivo experiments, the hind limbs of similar rabbits being euthanized for other purposes were obtained immediately after euthanasia by removing the skin, transecting the muscle and soft tissue near the greater trochanter of the femur, dislocating the hip, and storing at −80 °C until use.
2.3. μCT and X-ray imaging
Contrast-enhanced μCT and X-ray imaging were performed to determine fluid volumes and areas. Phosphate-buffered saline with 60% barium sulfate (Sigma-Aldrich Co., Saint Louis, MO) was used as the contrast agent, analogous to that used clinically. Volumes of contrast agent were injected into the joint space via 22 ga hypodermic needle through the patellar ligament. After injection, joints were gently flexed to distribute the contrast agent throughout the joint space.
Ex vivo rabbit hind limbs were thawed, trimmed, and imaged on a μCT scanner. Thawed limbs were trimmed by transecting mid-femur and mid-tibia without opening the joint capsule and keeping the musculature surrounding the capsule intact. Joints were scanned in air in a Skyscan 1076 μCT scanner (Skyscan, Kontich, Belgium) at 70 kV and (35 μm)3 voxel resolution. Full data sets were reconstructed with NRecon software (Skyscan) and thresholded above 80 grayscale to select only the contrast media, as its attenuation was much larger than bone. Data sets were divided into volumes of interest corresponding to the compartment quadrants, as above. The volume of contrast agent in each quadrant was determined using CTAn (Skyscan), and volumes were also normalized to the total volume in each knee to determine relative volume (%).
The hind limbs of anesthetized rabbits were imaged in vivo using plain X-rays and analyzed for fluid movement with flexion in 2D. AP and frontal views of the knee were taken using direct digital radiography CCD imaging at 52 kV, 10 mA s, and 356 dpi (NAOMI-DR, RF Co., Nagano, Japan). X-ray images were locally thresholded using CTAn software, with the threshold level set as the minimum grayscale value between the contrast agent and bone peaks in a grayscale histogram made from the region of interest surrounding the knee. The fluid areas in the anterior and posterior (on the AP views, divided as in Fig. 1C) and medial and lateral (on the frontal views, divided through the patellofemoral groove as in Fig. 1A and B) regions were determined and normalized as % of the total fluid area detected for each view. Virtual X-ray images in the AP and frontal views, directly analogous to the X-ray data, were constructed from the μCT data sets by collapsing all the 3D set slices to a single 2D plane using a custom Matlab program. Virtual X-ray images were analyzed as described above for X-ray images.
2.4. Strain analysis
Fiducial markers were created on the joint capsule of ex vivo rabbit knees before scanning at different flexion angles. The joint space was injected with 0.95 mL of contrast agent, and nine lengths of stainless steel 5-0 suture (Med-Vet International, Mettawa, IL) were stitched through the joint capsule: 3 proximal to the patella, 3 in the central patellar region, and 3 distal to the patella. The 9 sutures entered on one side of the capsule and exited on the far side, creating 18 radio-opaque fiducial markers on the joint capsule where the sutures intersected the contrast agent, grouped as triads in 6 locations around the patella. Joints were then scanned, as before, at 30, 60, and 90° flexion and reconstructed in NRecon. The coordinates of each fiducial marker were recorded for all scans in DataViewer (Skyscan). In addition, a vector pointing proximal–distal along the centroid of the femur axis deep to each triad was defined from two points along the femur axis.
Principal strains in the joint capsule for 30–60°, 60–90°, and 30–90° flexions were calculated from the relative change in fiducial marker coordinates. A change of basis was performed to map the triad locations from the arbitrary scanner coordinates to a coordinate system for each triad within the plane of the tissue, as defined by the normal vector to the triad plane, the orthogonal projection of the proximal–distal vector on the triad plane, and their cross-product, pointing in the circumferential direction towards the patella. The two-dimensional components of Green’s strain Eij were calculated from
| (1) |
where is a squared segment length of the triad in the reference configuration, and ds2 is the squared length in the deformed configuration (Fung and Tong, 2001). Principal strains and the angle of the principal axes were calculated from the Green’s strain components.
2.5. μCT and X-ray measurement precision
The precision of the μCT data and X-ray measurement methods were determined by 3 repeated scans and analysis of rabbit knees with contrast agents. For the μCT data, the average measured standard deviation (SD) in fluid area from virtual X-ray reconstructions was 1.2%. The average SD in volume determined from the reconstruction data was < 1 μL (0.4%) for repeated scans of 0.25 mL volumes. Fluid volume loss due to leakage from the joint space was not detectable at 0.05 or 0.25 mL, and a loss rate of approximately 1 μL/min was determined for the 0.95 mL volume, leading to an estimated loss of ~45 μL (~4.7%) over the course of the 3 experimental μCT scans at that volume. The average SD in fiducial marker location between repeated scans was 73 μm (~3.4%), indicating relative stability of the sutures, since the average measured distance between markers to determine strain was 2160 μm. For the X-ray data, the average SD in fluid area was 3.6%.
2.6. Statistical analysis
Data are expressed as mean ±SEM, values of P < 0.05 were considered significant. Measured volume was compared to injected volume and over flexion angles by linear regression. Repeated measures ANOVAs were used to assess the effects of injected volume and flexion angle on quadrant volumes with Bonferroni-corrected post-hoc tests. 2-way ANOVAs were used to assess the effect of side with injection volume and flexion angle. 1-way ANOVAs were used to assess the effect of flexion angle on % anterior and medial fluid detection with Tukey post-hoc tests. 3-way ANOVAs were used to assess the effects of axis, side, and triad location on strain values. Percentile data were arcsine transformed for normality. Statistical analyses were performed using Systat 10.2 (Systat Software Inc., Chicago, IL).
3. Results
3.1. Fluid distribution
Fluid volume was found mostly in the anterior compartment at all injection volumes. The attenuation of the contrast agent was higher than bone, allowing for clear distinction between the fluid space and bone, as seen in typical transverse and longitudinal μCT slices of joints scanned at 60° flexion (Fig. 1B–G). Qualitatively, fluid volume increased with injection volume at 60° flexion, and the majority of fluid volume was in the anterior compartment, though the relative amount in the posterior compartment increased at higher volumes (Fig. 1D–G).
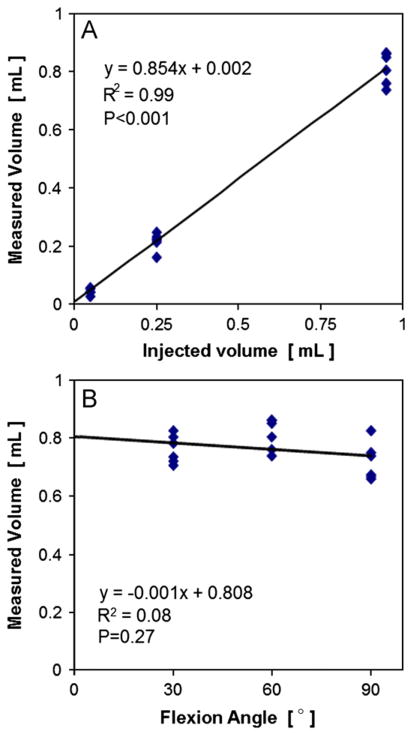
Detected fluid volume scaled linearly with injection volume and volume was not detectably lost during scans at multiple flexion angles. The fluid volume detected was a high proportion (85%) of the total injected volume (P < 0.001), and the injected and detected volumes were highly correlated (R2=0.99, Fig. 2A). The fluid volume detected for the 0.95 mL injection volume remained constant after successive scans at different flexion angles (P=0.27, Fig. 2B).
Fig. 2.
Relationship between joint space volume, injected volume, and knee flexion angle. Measured volume vs. (A) injected volume and (B) flexion angle. Mean±SEM, n=18.
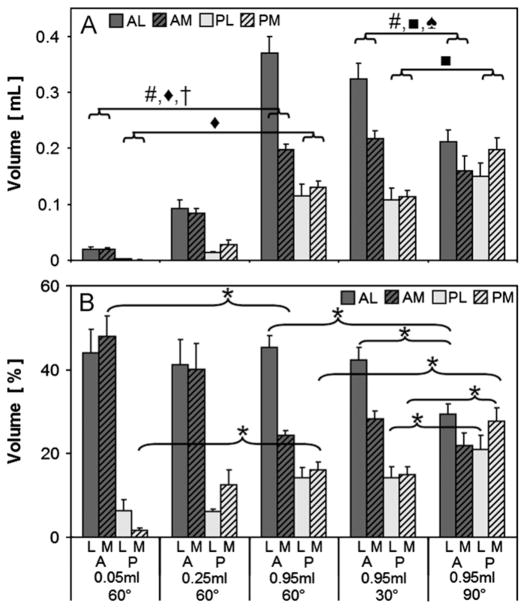
Quantification of absolute and relative volumes in each compartment mirrored the trends observed qualitatively. The precision of the measured fluid volumes was 0.4% ( < 1 μL of 250 injected), adequate for the range of recovered volumes, which accounted for 2–40%, 6–37%, and 11–39% of that injected (50, 250, and 950 μL, respectively). With increasing injection volume, side (medial vs. lateral, P < 0.0001), injection volume (P < 0.0001), and the interaction side*injection volume (P < 0.0001) affected detected volume in the anterior compartment, and injection volume (P < 0.0001) affected detected volume in the lateral compartment (Fig. 3A). All in-quadrant measured volumes (0.05 vs. 0.25 vs. 0.95 mL) were significantly different from each other (P < 0.001). The fluid volume % decreased in the anterior medial and increased in the posterior medial quadrants between 0.05 mL and 0.95 mL injections (P < 0.05, Fig. 3B).
Fig. 3.
Measured volume (A) and % volume (B) by compartment for 3 injection volumes (0.05, 0.25, and 0.95 mL) and 3 flexion angles (60°, 30°, 90°) A: anterior, P: posterior, M: medial, L: lateral. * P < 0.05. #, ◆, †, ■, ♠: P < 0.0001 effect for side (#), injection volume (◆), side*injection volume (†), flexion (■), and side*flexion (♠). All in-quadrant measured volume comparisons (0.05 vs. 0.25 vs. 0.95 mL) were significantly different from each other (not shown in symbols, P < 0.001).
Fluid shifted from the anterior lateral to the posterior compartments at higher flexion angles. With increasing flexion, side (P < 0.0001), flexion angle (P < 0.0001), and side*flexion (P < 0.0001) affected detected volume in the anterior compartment, and flexion (P < 0.0001) affected detected volume in the posterior compartment (Fig. 3A). At 30° and 60° flexion, fluid volume was localized primarily in the anterior lateral quadrant; with flexion to 90°, fluid shifted to the posterior lateral and medial quadrants (P < 0.05, Fig. 3A and B). The posterior shift of fluid volume with flexion angle was also observed in 3D volume renderings, which show the geometry of the joint space (Fig. 4).
Fig. 4.
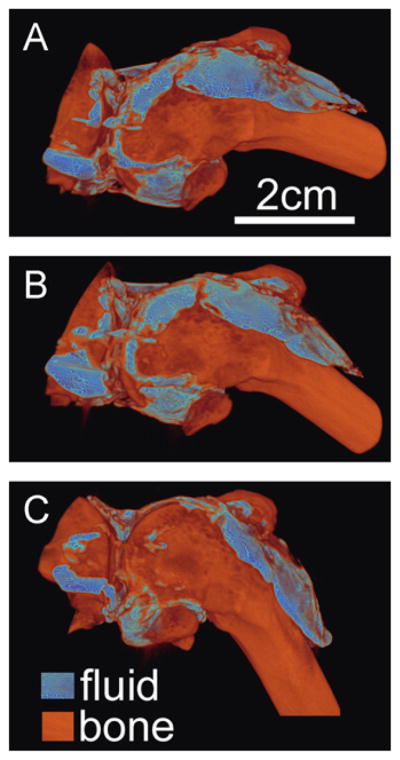
Typical volume rendering of fluid and bone at 3 joint flexion angles (A) 30°, (B) 60°, and (C) 90° after 0.95 mL fluid injection.
3.2. Ex vivo and in vivo fluid localization
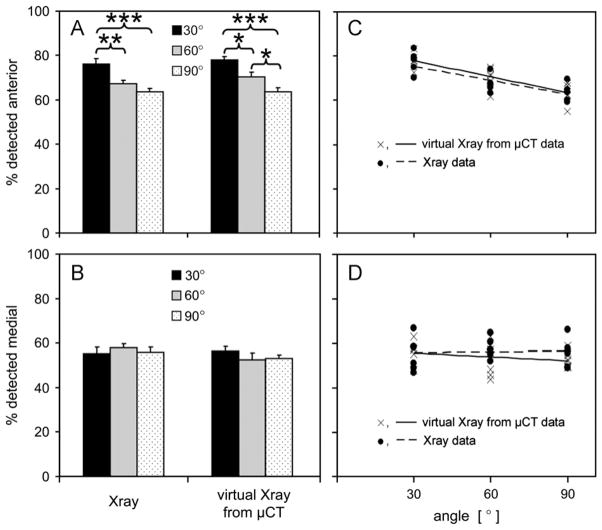
The effects of flexion angle on % fluid area detected by virtual X-rays from ex vivo μCT data correlated well with that detected on digital X-rays of in vivo rabbit knees. The precision of measured % fluid areas was 1.2% by μCT and 3.6% by X-ray, substantially less than the range of measured areas (48–83%). Flexion angle significantly affected the % fluid detected in the anterior region assessed by X-ray (P < 0.001) and μCT (P < 0.001, Fig. 5A). Flexion angle did not affect the % fluid detected in the medial region assessed by μCT (P=0.34) or X-ray (P=0.67, Fig. 5B). The slopes of the regression lines through the individual X-ray and μCT data sets in the anterior compartment were significant (P < 0.001 and P < 0.0001, respectively), and not different than each other (P=0.99, Fig. 5C). In the medial compartment, the slopes were not significant (P=0.86 and P=0.30, respectively), and not different than each other (P=0.38, Fig. 5D).
Fig. 5.
Fluid detected in the (A) anterior and (B) medial compartments as a % of the total detected, assessed by virtual X-rays from μCT data for ex vivo joints and with lateral and AP X-rays of in vivo rabbit knees, and correlations showing similar flexion effects from both methods in the anterior compartment (C) and no effects in the medial compartment (D). The slopes of the regression lines through the X-ray and μCT data were each individually significant (P < 0.001, P < 0.0001) and not different than each other (P=0.99) in the anterior compartment, and not significant (P=0.86, P=0.30) in the medial compartment. *P < 0.05, **P < 0.01, ***P < 0.001.
3.3. Joint capsule strain with flexion
The joint capsule, relative to the 30° strain state, stretched in the proximal–distal direction and shortened in the circumferential direction with flexion. The precision of strain determination was 3.4%, substantially less than the range of experimental strains (15–178%). Strain was evaluated at 6 locations around the patella (Figs. 6 and 7A–C) and primarily occurred along the proximal–distal axis. For flexion from 30 to 60°, axis (P1 vs. P2, P < 0.0001) and location (proximal vs. central vs. distal, P < 0.05) significantly affected strain values, with P1 positive and larger in magnitude than P2, which were negative (Fig. 7B and D). Strain magnitudes tended to be larger in the distal than proximal regions (P < 0.05), and there was a trend for an effect of side (medial vs. lateral, P=0.08). For flexion from 60 to 90°, axis (P < 0.0001) significantly affected the strain values, (Fig. 7C and E) though side was not significant (P=0.35). Similarly, for flexion from 30 to 90°, axis (P < 0.0001) significantly affected the strain values (Fig. 7F), and side was not significant (P=0.99).
Fig. 6.
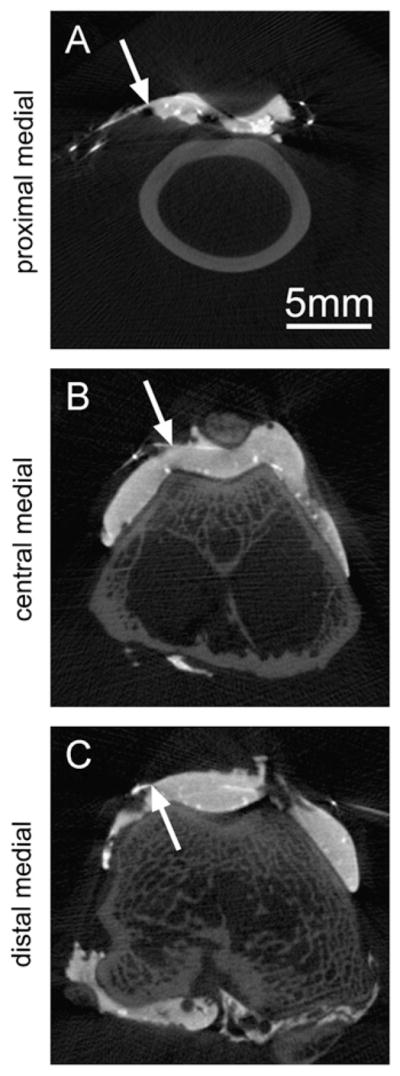
Example transverse slices showing the radio-opaque fiducial marker locations on the joint capsule as the intersections of the steel suture and contrast agent in the 3 medial regions analyzed.
Fig. 7.
Joint capsule strain in ex vivo rabbit knees at (A) 6 locations, with principal strains and directions depicted as vectors at those locations (B, C). Detailed principal strains (P1 and P2) and principal axis angle (θ) for (D) 30–60°, (E) 60–90°, and (F) 30–90° flexions. There were significant effects of principal axis (P1 vs. P2) and location (proximal vs. central vs. distal patellar) on strain values. *P < 0.05, ***P < 0.0001.
4. Discussion
These results demonstrate that during knee flexion, joint fluid moves posteriorly and the joint capsule is variably strained based on location. Fluid volume in the knee, as observed by contrast enhanced μCT (Figs. 1 and 2), pools mainly in the anterior (supra-and latero-patellar) bursae, increasing more in the anterior lateral compared to medial sides with increasing volume (Fig. 3). With increasing joint flexion, fluid volume moves from the anterior to the posterior bursae (Figs. 3 and 4), which was also found in the in vivo joints (Fig. 5). Planar joint capsule strains indicated stretch in the proximal–distal direction and shortening in the circumferential direction with flexion from the 30° strain state (Fig. 7), which may be responsible for the movement of fluid.
Volume shifts and capsule strains reported here were determined ex vivo, which may differ from an in vivo joint. For ex vivo joints, the contrast enhanced imaging methods resulted in detection of < 100% (85%, Fig. 2) of the injected volume, likely due to minor fluid loss through the synovial lining. The inactive musculature surrounding the joint and loss of tension in the quadriceps tendon in ex vivo samples may have affected the measurements made. In addition, the capsule strains were determined after injection of fluid, mimicking an inflamed joint, likely resulting in the strain estimates being larger than would be present for a normal joint. However, the trends in the ex vivo % fluid data correlate well with analogous in vivo imaging data. With only one small difference between the μCT and X-ray data (Fig. 5A), suggesting that the μCT data may be more sensitive than the X-ray data, the ex vivo samples appear to be reasonable approximations of the in vivo situation. The use of different groups of animals for the two methods illustrates the trends are not animal-specific, and points to their robustness despite inter-animal variability.
The movement and mixing of SF volume with flexion are likely important determinants of the mechanical and biological fluid environment within the knee joint. Increasing flexion angle from 30 to 90° shifts ~20% of the anterior volume to the posterior compartments. This shift in fluid towards the posterior bursae with flexion is consistent with a qualitative description of joint fluid motion in human knees seen via X-ray after injection of 3–4 mL of contrast agent (Menschik, 1976). Such SF mixing is important for nutrient transport from synovium to cartilage (Levick, 1984), lubricant distribution, and movement of cytokines and cellular signaling molecules throughout the joint. Joint capsule strain and posterior fluid motion may also contribute to pain via intra-articular pressure and capsule strain during flexion.
The anisotropy and Poisson’s ratio of joint capsule strains are consistent with the mechanical properties of tendon, the tissue from which the capsule is derived. Tendons are highly anisotropic, with a larger modulus in the fiber-aligned compared to transverse direction, and an average Poisson’s ratio of ~0.5 in the transverse direction (Lynch et al., 2003). Similarly, the principal strains in the joint capsule were also larger overall in the proximal–distal direction, which is the fiber-aligned direction for the quadriceps tendon, than in the transverse direction. Further, the strains were negative in the transverse direction, indicating circumferential shortening, corresponding to a Poisson’s ratio of ~0.4 for the joint capsule.
The strains reported here are for the relative change in capsule tissue between flexion angles, which may be different than the absolute strain state as defined by changes from a completely unloaded condition. The capsule tissue deforms during both flexion and extension, making defining an unloaded, laxity-free state difficult. The strains are reported for increasing flexion angles since joint fluid appears to move from anterior to posterior with flexion, suggesting a reduction in anterior bursae volume, which is consistent with anterior capsule lengthening and circumferential shortening.
Joint capsule strains and fluid movement likely alter synovial cell biology, as well as the fluid and macromolecular transport across synovium. Since HA secretion by synoviocytes is mechanosensitive (Momberger et al., 2005; Ingram et al., 2008), the fluid volume shifts and capsule strains during flexion may contribute to the regulation of lubricant secretion. The synovium layer is a thin ~20–50 μm (Castor, 1960; Simkin, 1991; Stevens et al., 1991), disorganized extracellular matrix (Levick, 1995; Revell et al., 1995; Price et al., 1996) probably with compliant mechanical properties. The thicker and more fibrous joint capsule, to which synovium is attached, likely determines its mechanical state. However, the translation of strain from capsule to synovium is complicated as the synovium layer is not completely flat, it contains villi and fringe-like folds. Under strain, the synovium layer probably undergoes a complex mixture of unfolding and strain based on local microstructure (Fig. 8). Thus, although the capsule strains are important determinants of the local strains felt by synoviocytes, analysis of local microstructural deformations would facilitate understanding how the macroscopic capsule strain translates to local cellular deformations. In addition to cellular responses, fluid and macromolecular transport across synovium from the vasculature and to the lymphatics are likely altered by joint capsule and synovium strain due to changes in the synovium layer thickness and extracellular matrix fiber density.
Fig. 8.
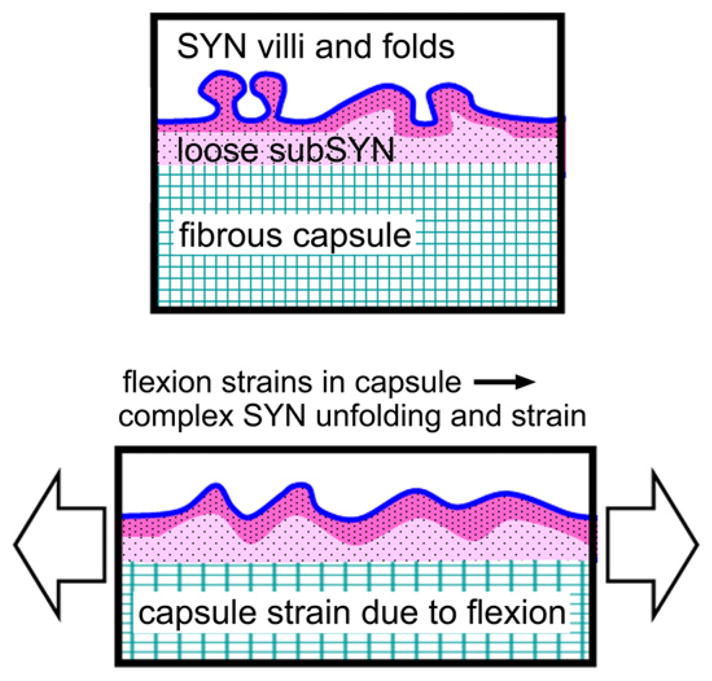
Schematic depicting structural deformation due to strain in the joint capsule tissue translating through the loose connective layer, subsynovium (subSYN), to a complex mixture of synovium (SYN) unfolding and strain, leading to synoviocyte deformation determined by local microstructure.
The approach of assessing fluid volume movement and tissue strain with radio-opaque contrast and μCT may be useful for a variety of experimental studies. Examination of fluid movement and capsular strains in other joints than the knee, such as the hip and shoulder, use of various contrast agents, and in various models of arthritis may be of clinical interest. In addition, following and quantifying the movement of meniscus, muscle, tendon, and ligaments during joint articulation may be possible.
Acknowledgments
The authors would like to thank Esther Cory Burak and Elise F. Morgan for their helpful discussions.
This work was supported by Grants from the National Institute of Arthritis, Musculoskeletal and Skin Diseases, a Ruth L. Kirschstein National Research Service Award predoctoral fellowship from the National Institute on Aging (for WJM), and an award to UCSD from the Howard Hughes Medical Institute through the HHMI Professors Program (for RLS).
Footnotes
Conflict of interest statement
The authors have no professional or financial conflicts of interest to disclose.
References
- Balazs EA. The physical properties of synovial fluid and the special role of hyaluronic acid. In: Helfet AJ, editor. Disorders of the Knee. Philadelphia: Lippincott Co; 1974. pp. 63–75. [Google Scholar]
- Castor CW. The microscopic structure of normal human synovial tissue. Arthritis and Rheumatism. 1960;3:140–151. doi: 10.1002/art.1780030205. [DOI] [PubMed] [Google Scholar]
- Chang DG, Iverson EP, Schinagl RM, Sonoda M, Amiel D, Coutts RD, Sah RL. Quantitation and localization of cartilage degeneration following the induction of osteoarthritis in the rabbit knee. Osteoarthritis and Cartilage. 1997;5:357–372. doi: 10.1016/s1063-4584(97)80039-8. [DOI] [PubMed] [Google Scholar]
- Choi SI, Heo TR, Min BH, Cui JH, Choi BH, Park SR. Alleviation of osteoarthritis by calycosin-7-O-beta-D-glucopyranoside (CG) isolated from Astragali radix (AR) in rabbit osteoarthritis (OA) model. Osteoarthritis and Cartilage. 2007;15:1086–1092. doi: 10.1016/j.joca.2007.02.015. [DOI] [PubMed] [Google Scholar]
- Coleman PJ, Scott D, Ray J, Mason RM, Levick JR. Hyaluronan secretion into the synovial cavity of rabbit knees and comparison with albumin turnover. Journal of Physiology. 1997;503(3):645–656. doi: 10.1111/j.1469-7793.1997.645bg.x. [DOI] [PMC free article] [PubMed] [Google Scholar]
- Dahl LB, Dahl IM, Engstrom-Laurent A, Granath K. Concentration and molecular weight of sodium hyaluronate in synovial fluid from patients with rheumatoid arthritis and other arthropathies. Annals of Rheumatic Diseases. 1985;44:817–822. doi: 10.1136/ard.44.12.817. [DOI] [PMC free article] [PubMed] [Google Scholar]
- Delecrin J, Oka M, Takahashi S, Yamamuro T, Nakamura T. Changes in joint fluid after total arthroplasty. A quantitative study on the rabbit knee joint. Clinical Orthopaedics and Related Research. 1994:240–249. [PubMed] [Google Scholar]
- Eyring EJ, Murray WR. The effect of joint position on the pressure of intra-articular effusion. Journal of Bone and Joint Surgery American. 1964;46:1235–1241. [PubMed] [Google Scholar]
- Fung YC, Tong P. Classical and Computational Solid Mechanics. World Scientific Publishing Company; Singapore: 2001. [Google Scholar]
- Gray H. In: Anatomy of the Human Body. Lewis WH, editor. Lea & Febiger; Philadelphia: 1918. [Google Scholar]
- Gushue DL, Houck J, Lerner AL. Rabbit knee joint biomechanics: motion analysis and modeling of forces during hopping. Journal of Orthopaedic Research. 2005;23:735–742. doi: 10.1016/j.orthres.2005.01.005. [DOI] [PubMed] [Google Scholar]
- Ingram KR, Wann AK, Angel CK, Coleman PJ, Levick JR. Cyclic movement stimulates hyaluronan secretion into the synovial cavity of rabbit joints. Journal of Physiology. 2008;586:1715–1729. doi: 10.1113/jphysiol.2007.146753. [DOI] [PMC free article] [PubMed] [Google Scholar]
- Jayson MI, Dixon AS. Intra-articular pressure in rheumatoid arthritis of the knee. 3. Pressure changes during joint use. Annals of Rheumatic Diseases. 1970;29:401–408. doi: 10.1136/ard.29.4.401. [DOI] [PMC free article] [PubMed] [Google Scholar]
- Johnson CD, Chen MH, Toledano AY, Heiken JP, Dachman A, Kuo MD, Menias CO, Siewert B, Cheema JI, Obregon RG, Fidler JL, Zimmerman P, Horton KM, Coakley K, Iyer RB, Hara AK, Halvorsen RA, Jr, Casola G, Yee J, Herman BA, Burgart LJ, Limburg PJ. Accuracy of CT colonography for detection of large adenomas and cancers. New England Journal of Medicine. 2008;359:1207–1217. doi: 10.1056/NEJMoa0800996. [DOI] [PMC free article] [PubMed] [Google Scholar]
- Levick JR. Blood flow and mass transport in synovial joints. In: Renkin EM, Michel CC, editors. Handbook of Physiology, Section 2, The Cariovascular System, Volume IV, The Microcirculation. Chapter 19 The American Physiological Society; Bethesda: 1984. pp. 917–947. [Google Scholar]
- Levick JR. Microvascular architecture and exchange in synovial joints. Microcirculation. 1995;2:217–233. doi: 10.3109/10739689509146768. [DOI] [PubMed] [Google Scholar]
- Lu Y, Chen C, Kallakuri S, Patwardhan A, Cavanaugh JM. Neurophysiological and biomechanical characterization of goat cervical facet joint capsules. Journal of Orthopaedic Research. 2005;23:779–787. doi: 10.1016/j.orthres.2005.01.002. [DOI] [PubMed] [Google Scholar]
- Lynch HA, Johannessen W, Wu JP, Jawa A, Elliott DM. Effect of fiber orientation and strain rate on the nonlinear uniaxial tensile material properties of tendon. Journal of Biomechanical Engineering. 2003;125:726–731. doi: 10.1115/1.1614819. [DOI] [PubMed] [Google Scholar]
- Mansour JM, Wentorf FA, Degoede KM. In vivo kinematics of the rabbit knee in unstable models of osteoarthrosis. Annals of Biomedical Engineering. 1998;26:353–360. doi: 10.1114/1.133. [DOI] [PubMed] [Google Scholar]
- Matsuzaka S, Sato S, Miyauchi S. Estimation of joint fluid volume in the knee joint of rabbits by measuring the endogenous calcium concentration. Clinical and Experimental Rheumatology. 2002;20:531–534. [PubMed] [Google Scholar]
- Mazzucco D, Scott R, Spector M. Composition of joint fluid in patients undergoing total knee replacement and revision arthroplasty: correlation with flow properties. Biomaterials. 2004;25:4433–4445. doi: 10.1016/j.biomaterials.2003.11.023. [DOI] [PubMed] [Google Scholar]
- McDonald JN, Levick JR. Morphology of surface synoviocytes in situ at normal and raised joint pressure, studied by scanning electron microscopy. Annals of Rheumatic Diseases. 1988;47:232–240. doi: 10.1136/ard.47.3.232. [DOI] [PMC free article] [PubMed] [Google Scholar]
- Menschik A. Die Synoviapumpe des Kniegelenkes. Zeitschrift fur Orthopadie und ihre Grenzgebiete. 1976;114:89–94. [PubMed] [Google Scholar]
- Momberger TS, Levick JR, Mason RM. Hyaluronan secretion by synoviocytes is mechanosensitive. Matrix Biology. 2005;24:510–519. doi: 10.1016/j.matbio.2005.08.006. [DOI] [PMC free article] [PubMed] [Google Scholar]
- Ott DJ, Gelfand DW. Gastrointestinal contrast agents. Indications, uses, and risks. Journal of the American Medical Association. 1983;249:2380–2384. [PubMed] [Google Scholar]
- Price FM, Levick JR, Mason RM. Glycosaminoglycan concentration in synovium and other tissues of rabbit knee in relation to synovial hydraulic resistance. Journal of Physiology (London) 1996;495:803–820. doi: 10.1113/jphysiol.1996.sp021634. [DOI] [PMC free article] [PubMed] [Google Scholar]
- Revell PA, al-Saffar N, Fish S, Osei D. Extracellular matrix of the synovial intimal cell layer. Annals of Rheumatic Diseases. 1995;54:404–407. doi: 10.1136/ard.54.5.404. [DOI] [PMC free article] [PubMed] [Google Scholar]
- Sah RL, Yang AS, Chen AC, Hant JJ, Halili RB, Yoshioka M, Amiel D, Coutts RD. Physical properties of rabbit articular cartilage after transection of the anterior cruciate ligament. Journal of Orthopaedic Research. 1997;15:197–203. doi: 10.1002/jor.1100150207. [DOI] [PubMed] [Google Scholar]
- Schmidt TA, Gastelum NS, Nguyen QT, Schumacher BL, Sah RL. Boundary lubrication of articular cartilage: role of synovial fluid constituents. Arthritis and Rheumatism. 2007;56:882–891. doi: 10.1002/art.22446. [DOI] [PubMed] [Google Scholar]
- Simkin PA. Physiology of normal and abnormal synovium. Seminars in Arthritis and Rheumatism. 1991;21:179–183. doi: 10.1016/0049-0172(91)90007-m. [DOI] [PubMed] [Google Scholar]
- Smith MM, Ghosh P. The synthesis of hyaluronic acid by human synovial fibroblasts is influenced by the nature of the hyaluronate in the extracellular environment. Rheumatology International. 1987;7:113–122. doi: 10.1007/BF00270463. [DOI] [PubMed] [Google Scholar]
- Stevens CR, Blake DR, Merry P, Revell PA, Levick JR. A comparative study by morphometry of the microvasculature in normal and rheumatoid synovium. Arthritis and Rheumatism. 1991;34:1508–1513. doi: 10.1002/art.1780341206. [DOI] [PubMed] [Google Scholar]
- Woo SL, Hollis JM, Roux RD, Gomez MA, Inoue M, Kleiner JB, Akeson WH. Effects of knee flexion on the structural properties of the rabbit femur-anterior cruciate ligament-tibia complex (FATC) Journal of Biomechanics. 1987;20:557–563. doi: 10.1016/0021-9290(87)90277-6. [DOI] [PubMed] [Google Scholar]
- Yoshioka M, Coutts RD, Amiel D, Hacker SA. Characterization of a model of osteoarthritis in the rabbit knee. Osteoarthritis and Cartilage. 1996;4:87–98. doi: 10.1016/s1063-4584(05)80318-8. [DOI] [PubMed] [Google Scholar]


