

Summary
Most neurons in area MT (V5) are strongly direction selective [1–4], and their activity is closely associated with the perception of visual motion [reviewed in 5]. These neurons have large receptive fields, built by combining inputs with smaller receptive fields that respond to local motion [6]. Humans integrate motion over large areas and can perceive what has been referred to as global motion. The large size and direction selectivity of MT receptive fields suggests that MT neurons may represent global motion. We have explored this possibility by measuring responses to a stimulus in which the directions of simultaneously presented local and global motion are independently controlled. Surprisingly, MT responses depended only on the local motion, and were unaffected by the global motion. Yet, under similar conditions, human observers perceive global motion, and are impaired in discriminating local motion. While local motion perception might depend on MT signals, global motion perception depends on mechanisms qualitatively different from those in MT. Motion perception therefore does not depend on a single cortical area, but reflects the action and interaction of multiple brain systems.
Keywords: vision, visual motion, apparent motion, extrastriate cortex, MT, V5, psychophysics
Results
Our stimuli were made from multiple local-motion “pulses”. Each pulse was a small, brief, spatially and temporally band-limited target, containing motion in one of two directions (Figure 1A, Movie S1). The motion of these targets is encoded by local or “short-range” motion sensors, like those in primary visual cortex [7]. We created global motion by chaining these pulses together, suitably separated in space and time to create “long-range” apparent motion [8]. Our experiments compared perceptual and physiological responses to motion conditions in which the short-range (local) and long-range (global) elements of the stimuli moved in the same or in opposite directions [9–12]. In our physiological experiments, we characterized the receptive fields of isolated MT neurons using conventional methods, and then chose stimulus parameters so that the spatiotemporal frequency content of the pulses was in a favorable range for the neuron, and their spacing placed five or more pulses within the classical excitatory receptive field.
Figure 1. The responses of MT neurons to local and global motion.
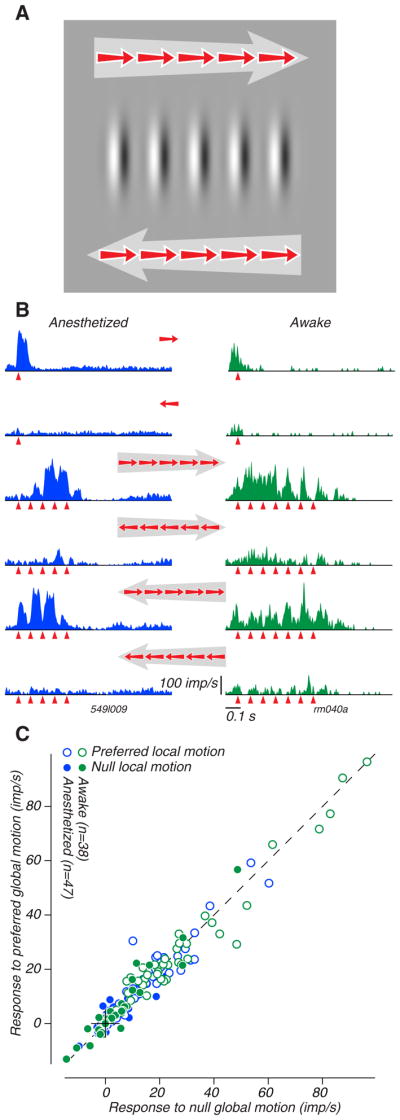
A. A cartoon of our local-global motion stimulus. In this example, five pulses of local motion, each drifting to the right, are presented in sequence from left to right or right to left; the large arrows indicate the direction of global motion, the small arrows indicate the direction of local motion. In our physiology experiments, these directions were arranged to correspond to the preferred and null directions for each neuron under study, and represent two of the four possible directional combinations of local and global motion. B. Response histograms for two MT neurons, one recorded in an anesthetized macaque at New York University (left in blue) and the other in an awake macaque at Stanford (right in green). The rows contain data from different stimulus conditions: the top two rows show responses to single local motion pulses presented in the center of the receptive field, and the bottom four rows show responses to the combinations of local and global motions indicated by the small red and large gray arrows. The red triangles indicate the timing of each local pulse (5 for the neuron on the left, 7 for the neuron on the right). C. A comparison of the responses of 85 MT neurons (47 from anesthetized macaques (blue symbols) and 38 from awake macaques (green symbols)) to stimuli containing preferred local motion (open) and null local motion (filled) when the global motions were in the null and preferred directions.
Isolated single motion pulses presented in the center of the receptive field generally evoked brisk, directionally selective responses (Figure 1B, top two rows). We presented stimuli containing these local and global motions in both the preferred and null directions, so that all four combinations of local and global motion were shown. For two typical neurons (Figure 1B, bottom four rows), all stimuli containing local motion in a neuron’s preferred direction evoked similar responses, regardless of the direction of global motion. All stimuli containing local motion in the neuron’s null direction were ineffective, regardless of the direction of global motion. To ask whether MT responses were determined by the local directional content of the stimulus, we compared responses having the same local motion but opposing global motions (Figure 1C). The direction of global motion had no systematic influence on the strong responses typically evoked by preferred local motion (Figure 1C, open symbols), or on the typical weak or suppressed responses to null local motion (Figure 1C, filled symbols).
We computed directional indices (DI’s) separately for the local motions (averaged across all global motion conditions; Figure 2, marginal distribution on the abscissa) and the global motions (averaged across all local motion conditions; Figure 2, marginal distribution on the ordinate). The distribution of “local DI” centers near 0.9, reflecting the prevalence of directional selectivity for local motion. The distribution of “global DI” centers near 0, reflecting the general lack of selectivity for global motion. Comparing the local DI and global DI for 85 neurons reveals no particular relationship (r = 0.02, P = 0.86) (Figure 2, scatter plot). To capture the combined local and global selectivity of each neuron, we subtracted the global DI from the local DI to compute a quantity we call “local dominance”. This value would be 1.0 for a neuron perfectly selective for local motion and indifferent to global motion, and −1.0 for a neuron with opposite selectivities. Nearly all local dominance values were positive, suggesting that the responses of the MT neurons we studied were determined almost entirely by the local motion and were insensitive to the global motion (Figure 2, oblique marginal distribution). The values for the neurons whose data are shown in Figure 1B are highlighted in red; their difference values were 0.89 and 0.59 respectively. The lower value for the neuron from the awake recording is not due to global motion selectivity, but rather to the neuron’s imperfect local motion selectivity (Figure 1B, top two traces).
Figure 2. A comparison of directional selectivity for local and global components of motion.

Local DI values are plotted against global DI values for 85 MT neurons. Data from anesthetized monkeys in blue; from awake monkeys, in green. The marginal distributions on the ordinate and abscissa capture the directional selectivity for the global and local motions, respectively. The mean and standard error of local DI was 0.90±0.05 for anesthetized recordings and 0.88±0.05 for awake recordings. For global DI, the values were 0.04±0.05 for anesthetized recordings and −0.05±0.05 for awake recordings. The oblique marginal distribution is of the difference between local and global DI, which we term “local dominance”. The mean and standard error of local dominance was (0.85±0.06) for anesthetized recordings and (0.92±0.08) for awake recordings. The values for the neurons whose data are shown in Figure 1B are highlighted in red; their local dominance values were 0.89 and 0.59 respectively.
The distribution of local dominance centers below 1.0, which might suggest a consistent, if weak, global motion preference. Examination of the scatter diagram in Figure 2 reveals, however, that this value is attributable to neurons that were not completely selective for local motion. This can also be seen by inspecting the responses of the two example neurons in Figure 1B to isolated local pulses (top two histograms): the neuron on the left was strongly selective for these pulses, while the one on the right was markedly less so; this difference is reflected in the responses to the compound stimuli shown in the other histograms in Figure 1B.
The data in Figures 1 and 2 were taken under conditions in which the speeds of local and global motion matched, but we explored a wide range of global motion speeds in many neurons, and observed the same pattern of results (Figure 3A). We also measured responses to a variant stimulus in which the local motion pulses were replaced with static flashed targets which had the same spatial structure but lacked motion, and were flashed on with the same time course as the local motion. The responses to these “global-motion-only” stimuli lacked direction selectivity both for this example (Figure 3B) and on average, demonstrating that global motion did not influence the response even when local motion signals were absent.
Figure 3. The responses of an MT neuron to local and global motion across a range of global speeds, and in the absence of local motion.

A. Response histograms for the MT neuron, shown in the left column of Figure 1B, over a range of global speeds. The rows show responses to combinations of local and global motions whose directions are indicated by the small red and large gray arrows (the preferred direction is marked as rightward). The columns show responses to different global speeds, which decrease from left to right. The leftmost column shows the condition when all local motion pulses (which moved at 26.8 deg/s) are presented simultaneously (an “infinite” global speed, or none). The red triangles indicate the offset of each local pulse. B. Response histograms for the same MT neuron, but for stimuli that do not contain local motion.
We made recordings from neurons with a wide range of receptive field locations (centered between 2 and 28 deg of the fovea), sizes (6–30 deg), preferred spatial frequencies (0.1–1.7 c/deg), and drift rates (0.7–5.7 Hz). The locations and sizes of receptive fields are shown schematically in Figure 4A. The receptive fields of neurons recorded from both anesthetized animals (in green) and awake animals (in blue) covered the contralateral field within 10 deg of the horizontal meridian from the center of gaze out to at least 20 deg. The distributions of preferred spatial frequency and drift rate for neurons recorded from anesthetized animals are shown in Figures 4B and C. We did not make the same tuning measurements in the awake animals, but we believe that the distributions were similar, based on responses measured during the search for the most effective Cauchy order and speed for the pulses We examined the correlations between local and global direction index, as well as the derived local dominance, with all the properties captured in these plots; none was significant.
Figure 4. Receptive field locations, sizes, and spatiotemporal frequency preferences for neurons in MT.

A. Semitransparent circles schematically show the positions and sizes of the receptive fields of the MT neurons recorded from anesthetized macaques (in blue) and from awake macaques (in green). The red ellipses indicate the positions of the five local motion pulses in our psychophysical experiments. B–C. The distributions of optimal spatial frequency, drift rate and speed for neurons recorded in anesthetized macaques. Yellow arrows indicate geometric means. The red asterisks indicate the values of each parameter used in psychophysical experiments.
These results show that the responses of MT neurons were determined entirely by the local motion content of our stimulus, and uninfluenced by its global motion. This was true for stimuli of a wide range of global speeds, and for recordings from both awake and anesthetized animals, though it should be noted that our stimulus design required that the pulses be separated by distances greater than those that elicit robust directional responses with conventional apparent motion stimuli in MT neurons [4, 13]. Under these conditions, MT neurons do not integrate motion information across their receptive fields, but behave instead as though they simply pool local motion signals wherever they originate within the receptive field [14].
What makes these physiological observations particularly interesting is that under identical viewing conditions, our perceptual experience is dominated by global motion, as can be seen in the supplementary videos. When the pulses are presented in isolation, local motion is easy to see (Movie S1), but when the same pulses are imbedded in a global motion sequence, they appear to move in the global direction regardless of their true local direction (Movie S2). When the local motion is opposite to the global motion, the stimulus sometimes appears “jumpy”, as if the motion were in discrete steps and not continuous, but the overall direction perceived was that of the global motion. This dissociation between our percept–dominated by global motion–and the neuronal responses in MT–dominated by local motion–stands in sharp contradistinction to the common view that the activity of neurons in MT is closely associated with our experience of motion [15]. We therefore decided to make psychophysical measurements to explore this dissociation between expected and actual perceptual experience.
Observers viewed global motion sequences of 5 elements arranged in a horizontal row 4 deg below the fixation point, and judged the local motion of the central pulse. Initially the stimuli were identical to those used in physiological experiments (Movie S2), with local motion in all five pulses. We then realized that observers might “peek” at the local motion signals in pulses other than the one in the center. Though none of our data indicated that any of our observers did this, we decided to remove this potential cue by replacing the flanking elements with pulses of the same spatial structure and duration, but without local motion. This change makes little difference to the percept of global motion (Movie S4). We chose the location, spatial and temporal frequencies for the local pulses, and the speeds of global motion, to fall within the range that was optimal for the neurons in our recordings; the values we chose are indicated in red on each part of Figure 4. The observers reported the direction of the local motion of the central patch (the only pulse with local motion); no feedback was given. We adjusted the durations of the local motion pulses for each observer to span a range over which individual performance ranged from near chance to near perfection, and measured the slope and intercept of the resulting psychometric functions to estimate motion thresholds and discrimination bias.
When the flanking and central patches were presented simultaneously, there was no global motion and subjects judged the motion of the central patch with reasonable accuracy and without bias (Figure 5A, thick lines). As in the physiological experiments, we created global motion by staggering the onset times of the pulses. Global motion influenced our observers’ judgments of local motion in two ways: it reduced their sensitivity to local motion, and often also biased observers so that they reported local motion in the direction of the global motion. Both effects can be seen in the example psychometric functions in Figure 5A. The sensitivity loss reduces the slope of the function, and the bias shifts the intercept with chance (the point of subjective equality) The average results for 7 subjects show both the threshold elevation and the bias evident from the individual functions, and further show that these effects were most pronounced when the speed of global motion matched the speed of local motion (Figures 5B and C).
Figure 5. The influence of global motion on judgments of local motion.

A. Psychometric functions for three observers judging the direction of local motion of a single pulse presented below fixation and flanked by four other pulses. The ordinate plots the proportion of trials on which the local motion was judged to be in the same direction as the global motion defined by the sequence of pulse presentations. The abscissa plots the duration of the local motion pulse, with negative “durations” assigned to pulses whose local motion was opposed to the global motion sequence. Thick lines show data collected in the absence of global motion (when all pulses were presented simultaneously). The slope of the psychometric function measures sensitivity to motion direction, and the intercepts are near 0, revealing that the observers had little bias to report one motion over the other. The data points connected by thin lines represent judgments when the global motion was at a speed matched to the local motion in each patch. For one observer (data in red) the effect of the global motion was to shift the psychometric function to the left, reflecting a change in the local motion that was equally often judged to be in the same or opposite direction as the global motion. For a second observer (data in blue), the effect of the global motion was to shallow the psychometric function, reflecting a reduction in sensitivity to variations in the strength of the local motion signal. For the third observer (data in green), both effects were evident. B, C. The effects of global motion on the slope of the psychometric functions (B, sensitivity) and on the shift in the point of subjective equality (C, bias) for 7 observers. The points with infinite abscissa values correspond to the condition in which all local pulses were presented simultaneously. The data are normalized for each observer by the standard deviation of the Gaussian whose integral describes the psychometric function measuring their discrimination performance in the absence of global motion. Note that for some conditions, one or the other measure could not be extracted (e.g., the subject whose data are in blue in Figure 5A did not have a measurable threshold in the global motion condition). The means shown are taken for the valid measurements at each speed.
Discussion
There is a striking contrast between our physiological results–showing that MT neurons signal only local motion–and our psychophysical results–showing that observers’ perceptual reports of local motion can be dominated by the global motion within which they are imbedded. This seems inconsistent with the view that our experience of directed motion derives directly and simply from the activity of directionally selective neurons in MT. How might this discrepancy be explained?
One speculation is that the signals supporting our percept of global motion might arise in a separate neural circuit containing neurons selective for the direction of global motion, and that our perceptual experience reflects the outcome of a competition between mechanisms sensitive to local and global motion. We found only local motion sensitivity in MT, and there is evidence that motion representation is also locally dominated in MST, MT’s main downstream target [16]. But there are many other areas in visual cortex, and in principle any of them might represent the global motion signal. Evidence that two competing systems are involved comes from the suppression and capture of local motion percepts by global motion (Figure 5). We have demonstrated informally that parametric manipulations which weaken the percept of global motion (such as increasing the spacing between pulses), or which strengthen the percept of local motion (such as increasing the duration of each pulse), profoundly affect perceived motion. These variations in the percept are not correlated with a variation in the directionality of MT neurons.
An especially potent manipulation is to present the stimulus in the peripheral visual field, which uncovers a vivid experience of local motion that cannot be seen when the same stimulus is viewed centrally (readers can experience this while viewing Movie S2 by directing their gaze to a position about 5 stimulus widths to one side). This suggests that neural circuits devoted to information from the peripheral retina may be relatively more sensitive to local motion than those devoted to central retina [10, 11]. The relative decline in the strength of global motion signals with peripheral viewing might occur because these signals are processed by areas more devoted to the representation of the central retina, many of which belong to the “ventral stream” of visual information processing that is usually not thought to have a role in motion processing, but which may signal long-range apparent motion [17, 18].
Another possibility is that perceptual experience is based on signals from early topographically-organized areas, including MT, but is decoded using a more complex strategy than simply reading motion signals from populations of directionally tuned neurons [13, 19]. For salient objects in sparse fields, like the elements of our stimulus, a perception of motion arises when a correspondence is established between a feature at two times. Long-range apparent motion can occur under circumstances that do not offer any consistent local direction signal, as when an object appears, disappears and then reappears a substantial distance away [8]. Any visual area that encodes the location of features with sufficient spatial and temporal fidelity could inform such an operation, and MT is one such area, though by no means the only one. All that is required is to track an identifiable feature as it is displaced. Our results indicate that single MT neurons do not track features to support the perception of long-range apparent motion, but the population activity of these neurons could be a viable source of information for downstream computations. The competition between local and global motion percepts could then result from a conflict between the local signals within MT (implying motion in one direction) and the long-range motion of features in a population map (implying motion in the other).
There is no ready way to distinguish these explanations, but in either case it is clear that to understand the perception of local and global motion, we will need more complex accounts of the relationship between neuronal activity and perception than the ones we now use.
Experimental Procedures
Neuronal recordings
Stimuli consisted of sequentially presented local-motion pulses, each containing an elongated, brief, spatially and temporally band-limited drifting grating. The spatial frequency content of these pulses was chosen to match the response preference of the neuron, and band-limited by ensuring that at least one cycle of the dominant spatial frequency was contained within the contrast envelope. The contrast of each local pulse ramped up and down following either a raised-cosine or a Cauchy function. The duration of the local pulses was 80 ms for the awake recordings, and was set to be long enough to elicit a directional response for the anesthetized recordings, usually about 70 ms. Five to seven pulses were shown at a spacing of roughly 2° (range 0.7°–2.9°), chosen to place all the pulses within the neuron’s receptive field. The temporal offsets between pulses were set so that the global speed matched, as closely as possible, the preferred local speed, which we estimated in preliminary experiments. We presented randomly-interleaved stimuli with the four possible combinations of preferred and null local and global motion for at least five repetitions of every stimulus condition. Stimuli were generated by laboratory computers and shown on gamma-corrected CRT monitors with a spatial resolution of 1024 × 731 pixels and a frame rate of 100 Hz for the anesthetized recordings, 800 × 600 pixels and a frame rate of 60 Hz for the awake recordings.
Recording
We recorded extracellular activity from direction-selective MT neurons in six anesthetized and two awake adult macaque monkeys, using conventional methods previously described [20, 21]. We present data from both preparations because the anesthetized recordings allowed us systematically to explore a wide range of parameters and to more accurately tailor the stimulus to each cell’s stimulus preference, while the awake recordings were free of any potential influence of anesthesia. For the anesthetized recordings, we maintained anesthesia with an intravenous infusion of sufentanil citrate in lactated dextrose-saline (4–30 μg/kg/h in 4–10 ml/kg/h). We infused vecuronium bromide to prevent eye movements (0.1 μg/kg/h). To record from MT, we passed microelectrodes through a small durotomy centered roughly 16 mm lateral to the midline and 3 mm posterior to the lip of the lunate sulcus at an angle of 20° from horizontal in a ventroanterior direction. All procedures for these recordings were performed in compliance with the National Institutes of Health Guide for the Care and Use of Laboratory Animals and were approved by the New York University Animal Welfare Committee.
For the awake recordings, a head holding device, eye coil and recording cylinder were implanted under general anesthesia. The recording cylinder was placed over the primary visual cortex and MT was accessed via a posterior approach through a stainless steel guide tube that extended 4–5 mm caudal to the superior temporal sulcus. All procedures for these recordings were performed in compliance with the National Institutes of Health Guide for the Care and Use of Laboratory Animals and were approved by the Stanford University Administrative Panel on Laboratory Animal Care. During recording sessions, the animals were rewarded periodically for maintaining gaze within 2 deg of a fixation target.
The first step in our anesthetized recordings for each neuron was to measure the optimal direction, spatial and temporal frequency, and size with drifting sine-wave gratings. We used the results to choose parameter values for subsequent local-global experiments. We included almost all well isolated and responsive neurons, although we excluded a few cells responsive only to very low spatial frequencies, for which we could not create a multi-element effective stimulus. We followed a similar but less formal sequence for the awake recordings, in which we mapped a cell’s receptive field and checked its directional selectivity with smoothly drifting bars.
Data Analysis
We computed neuronal responses over an epoch beginning 25 ms after the start of the first motion pulse in each sequence and ending 45 ms after the end of the last, and then subtracted the baseline response.
To quantify the directionality at the two spatial scales, we computed standard directional indices, as the ratio of the null response to the preferred response subtracted from one, giving local DI and global DI. To quantify the dominance of the directionality for the local motion relative to the global motion, we subtracted global DI from local DI. We excluded three neurons, which had atypical responses owing to a failure to continuously isolate them for the duration of the presentation stimulus or incorrect parameterization of the stimulus.
Psychophysics
Procedures for our psychophysical experiments were approved by the New York University Committee on Activities Involving Human Subjects. Seven observers, having given informed consent but naïve to the particular purpose of the experiment, viewed a display consisting of a horizontally arranged global motion sequence containing 5 elements presented in a horizontal row 4° below the fixation point (Movie S4), with the pulses spaced 2 deg apart (Figure 4A). For the data reported here, the dominant spatial frequency of the pulses was 1 c/deg and the local drift rate was 8 Hz, giving a local speed of 8 deg/s (Figure 4A, B and C, red asterisks). The position and speed of the stimuli were chosen to loosely match those used in the physiology. The speed of global motion was determined by the temporal interval between pulses, and ranged from 0 (simultaneous presentation of all 5 patches, an “infinite” global speed) to 800 ms (a global speed of 2.5 deg/s). The central element contained local motion to the left or right, while the 4 flanking elements contained pulses of the same spatial and temporal structure and duration, each containing equal mixtures of local motion in the two directions. The observers’ task was to report the direction of the local motion of the central patch; after an initial training period, they were not given feedback about the accuracy of their choices.
We controlled the visibility of the local motion by varying the duration of each pulse; the range of durations used depended on individual observers’ sensitivity to the motion. On a given trial, the local motion could be either rightward or leftward, and we varied pulse duration using the method of constant stimuli. We randomly mixed trials containing leftward and rightward local and global motion.
The resulting data were compiled into psychometric functions (Figure 5A), which were fit to cumulative Gaussians using a maximum likelihood technique. From each fit we extracted a slope, the inverse of which was taken as the discrimination threshold, and an intercept, which was the point of subjective equality, i.e., the local motion duration that resulted in an equal number of reports of leftward and rightward motion.
Supplementary Material
Two elongated pulses of local motion drift in opposite directions. While fixating the central marker, the opposed motions should give the impression of the elements rocking back and forth.
Global motion appears as a sequence of local motion pulses, similar to those shown in Movie S1, presented from left to right, and back. The individual pulses in the top sequence are in the same direction as the global motion, initially from left to right, whereas they are in the opposite direction in the lower sequence. While fixating the central marker, most observers perceive the global motions to be in the same direction. The presence of the global motion, also makes it more difficult to discern the direction of the local motion. The local motion can be made visible by fixating on a remote marker, approximately 5 image widths off to the side.
As in Movie S2, but slowed by a factor of 10. The difference between the local motions of the upper and lower rows of pulses can be seen.
As in Movie S2, the central elements contain local motion in opposing directions, while in this case the flanking elements do not contain local motion.
Acknowledgments
We thank Kenneth Britten, Arnulf Graf, Yasmine El-Shamayleh, Stan Klein, Timothy Saint, and Ehud Zohary for help and advice, and Neot Doron, Mian Hou, and Judy Stein for technical support. This work was supported by the National Eye Institute (W.T.N., EY 05603; J.A.M., EY 02017). M.N.S. was supported by an HHMI Physician-Scientist Early Career Award.
Footnotes
Publisher's Disclaimer: This is a PDF file of an unedited manuscript that has been accepted for publication. As a service to our customers we are providing this early version of the manuscript. The manuscript will undergo copyediting, typesetting, and review of the resulting proof before it is published in its final citable form. Please note that during the production process errors may be discovered which could affect the content, and all legal disclaimers that apply to the journal pertain.
References
- 1.Allman JM, Kaas JH. A representation of the visual field in the caudal third of the middle temporal gyrus of the owl monkey (Aotus trivirgatus) Brain Res. 1971;31:85–105. doi: 10.1016/0006-8993(71)90635-4. [DOI] [PubMed] [Google Scholar]
- 2.Dubner R, Zeki SM. Response properties and receptive fields of cells in an anatomically defined region of the superior temporal sulcus. Brain Res. 1971;35:528–532. doi: 10.1016/0006-8993(71)90494-x. [DOI] [PubMed] [Google Scholar]
- 3.Maunsell JHR, Van Essen DC. Functional properties of neurons in the middle temporal visual area (MT) of the macaque monkey: II. Binocular interactions and the sensitivity to binocular disparity. J Neurophysiol. 1983;49:1148–1167. doi: 10.1152/jn.1983.49.5.1148. [DOI] [PubMed] [Google Scholar]
- 4.Mikami A, Newsome WT, Wurtz RH. Motion selectivity in macaque visual cortex: II. Spatio-temporal range of directional interactions in MT and V1. J Neurophysiol. 1986;55:1328–1339. doi: 10.1152/jn.1986.55.6.1328. [DOI] [PubMed] [Google Scholar]
- 5.Born RT, Bradley DC. Structure and function of visual area MT. Annu Rev Neurosci. 2005;28:157–189. doi: 10.1146/annurev.neuro.26.041002.131052. [DOI] [PubMed] [Google Scholar]
- 6.Movshon J, Newsome W. Visual response properties of striate cortical neurons projecting to area MT in macaque monkeys. J Neurosci. 1996;16:7733–7741. doi: 10.1523/JNEUROSCI.16-23-07733.1996. [DOI] [PMC free article] [PubMed] [Google Scholar]
- 7.Braddick OJ. A short-range process in apparent movement. Vision Res. 1974;14:519–527. doi: 10.1016/0042-6989(74)90041-8. [DOI] [PubMed] [Google Scholar]
- 8.Cavanagh P, Mather G. Motion: the long and short of it. Spat Vis. 1989;4:103–129. doi: 10.1163/156856889x00077. [DOI] [PubMed] [Google Scholar]
- 9.Zhang J, Yeh SL, De Valois KK. Motion contrast and motion integration. Vision Res. 1993;33:2721–2732. doi: 10.1016/0042-6989(93)90231-k. [DOI] [PubMed] [Google Scholar]
- 10.Tse PU, Hsieh PJ. The infinite regress illusion reveals faulty integration of local and global motion signals. Vision Res. 2006;46:3881–3885. doi: 10.1016/j.visres.2006.06.010. [DOI] [PubMed] [Google Scholar]
- 11.Shapiro A, Lu ZL, Huang CB, Knight E, Ennis R. Transitions between central and peripheral vision create spatial/temporal distortions: a hypothesis concerning the perceived break of the curveball. PLoS One. 2010;5:e13296. doi: 10.1371/journal.pone.0013296. [DOI] [PMC free article] [PubMed] [Google Scholar]
- 12.Shapiro AG, Knight EJ, Lu ZL. A first- and second-order motion energy analysis of peripheral motion illusions leads to further evidence of “feature blur” in peripheral vision. PLoS One. 2011;6:e18719. doi: 10.1371/journal.pone.0018719. [DOI] [PMC free article] [PubMed] [Google Scholar]
- 13.Priebe NJ, Churchland MM, Lisberger SG. Reconstruction of target speed for the guidance of pursuit eye movements. Journal of Neuroscience. 2001;21:3196–3206. doi: 10.1523/JNEUROSCI.21-09-03196.2001. [DOI] [PMC free article] [PubMed] [Google Scholar]
- 14.Majaj NJ, Carandini M, Movshon JA. Motion integration by neurons in macaque MT is local, not global. J Neurosci. 2007;27:366–370. doi: 10.1523/JNEUROSCI.3183-06.2007. [DOI] [PMC free article] [PubMed] [Google Scholar]
- 15.Block N. Two neural correlates of consciousness. Trends Cogn Sci. 2005;9:46–52. doi: 10.1016/j.tics.2004.12.006. [DOI] [PubMed] [Google Scholar]
- 16.Ilg UJ, Churan J. Motion perception without explicit activity in areas MT and MST. J Neurophysiol. 2004;92:1512–1523. doi: 10.1152/jn.01174.2003. [DOI] [PubMed] [Google Scholar]
- 17.Zhuo Y, Zhou TG, Rao HY, Wang JJ, Meng M, Chen M, Zhou C, Chen L. Contributions of the visual ventral pathway to long-range apparent motion. Science. 2003;299:417–420. doi: 10.1126/science.1077091. [DOI] [PubMed] [Google Scholar]
- 18.Ferrera VP, Rudolph KK, Maunsell J. Responses of neurons in the parietal and temporal visual pathways during a motion task. The Journal of neuroscience. 1994;14:6171. doi: 10.1523/JNEUROSCI.14-10-06171.1994. [DOI] [PMC free article] [PubMed] [Google Scholar]
- 19.Jancke D, Chavane F, Naaman S, Grinvald A. Imaging cortical correlates of illusion in early visual cortex. Nature. 2004;428:423–426. doi: 10.1038/nature02396. [DOI] [PubMed] [Google Scholar]
- 20.Britten KH, Shadlen MN, Newsome WT, Movshon JA. The analysis of visual motion: a comparison of neuronal and psychophysical performance. J Neurosci. 1992;12:4745–4765. doi: 10.1523/JNEUROSCI.12-12-04745.1992. [DOI] [PMC free article] [PubMed] [Google Scholar]
- 21.Cavanaugh JR, Bair W, Movshon JA. Nature and interaction of signals from the receptive field center and surround in macaque V1 neurons. J Neurophysiol. 2002;88:2530–2546. doi: 10.1152/jn.00692.2001. [DOI] [PubMed] [Google Scholar]
Associated Data
This section collects any data citations, data availability statements, or supplementary materials included in this article.
Supplementary Materials
Two elongated pulses of local motion drift in opposite directions. While fixating the central marker, the opposed motions should give the impression of the elements rocking back and forth.
Global motion appears as a sequence of local motion pulses, similar to those shown in Movie S1, presented from left to right, and back. The individual pulses in the top sequence are in the same direction as the global motion, initially from left to right, whereas they are in the opposite direction in the lower sequence. While fixating the central marker, most observers perceive the global motions to be in the same direction. The presence of the global motion, also makes it more difficult to discern the direction of the local motion. The local motion can be made visible by fixating on a remote marker, approximately 5 image widths off to the side.
As in Movie S2, but slowed by a factor of 10. The difference between the local motions of the upper and lower rows of pulses can be seen.
As in Movie S2, the central elements contain local motion in opposing directions, while in this case the flanking elements do not contain local motion.