

Abstract
Previous studies have shown that the S5′ β-strand (r93–r97) of the regulatory polypeptides of the aspartate transcarbamoylases (ATCases) from Serratia marcescens and Escherichia coli are responsible for their diverged allosteric regulatory patterns, including conversion of CTP from an inhibitor in E. coli to an activator in S. marcescens. Similarly, mutation of residues located in the interface between the allosteric and the zinc domains resulted in conversion of the ATP responses of the E. coli enzyme from activation to inhibition, suggesting that this interface not only mediates but also discriminates the allosteric responses of ATP and CTP. To further decipher the roles and the interrelationships of these regions in allosteric communication, allosteric-zinc interface mutations (Y77F and V106A) have been introduced into both the native and the S5′ β-strand chimeric backgrounds. While the significance of this interface in the allosteric regulation has been confirmed, there is no direct evidence supporting the presence of distinct pathways for the ATP and CTP signals through this interface. The analysis of the mutational effects reported here suggested that the S5′ β-strand transmits the allosteric signal by modulating the hydrophobic allosteric–zinc interface rather than disturbing the allosteric ligand binding. Intragenic suppression by substitutions in the hydrophobic interface between the allosteric and the zinc domains of the regulatory chains resulted in the partial recovery of allosteric responses in the EC:rS5’sm chimera and reduced the activation by ATP in the Sm:rS5’ec chimera. Thus, it seems that there is a synergy between these two Structural Units.
Keywords: ATCase, allosterism, S5′ β-strand, allosteric-zinc interface, mutational effect, signal transmission, ligand binding
Aspartate transcarbamoylase (EC 2.1.3.2; ATCase)2 catalyzes the condensation of L-aspartate with carbamoyl phosphate to form carbamoylaspartate and phosphate, ultimately leading to the pyrimidine end products, UTP and CTP (1–3). In Escherichia coli, the holoenzyme is composed of two catalytic subunits and three regulatory subunits (2c3:3r2). Three catalytic polypeptides associate to form a functional catalytic subunit (trimer, c3) and two regulatory polypeptides form a regulatory subunit (dimer, r2) (Fig. 1). Each of the catalytic polypeptides is folded into a carbamoyl phosphate-binding domain (CP domain, c1–c150) and an aspartate-binding domain (Asp domain, c155–c290), while each regulatory polypeptide is folded into an allosteric effector-binding domain (Allo domain, r1–r100) and a zinc-binding domain (Zn domain, r105–r146). The active sites are located at the interfaces of the Asp and CP domains of the catalytic trimers, positioned 60 Å away from the nucleotide-binding sites, which are located adjacent to the five-stranded β-sheets of the Allo domains and directly linked to the Zn domains through the S5′ β-strand. The hydrophobic allosteric–zinc interface includes leucine r32, phenylalanine r33, tyrosine r77, and valine r106. These residues are invariant among the four members of the Enterobacteriaceae whose sequences have been reported: E. coli, Serratia marcescens, Erwinia herbicola, and Salmonella typhimurium. This hydrophobic pocket is separated from the S5′ β-strand by a H2′ α-helix of nine residues (Fig. 2).
FIG. 1.
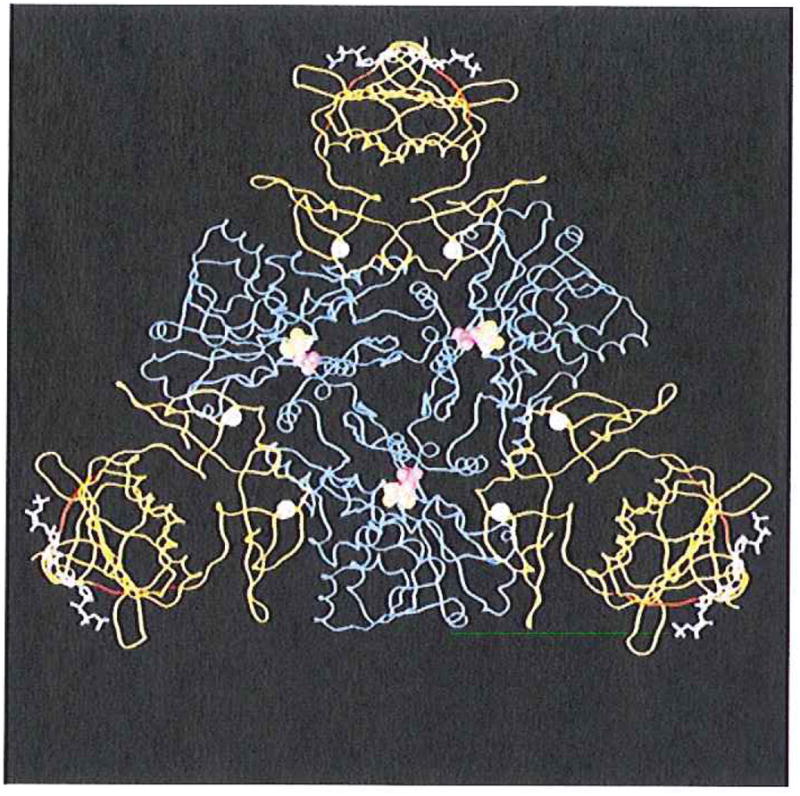
A molecular graphic representation of a CTP liganded R-state holoenzyme of ATCase from E. coli. The holoenzyme is composed of two catalytic trimers (one trimer is shown in blue while the second is located beneath this trimer and not shown here for the purpose of simplification) and three regulatory dimers (in yellow). The nucleotide effector CTP (in white sticks and purple balls) binds to the allosteric domain and exerts its effect through the zinc domain (six zinc atoms are indicated as white balls) to the catalytic sites 60 Å away (the catalytic site lies between the Asp and the CP domain of each catalytic monomer and is defined by the substrate analogs phosphonoacetamide (purple balls) and malonate (yellow balls)). The substituted regions (r93–r97, red ribbon) arc located at the junction between the allosteric binding sites and the catalytic sites.
FIG. 2.
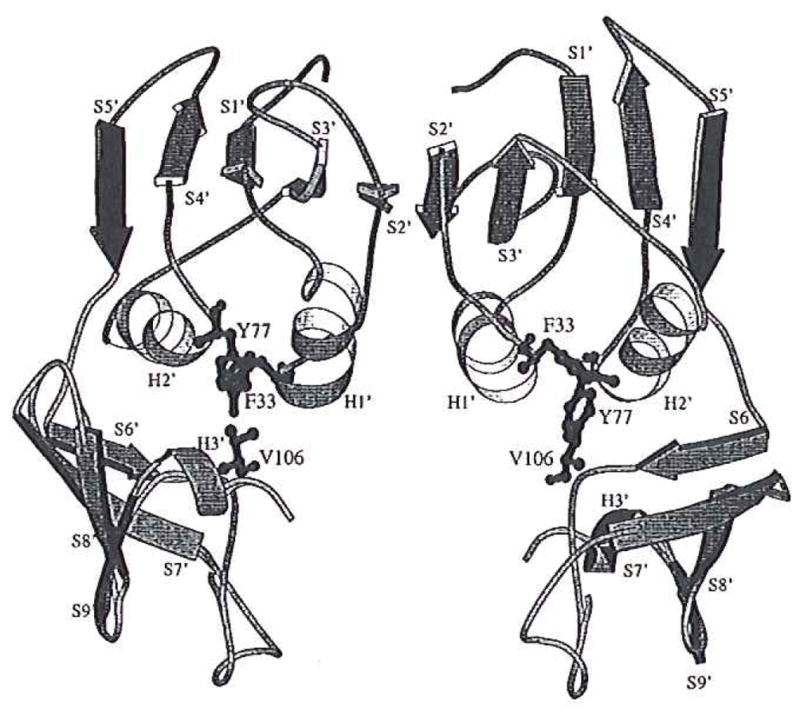
A schematic diagram shows the secondary elements of a regulatory dimer of the native E. coli ATCase enzymes. A single polypeptide, consisting of three α-helixes (H1′ to H3′) and nine β-strands (S1′ to S9′) is divided into an allosteric domain (including H1′ and H2′ α-helixes and S1′ to S′ β-strands) and a zinc domain (including H3′ α-helix and S6′ to S9′ β-strands). The S5′ β-strands are in black and the residues Phe at r33, Tyr at r77, and Val at r106 in the hydrophobic pocket are represented as black sticks and gray balls. This diagram was generated with Rasmol (25) and converted into postscript file for plotting using Molscript (26).
Binding of N-phosphonacetyl-L-aspartate (PALA, a transition-state analogue) results in the T to R transition, during which the allosteric-zinc interface opens 2–3 Å as the catalytic trimers separate and the catalytic and regulatory subunits rotate about their respective axes of symmetry (4–7). Small-angle X-ray-scattering analysis indicated that there is no significant difference between the T state in the crystal and that in the solution forms, whereas the R state is more relaxed in solution than in the crystal. For example, the distance between the catalytic trimers along the threefold axis is 3.4 Å larger in solution than in crystals (8).
The ATCase from S. marcescens has the same dodecameric structure, 2c3:3r2, as the E. coli enzyme and shares 85 and 76% amino acid identity within their catalytic and regulatory polypeptides, respectively (9, 10). Most of the residues involved in the nucleotide-binding sites and all inter- and intrasubunit interfaces (r1:c1, r1:c4, r1:r6, and Allo:Zn) are conserved in the two enzymes (5, 9). Despite these structural and sequence similarities, the two enzymes differ in both regulatory and catalytic characteristics. Most notably, CTP activates the catalytic activity of the S. marcescens ATCase and the CTP + UTP inhibitory synergism is lost. This allosteric pattern is contrary to the traditional logic of the E. coli ATCase in which CTP feedback inhibits 50–60% of the catalytic activity of the enzyme, and the combination of CTP and UTP inhibits 90–95%. Hybrid ATCase holoenzyme assembled in vivo with the catalytic subunits from E. coli and the regulatory subunits from S. marcescens (Cec:Rsm) exhibited allosteric responses characteristic of the native S. marcescens holoenzyme (9). The reverse hybrid enzyme (Csm:Rec), utilizing the S. marcescens catalytic subunits and the E. coli regulatory subunits, exhibited the allosteric responses of the E. coli enzyme (9, 11). These hybrids, along with other interspecies hybrids, have verified the hypothesis that the allosteric pattern of the ATCase holoenzyme is determined exclusively by the controlling regulatory subunits (12, 13).
The combination of structural similarity and functional divergence of these two enzymes provides an opportunity to directly address the role of specific structural regions in allosteric regulation. Rather than being randomly dispersed, the most diverged regions are located at the minor r1:c1 interface (r130’s region) and the Zn:Allo domain junction (r100’s region) (9, 13, 14). A chimeric enzyme, SM:rS5’ec, was constructed in which the S5′ β-strand containing five diverged amino acids of the S. marcescens enzyme was replaced with the β-strand of the E. coli enzyme. The resulting chimeric ATCase displayed an allosteric pattern similar to that of the native E. coli enzyme (ATP activation, CTP inhibition, and CTP + UTP synergistic inhibition). The reverse chimera, EC:rS5’sm, has been constructed by replacing the S5′ β-strand of the E. coli enzyme with that of the S. marcescens enzyme. However, the resulting enzyme lost all allosteric responses (15). While these results demonstrate that the nonconserved residues r93–r97 (S5′ β-strand) are critical to establishing the allosteric pattern (10, 15), molecular modeling further suggested that the substitutions of the S5′ β-strand act by perturbing residues at the hydrophobic allosteric-zinc interface (15). This hypothesis is consistent with a series of single amino acid substitutions which indicate that the allosteric–zinc interface can modulate the allosteric responses of the E. coli enzyme. Specifically, a tyrosine to phenylalanine substitution at r77 (ECY77F) and a valine to alanine change at r106 (ECV106A) of the native E. coli enzyme have been reported to convert ATP from an allosteric activator to an inhibitor (16, 17).
To further investigate whether these regions exert their effects independently or interactively, site-directed modification of chimeric enzymes have been created in which mutations in the two region have been coupled. The analysis of Y77F and V106A mutations in the various native and chimeric ATCases provides a unique opportunity for evaluating the relationship between the S5′ β-strand and its neighboring allosteric–zinc domain interface. The results from this study are consistent with the prediction developed by structural modeling that the effects of the substitutions of the S5′ β-strand are propagated through the regulatory subunit via the hydrophobic allosteric–zinc interface.
EXPERIMENTAL PROCEDURES
Materials
Carbamoyl phosphate (lithium salt), L-aspartate, [4-morpholino]ethanesulfonic acid (Mes), N-ethylmorpholine, and diethanolamine were purchased from Sigma. Adenosine 5′-triphosphate (ATP), cytidine 5′-triphosphate (CTP), and uridine 5′-triphosphate (UTP) were purchased from USB. Oligonucleotides and restriction enzymes were purchased from either GIBCO-BRL or the Gene Technology Lab, Department of Biology of Texas A&M University. [α-3H]CTP was from DuPont NEN. Other DNA-modifying enzymes were purchased from Pharmacia Biotech.
E. coli strain U39a [ara, thi, Δ(pro-lac), ΔpyrB, rpsl, strA, rnb] was used for the preparation of template DNA for mutagenesis. E. coli strain BMH71-18mutS (thi supE Δ(lac-proAB) [mutS::Tn10][F ProAB lacIZq ΔM15]; Clontech) was used for the initial transformation following primer extension. E. coli strain EK1104 (ara, thi, Δ(pro-lac), ΔpyrBI, rpsL;strA, pyrF±, 18) was used for all subsequent transformations and overexpression.
Site-directed mutagenesis
Site-directed mutagenesis was performed with double-stranded plasmid pPBh601-ec for E. coli (15) and pPBh200-sm for S. marcescens (9) according to the Deng and Nickoloff protocol (19) as modified by Liu et al. (10). The single (or double) mutations were generated by incorporating the corresponding mutagenesis primer (or primers) and selection primers with the native plasmid. After mutagenesis, the resulting plasmid pool was transformed into BMH71–18 mutS, amplified overnight, reisolated using the Wizard minipreparation column from Promega, and extensively digested with Af/III (for E. coli) or NcoI (for S. marcescens). The digested plasmid pool was transformed into EK1104 and plated on LB medium with 40 mg/L ampicillin, The resulting colonies were screened by restriction digestion, and suspected mutants were verified by sequencing. Following the identification of the desired chimera, the entire pyrBI operon was sequenced using the Sequenase version 2.0 DNA kit from USB to verify that there were no other mutations in the coding region.
Enzyme purification and kinetic evaluation
The plasmid containing the mutated pyiBI operon was transformed into EK1104 and grown in minimal medium (TF medium) supplemented as previously described (20). The overexpressed holoenzyme was purified to homogeneity (10), and ATCase activity was determined according to the colorimetric assay of Prescott and Jones (21). Aspartate requirements were determined in the presence of a saturating concentration of carbamoyl phosphate (4.8 mM). Effector responses were determined in the presence of 2 mM ATP (4 mM for the native S. marcescens ATCase), 2 mM CTP, and 2 mM UTP or 2 mM CTP plus 2 mM UTP. All activity assays were performed in Tripartate buffer, 0.1 M Mes, 0.051 M N-ethylmorpholine, 0.051 M diethanolamine, pH 8.3, 28°C (22).
Equilibrium dialysis
Equilibrium binding of CTP was determined according to the general procedures of Tauc et al. (23) as modified by Wild et al. (3). CTP concentrations were adjusted from 1 to 2000 μM and the specific radioactivities of the 3H-labeled CTP were adjusted to approximately 5000 cpm/μl The concentrations of ATCase enzymes were 3.0 mg/ml (10 μM) and dialysis reached equilibrium within 36 h at room temperature in the absence or presence of 1 mM N-(phosphonacetyl)-L-aspartate (PALA).
Data analysis
All collected data were fit with Table Curve 2D and the linear equation for the regression line with maximal r2 value (square of the Pearson product moment correlation coefficient) was selected. Vmax and [Asp]0.5 values were calculated directly from these equations. The nH value was determined from a Hill plot of the data.
The saturation binding curves were represented as a plot of concentrations of free CTP against bound CTP per ATCase holoenzyme. The relative binding affinity ([CTP]0.5) for CTP was estimated from this plot.
The allosteric effect of a ligand on ATCase is quantitatively described by the percentage of change in enzymatic activity. Based on the aspartate saturation curve in the absence of nucleotide effector, the Vmax and [Asp]0.5 values were obtained and designated as and , respectively. The reaction velocity (VNTP) at aspartate concentration of was calculated using the aspartate saturation curve in the presence of saturated nucleotide effector. The allosteric effect was determined using the equation
The nucleotide was designated as activator If the allosteric effect was positive and as inhibitor if negative.
RESULTS
The native E. coli ATCase was inhibited by CTP and activated by ATP, whereas the native S. marcescens enzyme was activated by both CTP and ATP. The chimeric SM:rS5’ec displayed an aliosteric pattern similar to that of the native E. coli enzyme, whereas the EC:rS5’sm chimera had no allosteric response.
The Effects of S5′ β-Strand Substitution on CTP Binding
Consistent with previous reports for the native E. coli enzyme, both the native E. coli and the S. marcescens ATCases and their corresponding chimeras have three high-affinity CTP binding sites independent of the presence or absence of PALA. The reported three low-affinity sites were not clearly detected in this experiment. When CTP functions as an activator in the native S. marcescens ATCase it binds more tightly in the presence of PALA ([CTP]0.5 = 140 μM vs 76 μM). However, when it functions as an inhibitor, CTP binds the SM:rS5’ec chimera more tightly in the absence of PALA ([CTP]0.5 = 255 μM vs 114 μM). PALA has little effect on the CTP binding of the native and chimeric E. coli enzymes. It should be noted that the EC:rS5’sm chimera displays significant CTP binding, although CTP has little allosteric effect (Table I).
TABLE I.
CTP-Binding Parameters of the Native and Chimeric E. coli and S. marcescens ATCase Enzymes
| Enzyme |
na |
[CTP]0.5b |
||
|---|---|---|---|---|
| No PALA | 1 mM PALA | No PALA | 1 mM PALA | |
| E. coli S. | 2.9 | 3.1 | 206.2 | 257.7 |
| EC:rS5’sm | 2.8 | 3.0 | 183.7 | 178.5 |
| S. marcescens | 3.2 | 3.1 | 139.6 | 75.7 |
| SM:rS5’ec | 3.3 | 3.8 | 113.7 | 254.5 |
Number of sites determined as described under Experimental Procedures.
The concentration of CTP (μM) at which the ATCase enzyme is half-saturated with CTP.
The Mutational Effect of the Y77F and V106A Mutations in Different Backgrounds
The effects of Y77F and V106A mutations on the characteristics of the ATCase enzymes vary depending on the nature of the enzyme substituted (Table II). With the exception of the SM:rS5’ec chimera, the catalytic activities of all the enzymes were reduced by introducing either the Y77F or the V106A mutations. The Vmax value of the SM:rS5’ec chimera was increased almost threefold, from 18.5 to more than 50 μmol/h/μg. The Y77F mutation decreased the [Asp]0.5 values of the two native enzymes and increased the values of the two chimeric enzymes. The V106A mutation decreased the [Asp]0.5 values of the native E. coli enzyme (16.6 mM vs 5.8 mM), while those of the other enzymes remained unchanged. In contrast, the Y77F and V106A mutations did not significantly modify the homotropic cooperativities of the two chimeric enzymes but significantly reduced or eliminated those of the native enzymes.
TABLE II.
The Kinetic Parameters of the Native, Single-Site, and Double-Site Mutants of E. coli and S. marcescens ATCase Enzymesa
| Enzymesb | Vmaxc | [Asp]0.5d | nHe |
|---|---|---|---|
| E. coli | 24.9 ± 1.2 | 16.6 ± 1.4 | 3.2 ± 0.1 |
| ECY77F | 19.4 ± 0.9 | 6.9 ± 0.4 | 1.7 ± 0.2 |
| ECV106A | 10.9 ± 1.1 | 5.8 ± 0.7 | 1.6 ± 0.4 |
| EC:rS5’sm | 22.4 ± 2.1 | 6.1 ± 0.6 | 1.4 ± 0.1 |
| EC:rS5’sm/Y77F | 10.1 ± 1.3 | 19.3 ± 1.6 | 1.6 ± 0.5 |
| EC:rS5’sm/V106A | 8.4 ± 0.6 | 6.0 ± 0.3 | 2.0 ± 0.6 |
| S. marcescens | 22.4 ± 0.5 | 39.2 ± 0.3 | 1.9 ± 0.1 |
| SMY77F | 12.8 ± 2.2 | 19.7 ± 3.6 | 1.0 ± 0.1 |
| SMV106A | 10.7 ± 1.2 | 35.3 ± 2.2 | 1.1 ± 0.1 |
| SM:rS5’ec | 18.5 ± 1.1 | 4.7 ± 0.1 | 2.1 ± 0.1 |
| SM:rS5’ec/Y77F | 50.6 ± 5.2 | 20.9 ± 2.8 | 2.5 ± 0.2 |
| SM:rS5’ec/V106A | 55.9 ± 11 | 5.0 ± 0.6 | 2.0 ± 0.2 |
All assays were carried out in Tripartate buffer (pH 8.3) and all values were determined as previously described (10).
ECY77F (or SMY77F) represents the Tyr at r77 of the E. coli (or S. marcescens) enzyme being replaced with Phe; ECV106A (or SMV106A) represents the Val at r106 of the E. coli (or S. marcescens) enzyme being replaced with Ala; EC:rS5’sm/Y77F (or SM:rS5’ec/Y77F) represents the Tyr at r77 of the EC:rS5’sm (or SM:rS5’ec) chimera being replaced with Phe; EC:rS5’sm/V106A (or SM:rS5’ec/V106A) represents the Val at r106 of the EC:rS5’sm (or SM:rS5’ec) chimera being replaced with Ala.
The maximal velocity, estimated at saturating concentrations of substrates, is given as μmol/h/mg.
Concentration of aspartate (mM) required to produce half-maximal velocity.
Hill coefficient (nH) estimated from aspartate saturation kinetics (determined by the Hill plot).
The mutational effect of the S5′ β-strand substitutions and Y77F and V106A also demonstrated different forms of interaction. Both the S5′ β-strand substitution (SM:rS5’ec and EC:rS5’sm) and the Y77F mutation (ECY77F and SMY77F) independently decreased the [Asp]0.5 values, while the combination of the two mutations (EC:rS5’sm/Y77F and SM:rS5’ec/Y77F) increased the values. This suggests that there is a synergy between the S5′ β-strand and the Y77F mutation. In E. coli ATCase, both the S5′ β-strand substitution (EC:rS5’sm) and the V106A mutation (ECV106A) independently decreased the [Asp]0.5 values, while their combination (EC:rS5’sm/V106A) did not have any additional effect. In S. marcescens ATCase, the V106A mutation (SMV106A) did not change the [Asp]0.5 value significantly, while the S5′ β-strand substitution decreased [Asp]0.5 to the same extent by itself (SM:rS5’ec) or in combination with the V106A mutation (SM: rS5’ec/V106A). It appears as though the effects of the S5′ β-strand substitution and the V106A mutation [Asp]0.5. are independent. However, if the mutational effect on Vmax is considered, both the S5′ β-strand substitution and the V106A mutation either maintain or decrease the Vmax values relative to the native enzymes. The combination of both mutations further decreased the Vmax value in the EC:rS5’sm/V106A enzyme but greatly increased the Vmax in the SM:rS5’ec/V106A enzyme.
The Allosteric Responses of the Y77F and V106A Mutations in Different Enzymes
It should be noted that the Y77F and V106A mutations in the E. coli ATCase have been previously reported to result in the inhibition of enzymatic activity by 10 mM ATP at 5 mM of carbamoyl phosphate concentration (16, 17). In this study, inhibition by ATP was also observed in the ECY77F and ECV106A mutant enzymes, but only at low concentrations of aspartate ( of the [ASP]0.5) when the standard carbamoyl phosphate concentration of 4.8 mM was used. This inhibition was reversed, and ATP became an activator, when the carbamoyl phosphate concentration was doubled (data not shown). This suggests that the apparent inhibition at high concentrations of ATP in the presence of lower carbamoyl phosphate concentrations may be competitive inhibition at the active site rather than a true allosteric response.
In the native S. marcescens enzyme, these mutations eliminated all allosteric effects. The strong ATP activation in the SM:rS5’ec chimera was significantly reduced by both the Y77F and the V106A mutations. The EC:rS5’sm chimera, which had no allosteric response, recovered slight allosteric responses when combined with the Y77F and V106A mutations (Table III and Figs. 3 and 4).
TABLE III.
The [Asp]0.5 Values of the Native, Single-Site, and Double-Site Mutants of E. coli and S. marcescens ATCase Enzymes in the Presence of Allosteric Ligandsa
| Enzymeb | No ligandc | ATP | CTP | UTP | C + U |
|---|---|---|---|---|---|
| E. coli | 16.6 ± 1.4 | 9.9 ± 1.9 | 27.3 ± 2.0 | 15.4 ± 2.7 | 31.8 ± 2.0 |
| ECY77F | 6.9 ± 0.4 | 7.8 ± 0.3 | 7.5 ± 0.4 | 6.9 ± 0.6 | 7.4 ± 1.1 |
| ECV106A | 5.8 ± 0.7 | 6.7 ± 0.2 | 6.3 ± 1.0 | 6.3 ± 0.5 | 7.2 ± 1.2 |
| EC:rS5’sm | 6.1 ± 0.6 | 6.4 ± 0.3 | 5.9 ± 0.2 | 5.8 ± 0.4 | 6.1 ± 0.1 |
| EC:rS5’sm/Y77F | 19.3 ± 0.6 | 15.7 ± 0.7 | 15.8 ± 0.6 | 16.2 ± 0.8 | 19.4 ± 1.2 |
| EC:rS5’sm/V106A | 6.0 ± 0.3 | 6.3 ± 0.4 | 7.2 ± 0.1 | 6.5 ± 0.2 | 7.0 ± 0.0 |
| S. marcescens | 39.2 ± 0.3 | 17.7 ± 3.7 | 22.0 ± 1.8 | 41.0 ± 3.1 | 25.7 ± 1.0 |
| SMY77F | 19.7 ± 3.6 | 18.3 ± 3.6 | 18.9 ± 3.6 | 18.7 ± 5.6 | 19.2 ± 4.6 |
| SMV106A | 35.3 ± 2.2 | 32.3 ± 2.8 | 34.0 ± 3.2 | 34.5 ± 1.2 | 33.3 ± 2.2 |
| SM:rS5’ec | 4.7 ± 0.1 | 2.8 ± 0.1 | 9.0 ± 0.4 | 4.6 ± 0.1 | 12.0 ± 0.1 |
| SM:rS5’ec/Y77F | 20.9 ± 2.8 | 18.3 ± 3.7 | 35.0 ± 1.0 | 24.4 ± 2.8 | 40.7 ± 0.6 |
| SM:rS5’cc/V106A | 5.0 ± 0.6 | 3.9 ± 0.4 | 7.8 ± 0.8 | 5.3 ± 0.9 | 11.0 ± 1.6 |
All assays were carried out in Tripartate buffer (pH 8.3) and all values were determined as previously described (10).
FIG. 3.

Aspartate saturation curves of Y77F and V106A mutations in the native and chimeric E. coli and S. marcescens enzymes. The aspartate saturation of ATCase activity was determined in the presence of ○, 2 mM ATP; ▼, 2 mM CTP; ▽, 2 mM UTP; ■, 2 mM CTP plus 2 mM UTP; and ●, without any nucleotide effector. Standard assay conditions were used and each curve is the average of at least three independent assays. Please note that due to the variability in catalytic activity and [Asp]0.5 values the x and y axes differ slightly between the individual graphs.
FIG. 4.

The allosteric responses of the Y77F and V106A mutations in the native and chimeric E. coli and S. marcescens enzymes. The allosteric effect is expressed as percentage change in reaction rates determined as described under Experimental Procedures. The nucleotide was designated as an activator if the allosteric effect was positive and as an inhibitor if negative.
In most of the enzymes, the Y77F and V106A mutations had similar effects on the allosteric responses of their parental enzymes. The only exception is in the EC:rS5’sm chimera, in which the Y77F mutation resulted in recovery of slight ATP and CTP activation, while the V106A mutation showed slight ATP and CTP inhibition. In all enzymes, both the ATP and the CTP responses were altered by the Y77F or V106A mutations.
DISCUSSION
Role of the S5′ β-Strand in Allosteric Regulation
The native E. coli and S. marcescens enzymes have the same dodecameric structure and share strong sequence similarity (9, 10). The observation that structurally important regions are usually highly conserved led to the prediction that functional differences originated within the nonconserved regions (13). While a high frequency of the amino acid variation has been observed in the r100’s and r130’s region (9, 10), the most significant divergence lies within the S5′ β-strand of the regulatory polypeptide. Interconversions of this S5′ β-strand in the E. coli and S. marcescens ATCases generated chimeric enzymes with significant allosteric disruptions, indicating that the S5′ β-strand played an important role in the determination of the allosteric responses of the native enzymes (10, 15).
The ATCase holoenzyme has been shown to maintain a conformational equilibrium between a constrained (T) state and a relaxed active (R) state. The presence of PALA (a transition-state analogue) drives this equilibrium to favor the catalytically proficient R state. The allosteric effect of a given ligand on catalysis is associated with its relative binding affinity for the T or the R state. Since the R state of the native S. marcescens ATCase has higher affinity for CTP than the T state does, CTP shifts the equilibrium toward the active R state, and CTP is an activator. The E. coli ATCase has the reverse situation, so CTP is an inhibitor. Substitution of the S5′ β-strand with the E. coli sequence results in a relatively lower affinity of the R state for CTP (Table I, in the presence of PALA); therefore, the SM:rS5’ec chimera is inhibited by CTP. The desensitization of the chimeric EC:rS5’sm to CTP is not due to the elimination of CTP binding but rather to the similarity in the binding of CTP between the T and R states (Table I).
The Allosteric–Zinc Interface Does Not Discriminate between the ATP and the CTP Signals
Crystallographic studies of the E. coli enzyme have indicated that the allosteric–zinc interface in the regulatory dimer undergoes significant changes in the T to R transition as the H1′ α-helix shifts along its helical axis (5) and induces a significant relocation of Phe r33 at the interface. Significant reorientation and rotation of this interface has also been suggested by molecular dynamic simulations (24). Previous studies have shown that the V106A mutation reduces the sensitivity of the E. coli enzyme to CTP and that the Y77F mutation results in a reversal of the polarity of the ATP signal. This has been interpreted as evidence for the presence of distinct pathways for ATP and CTP (17), leading to the proposal that the ATP signal is specifically transmitted from the nucleotide effector binding site to the zinc domain through the H2′ α-helix where Y77 is located. Conversely, the CTP signal is transmitted through the H1′ α-helix to V106 in the zinc domain (17). However, the results presented here are not consistent with this proposed allosteric mechanism: (i) ATP inhibition of the ECY77F and ECV106A mutants observed at low aspartate and standard carbamoyl phosphate concentrations was changed to activation by an increase in the concentration of carbamoyl phosphate. (ii) Under the conditions of this study, both ATP and CTP responses were eliminated in the Y77F and V106A mutations in the native E. coli, the native S. marcescens, and the EC:rS5’sm chimeric enzymes. It should be noted that despite the allosteric similarity between the native E. coli and the SM:rS5’ec ATCases, these enzymes were not affected by the V106A and Y77F mutations in a similar manner. This is consistent with previous studies (15) suggesting that the S5′ β-strand is not the sole determinant of the allosteric character and indicates that the hydrophobic interface plays a major role, (iii) Both the ATP-activating and the CTP-inhibiting effects were reduced in the SM: rS5’ec/Y77F and SM:rS5’ec/V106A enzymes relative to the SM:rS5’ec chimera. In this case, it is clear that the allosteric–zinc interface does not discriminate between the ATP and the CTP signals but has an effect on both.
Analysis of Mutational Effect Verifies the Hypothesis from Molecular Modeling
Molecular modeling of the native and the chimeric enzymes indicated that the allosteric–zinc interface of the native E. coli enzyme is more open than that of the S. marcescens enzyme. Substitution of the S5′ β-strand of the native S. marcescens enzyme with the E. coli sequence appears to lead to several structural reorientations (15). The most significant effect may be the opening of the interface between the allosteric and the zinc domains. Although the relationship between the allosteric effect and the structural modification could be indirect, these results suggest that the S5′ β-strand modulates the allosteric character of the enzyme by propagating its effect through the allosteric–zinc interface. The possibility that the S5′ β-strand modulates the allosteric character of the enzyme by disturbing the nucleotide binding pocket is eliminated by the CTP binding studies. The structural coordination between the S5′ β-strand and the allosteric–zinc interface is supported by the mutational effects on either the Vmax or the [Asp]0.5 by the combination of mutations at the S5′ β-strand and positions r77 or r106. The synergy between these sites supports the idea that there is a strong interaction between the S5′ β-strand and the allosteric–zinc interface.
CONCLUDING REMARKS
Substitution of the allosteric–zinc interface residues Y77 and V106 induced alterations in the allosteric responses in both native and chimeric enzymes. In the EC:rS5’sm chimera, which exchanged the S5′ β-strand structures, the Y77F and V106A mutations (affecting the hydrophobic allosteric–zinc interface) reestablished some modest allosteric responses. Analysis of synergy between the mutational effects of these two structural elements indicated that exchange of the S5′ β-strand may exert its influence by perturbation of the allosteric–zinc interface. This is consistent with molecular modeling studies, which indicated that residues of the allosteric–zinc interface were relocated in the chimeric enzymes (15). Finally, in all the enzymes reported here, mutations in either Y77 or V106 resulted in alteration of both activation and inhibition response of the enzyme, suggesting that the allosteric responses may involve a global signal transmission, or possibly a common shared pathway, through the hydrophobic domain interface rather than discrete structural pathways distinct for each type of allosteric effector response.
Acknowledgments
This research has been supported by grants from the Robert A. Welch Foundation (A915) and the NSF (MCB9723129). L. Liu was a TAMU Regent’s Graduate Fellow.
Footnotes
Abbreviations used: ATCase, aspartate transcarbamoylase; PALA, N-phosphonacetyl-L-aspartate.
References
- 1.Jones ME, Spector L, Lipmann F. J Am Chem Soc. 1955;77:819–820. [Google Scholar]
- 2.Reichard P, Hanshoff G. Acta Chem Scand. 1956;10:548–566. [Google Scholar]
- 3.Wild JR, Loughrey-Chen SJ, Corder TS. Proc Natl Acad Sci USA. 1989;86:46–50. doi: 10.1073/pnas.86.1.46. [DOI] [PMC free article] [PubMed] [Google Scholar]
- 4.Ke HM, Lipscomb WN, Cho Y, Honzatko RB. J Mol Biol. 1988;204:725–747. doi: 10.1016/0022-2836(88)90365-8. [DOI] [PubMed] [Google Scholar]
- 5.Gouaux JE, Stevens RC, Lipscomb WN. Biochemistry. 1990;29:7702–7715. doi: 10.1021/bi00485a020. [DOI] [PubMed] [Google Scholar]
- 6.Krause KL, Volz KW, Lipscomb WN. J Mol Biol. 1987;193:527–553. doi: 10.1016/0022-2836(87)90265-8. [DOI] [PubMed] [Google Scholar]
- 7.Lipscomb WN. Adv Enzymol. 1994;68:67–151. doi: 10.1002/9780470123140.ch3. [DOI] [PubMed] [Google Scholar]
- 8.Svergun DI, Barberato C, Koch MHJ, Fetler L, Vachette P. Protein Struct Funct Genet. 1997;27:110–117. [PubMed] [Google Scholar]
- 9.Beck DA, Kedzie KM, Wild JR. J Biol Chem. 1989;264:16629–16637. [PubMed] [Google Scholar]
- 10.Liu L, Wales ME, Wild JR. Biochemistry. 1997;36:3126–3132. doi: 10.1021/bi962065d. [DOI] [PMC free article] [PubMed] [Google Scholar]
- 11.Shanley MS, Foltermann KF, O’Donovan GA, Wild JR. J Biol Chem. 1984;259:12672–12677. [PubMed] [Google Scholar]
- 12.Foltermann KF, Beck DA, Wild JR. J Bacteriol. 1986;67:285–290. doi: 10.1128/jb.167.1.285-290.1986. [DOI] [PMC free article] [PubMed] [Google Scholar]
- 13.Wild JR, Wales ME. Annu Rev Microbiol. 1990;44:193–218. doi: 10.1146/annurev.mi.44.100190.001205. [DOI] [PubMed] [Google Scholar]
- 14.Wild JR, Grimsley JK, Kedzie KM, Loughrey SJ, Wales ME. In: Chemical Aspects of Enzyme Biotechnology. Baldwin TO, et al., editors. Plenum; New York: 1990. pp. 95–109. [Google Scholar]
- 15.Liu L, Wales ME, Wild JR. J Mol Biol. 1998;282:891–901. doi: 10.1006/jmbi.1998.2054. [DOI] [PMC free article] [PubMed] [Google Scholar]
- 16.Van Vliet F, Xi XG, De Staercke C, De Wannemaeker B, Jacobs A, Cherfils J, Ladjimi MM, Hervé G, Cunin R. Proc Natl Acad Sci USA. 1991;88:9180–9183. doi: 10.1073/pnas.88.20.9180. [DOI] [PMC free article] [PubMed] [Google Scholar]
- 17.Xi XG, De Staercke C, Van Vliet F, Triniolles F, Jacobs A, Stas PP, Ladjimi MM, Simon V, Cunin R, Hervé G. J Mol Biol. 1994;242:139–149. doi: 10.1006/jmbi.1994.1565. [DOI] [PubMed] [Google Scholar]
- 18.Nowlan SF, Kantrowitz ER. J Biol Chem. 1985;260:14712–14716. [PubMed] [Google Scholar]
- 19.Deng WP, Nickoloff JA. Anal Biochem. 1992;200:81–88. doi: 10.1016/0003-2697(92)90280-k. [DOI] [PubMed] [Google Scholar]
- 20.Wales ME, Hoover TA, Wild JR. J Biol Chem. 1988;263:6109–6114. [PubMed] [Google Scholar]
- 21.Prescott LM, Jones ME. Anal Biochem. 1969;32:408–419. doi: 10.1016/s0003-2697(69)80008-4. [DOI] [PubMed] [Google Scholar]
- 22.Ellis KJ, Morrison JF. Methods Enzymol. 1982;87:405–426. doi: 10.1016/s0076-6879(82)87025-0. [DOI] [PubMed] [Google Scholar]
- 23.Tauc P, Leconte C, Kerbiriou D, Thiry L, Hervé G. J Mol Biol. 1982;155:155–168. doi: 10.1016/0022-2836(82)90442-9. [DOI] [PubMed] [Google Scholar]
- 24.Tanner JJ, Smith PE, Krause KL. Protein Sci. 1993;2:927–935. doi: 10.1002/pro.5560020606. [DOI] [PMC free article] [PubMed] [Google Scholar]
- 25.Sayle RA, Milner-White EJ. Trends Biochem Sci. 1995;20:374–376. doi: 10.1016/s0968-0004(00)89080-5. [DOI] [PubMed] [Google Scholar]
- 26.Kraulis PJ. J Appl Crystallogr. 1991;24:946–950. [Google Scholar]