

Abstract
Purpose
To describe physical activity (PA) levels by race/ethnicity, age, gender, and weight status in a representative sample of U.S. youth.
Methods
Cross-sectional data from the 2003–4 and 2005–6 National Health and Nutrition Examination Survey (NHANES) were combined and analyzed. Youth ages 6 to 19 with at least 4 10-hour days of PA measured by accelerometry were included (N=3,106). Outcomes included mean counts per minute and minutes spent in moderate to vigorous PA (MVPA).
Results
6 to 11 year olds spent more time (88 min/day) in MVPA than 12 to 15 (33 min/day) and 16–19 (26 min/day) year olds (p<.001 for both). Females spent fewer min/day in MVPA than males (p<.001). Overall, obese youth spent 16 fewer min/day in MVPA than normal weight youth. However, non-Hispanic White (NHW) males spent 3–4 fewer min/day in vigorous PA than Mexican American (MA) (p=.004) and non-Hispanic Black (NHB) (p<.001) males but had lower obesity rates; and obese 12 to 15 year old MA recorded similar minutes in MVPA per day as normal weight MA (p>.050). There was a significant 3-way age-BMI-race/ethnicity interaction for mean min/day in MVPA (p<.001). Adjustment for total energy intake did not qualitatively alter these results.
Conclusion
Females and older youth were the least active groups. Obese youth were generally less active, but this did not hold uniformly across race/ethnic groups. Cultural or biological factors could moderate the association between PA and obesity in youth.
Keywords: NHANES, Moderate To Vigorous, Accelerometer, BMI, Adolescent
INTRODUCTION
Surveillance results from 2003–6 indicated 31.9% of United States youth had BMI greater than or equal to the 85th percentile (34). Despite recent data indicating a plateau in the previously upward trend in overweight and obesity in U.S. youth, obesity still represents a significant health risk (33, 34). Elevated body mass index (BMI) is related to an increased risk for type 2 diabetes, elevated cholesterol, and high blood pressure in youth (23, 38). These findings coupled with the fact that obesity has been shown to track into adulthood (44), place overweight and obese youth at a significant health risk as they progress into adulthood.
There is evidence of an inverse relationship between weight status and physical activity in youth (37). For example, BMI increases were associated with more television viewing and declines in moderate to vigorous physical activity (MVPA) in longitudinal studies (3, 31). There is also evidence for a decline in physical activity with age, particularly in adolescent females (32, 42). Energy intake may also be associated with weight status and physical activity (13, 22). For example, energy intake was negatively correlated with fat mass index and positively correlated with MVPA in a diverse sample of youth (21).
However, findings on race/ethnic differences in physical activity are less clear. While a previous study has reported lower levels of physical activity (measured via self-report) in non-Hispanic Black youth as compared to their non-Hispanic White counterparts (39), another that measured physical activity via accelerometry has reported that non-Hispanic White youth are less physically active than other race/ethnic groups (35). The objective of this study is to report differences in physical activity by race/ethnicity, age, gender, and weight status in a nationally representative sample of U.S. youth. Strengths of this analysis include the large sample size, the national representativeness of the data set, objectively measured physical activity data and the availability of data on total energy intake obtained from two 24-hour recalls.
METHODS
Sample
Data for this study are from the National Health and Nutrition Examination Survey (NHANES), a cross-sectional health interview survey representative of the U.S. civilian, non-institutionalized population. The NHANES is administered by the National Center for Health Statistics (NCHS) of the Centers for Disease Control and Prevention (CDC). Data are collected year-round using a complex, stratified, multistage probability cluster sampling design strategy. Details of sampling and data collection have been reported previously (10, 42). Public-use data are released in two-year cycles. Accelerometer measurement was included in both the 2003–4 and 2005–6 survey cycles.
The present study focused on youth aged 6 to 19 years. The sample consisted of 1,508 participants from the 2003–4 cycle and 1,598 participants from the 2005–6 cycle. Preliminary data analysis indicated no statistically significant differences in the outcome variables of interest between the 2003–4 and 2005–6 samples. Therefore, the samples were combined. Participants were included if they had no missing demographic or anthropometric data and at least four days with 10 or more hours of accelerometer data (42). The final analytic sample consisted of 3,106 participants between 6 and 19 years of age with complete accelerometer, demographic, and anthropometric data. Based on survey design characteristics, results for non-Hispanic White, non-Hispanic Black, and Mexican American race/ethnic groups were estimable. The NCHS ethics review board approved the study and written informed consent was obtained from all participants. The University of Southern California IRB did not require review for this analysis.
Measures
Demographics
Age (years) was calculated as the time between birth and examination date. Race/ethnicity was self-reported by participants & categorized as non-Hispanic White, non-Hispanic Black, Mexican American, Other Hispanic, and Other. Age and racial/ethnic groups were categorized according to the NHANES analytic guidelines (11). Socioeconomic status was calculated using the poverty to income ratio (PIR), which is a ratio of the household income to the Census Bureau poverty threshold that is adjusted for family size and updated annually to adjust for inflation.
Anthropometrics
Standing height (cm) and weight (kg) were used to calculate BMI (kg·m−2). BMI percentiles were defined for normal, overweight, and obese categories according to the age- and gender- specific growth charts published by the CDC (26). Normal weight is defined as between the 5th to less than the 85th percentile, overweight is defined as between the 85th to less than the 95th percentile, and obese is defined as at or above the 95th percentile.
Physical Activity
All ambulatory participants over the age of 6 years were asked to wear an Actigraph (Actigraph, LLC; Ft. Walton Beach, FL) model 7164 accelerometer on the right hip. The uniaxial accelerometer measures acceleration intensity as ‘counts’ in response to body movement. Details on the accelerometer protocol, data reduction process, and the definition of wear time have been reported previously (30, 42). Similar to previous studies using accelerometer data, a valid day was considered to be 10 or more hours of wear time and participants with at least 4 valid days were included in the present study (7, 42). Accelerometer data is presented here as: a) mean counts per minute; and b) as estimates of mean minutes per day in sedentary behavior, moderate, vigorous, and moderate to vigorous physical activity (MVPA). The thresholds for moderate (4 METs) and vigorous (7 METs) physical activity were age-adjusted using the criteria from Freedson et al. (43) for participants between the ages of 6 and 17. The thresholds for moderate (3 METs) and vigorous (6 METs) physical activity were used for participants older than 18, and are defined at 2020 counts per minute and 5999 counts per minute, respectively (5, 20, 28, 42, 47). A sedentary behavior cut point of 100 counts per minute was applied to all age groups (30).
Dietary Intake
Diet was assessed by up to two interviewer-administered 24-hour dietary recalls. The first recall was obtained in person; the second (if available) was obtained via telephone. Measurement tools such as food workbooks, bowls, glasses, and plastic foods were used to help participants give more accurate estimates of intake (12). Proxy interviews were conducted for children under 9 and children 9 to 11 were permitted to receive assistance from an adult. Participants were included in the dietary analyses if they had at least one day of valid diet data. There were 131 participants excluded due to unreliable or missing dietary data.
Statistical Analyses
All analyses were conducted in SAS 9.1 (SAS Institute, Inc., Cary, NC), using specialized procedures to account for the sample weighting and complex multistage probability design. The NHANES-provided sample weights were adjusted to account for the combination of data from 2003–4 and 2005–6 and for the sub-sampling of individuals with at least 4 valid days of accelerometer data. Time spent in each activity level (i.e.: moderate, vigorous, and MVPA) was calculated per person by summing each minute with a count above the threshold for that activity level. Per person mean counts per minute were calculated by dividing the sum of counts each day by the wear time minutes each day across all valid days. Population mean estimates and associated standard errors (SE) of minutes and counts, adjusted for categorized poverty to income ratio, were calculated with the SAS SURVEYREG procedure using the Taylor series linearization method (45). Planned comparisons of mean counts per minute between each data collection year and between subpopulations were made with pairwise contrasts.
To further identify differences in mean minutes spent in MVPA within subgroups, the data was stratified by gender and a 3-way race/ethnic-age group-BMI percentile interaction was examined using the SUVEYREG procedure (adjusting for categorized poverty to income ratio). Linear regression using age, BMI percentile, and poverty to income ratio as continuous variables was conducted to understand the magnitude of the effect of each variable on mean minutes per day spent in MVPA. To predict the odds of reaching the 2008 Physical Activity Guidelines of 60 minutes per day of MVPA for youth ages 6 to 17 years or 21 minutes per day for older youth ages 18 to 19 years (based on the recommendation adults perform 150 minutes/week MVPA, or an average of 21 minutes/day)(44) logistic regression was conducted using the SURVEYLOGISTIC procedure adjusting for categorized poverty to income ratio. Significance was set at alpha = .05 and 30 degrees of freedom, which is the number of primary sampling units (11).
Additional analyses were conducted to examine whether dietary intake might confound the relationship between activity levels and weight status. Crude assessment was performed by adding individual mean reported energy intake as an additional covariate to the SURVEYREG models of accelerometer minutes on weight status, race/ethnicity, and categorized poverty to income ratio. Because the distribution of mean energy intake was right-skewed, the same models were run using individual averages of Box-Cox transformed energy intakes. The Box-Cox parameter value of .21 (the fifth root) approximately normalized the distribution of the residuals of energy intake regressed on weight status, race/ethnicity, and categorized poverty to income ratio.
Recognizing that the mean of one or two 24-hour recalls does not reflect long-term intake (16), a full regression calibration approach (9) was used to fit regression models of accelerometer minutes on weight status, race/ethnicity, categorized poverty to income ratio, and predicted long-term average transformed energy intake. The calibration model for long-term average transformed intake included weight status, race/ethnicity, categorized poverty to income ratio, 24-hour recall sequence (in person vs. by telephone), and recall day (weekend vs. weekday). Both recall sequence and day assist with modeling long-term energy intake but were not required in the models for accelerometer minutes because the physical activity data were not modeled on the day level. Because the regression calibration approach required an additional modeling step to predict energy intake, the SURVEYREG procedure could not be used to obtain correct standard errors or significance tests. Therefore, standard errors for the calibrated models were computed using balanced repeated replication (BRR) (25) with 32 replicate weight sets post-stratified by age, sex, and race/ethnicity based on the original analytic sample weights. The perturbation factor was f = 0.7 (25).
RESULTS
General Results
The characteristics of the sample are presented in Table 1 by race/ethnicity and gender. Of the 5,687 participants with accelerometer data, 3,698 met the inclusion criteria of having 4 days (10 hours/day) of valid data. Of these, 99 underweight youth were excluded, 453 had invalid demographic data, and 40 had invalid anthropometric data. The participants with invalid physical activity data significantly differed from those with valid physical activity data on demographic characteristics; however the sample was re-weighted based on the inclusion criteria of 4 or more 10-hour days of valid data. The analytical sample (N = 3,106) was 49.5% female, 69.9% non-Hispanic White, 16.6% non-Hispanic Black, and 13.5% Mexican American. Similar to previous studies using NHANES data (34) 19.2% of youth ages 6 to 19 were obese and 17.0% were overweight. The highest prevalence of obesity by race/ethnic group and gender was in non-Hispanic Black females, Mexican American males, and Mexican American females. Obesity prevalence was highest in 16 to 19 year olds and lowest in 6 to 11 year olds. For the analyses including total energy intake, 2,975 had one or more days of valid dietary data. Irrespective of form (individual means or calibrated), energy intake was not statistically significant in the regression equations for accelerometer minutes. The energy-adjusted mean minutes spent in each activity level by weight status differed by less than 4% from the unadjusted means (data not shown).
Table 1.
Characteristics (mean and standard error) of the analyzed sample for 2003–2006
| Variable* | Non-Hispanic White
|
Non-Hispanic Black
|
Mexican American
|
Total Sample† | |||
|---|---|---|---|---|---|---|---|
| Male | Female | Male | Female | Male | Female | ||
| N | 416 | 428 | 605 | 522 | 548 | 587 | 3106 |
| Age (yr) 1 | 12.3 (0.2) | 12.5 (0.2) | 12.4 (0.2) | 12.5 (0.3) | 11.9 (0.2) | 12.0 (0.2) | 12.4 (0.1) |
| 6 – 112 | 159 | 173 | 190 | 174 | 197 | 223 | 1116 |
| 69.2 (3.6) | 67.9 (3.4) | 16.0 (2.3) | 16.9 (2.4) | 14.8 (2.4) | 15.2 (1.8) | 42.0 (1.6) | |
| 12 – 152 | 146 | 134 | 222 | 188 | 195 | 221 | 1106 |
| 71.9 (3.6) | 69.4 (3.8) | 15.7 (2.3) | 16.7 (2.4) | 12.4 (2.1) | 13.9 (2.4) | 33.3 (0.9) | |
| 16 – 192 | 111 | 121 | 193 | 160 | 156 | 143 | 884 |
| 69.7 (3.5) | 72.7 (3.7) | 18.1 (2.8) | 16.7 (3.2) | 12.2 (1.7) | 10.5 (1.7) | 24.7 (1.5) | |
|
| |||||||
| Height (cm) 1 | 155.4 (1.0) | 151.4 (0.8) | 156.4 (0.8) | 151.6 (0.9) | 151.2 (0.9) | 147.0 (0.9) | 153.0 (0.6) |
| Weight (kg) 1 | 53.6 (1.1) | 50.6 (1.1) | 55.6 (0.9) | 54.8 (1.6) | 51.2 (1.2) | 48.9 (0.9) | 52.4 (0.8) |
|
| |||||||
| BMI Percentile1‡ | 65.1 (1.4) | 64.4 (1.8) | 64.5 (1.6) | 70.6 (1.1) | 66.9 (1.2) | 68.4 (1.3) | 65.6 (0.9) |
| Normal2 | 277 | 291 | 406 | 309 | 328 | 369 | 1980 |
| (5th to <85th %) | 66.2 (2.8) | 67.8 (2.5) | 66.0 (2.5) | 58.9 (1.5) | 60.0 (1.6) | 63.3 (2.4) | 63.7 (1.1) |
| Overweight2 | 70 | 79 | 100 | 84 | 102 | 94 | 529 |
| (85th to <95th %) | 17.6 (2.1) | 18.9 (1.5) | 16.9 (1.3) | 15.9 (1.4) | 18.3 (1.4) | 15.7 (1.5) | 17.1 (0.7) |
| Obese2 | 69 | 58 | 99 | 129 | 118 | 124 | 597 |
| (≥95th %) | 16.2 (1.9) | 13.3 (2.2) | 17.1 (1.8) | 25.2 (1.7) | 21.7 (1.9) | 20.9 (1.9) | 19.2 (0.9) |
Weighted values account for survey design, sampling strategy, & reweighting for those with 4+ days of data; unless otherwise noted, the standard error of the mean is presented in parentheses.
Includes both genders & all race/ethnic groups.
N represents actual number sampled.
Values represent mean (standard error).
Values represent percent (standard error of percent). BMI= Body Mass Index.
Defined by the 2000 CDC age- and gender- specific cut points (Kuczmarski et al., 2002).
Mean Activity Counts per Minute
Non-Hispanic White youth recorded fewer mean counts per minute than non-Hispanic Black and Mexican American youth and counts per minute consistently declined with age. Youth in the 6 to 11 age group demonstrated higher mean counts per minute than youth in both the 12 to 15 and 16 to 19 age groups (p<.001 for both); and youth in the 12 to 15 age group had higher mean counts per minute than youth in the 16 to 19 age group (p<.001) (Table 2). Females always had lower mean counts per minute than males independent of race/ethnicity and weight status (p<.001). Overweight non-Hispanic Black males recorded 67 more counts per minute per day than overweight Mexican American males (p=.037) and 104 more counts per minute per day than overweight non-Hispanic White males (p=.002) (Table 3). Normal weight youth of all race/ethnic groups had on average 87 more counts per minute than obese youth (p<.001). This difference was constant across all race/ethnic groups with the exception of overweight and obese Mexican American females who recorded similar counts per minute.
Table 2.
Mean (standard error) counts per minute by race/ethnicity, age group, and BMI percentile category1
| Age Group (yr) | 6–11 | 12–15§ | 16–19§ | |
|---|---|---|---|---|
| Normal (5th to <85th %) | Non-Hispanic White | 652.0 (13.6) †‡ | 453.8 (14.0) * | 386.6 (15.9) * |
| Non-Hispanic Black | 695.7 (16.0) ‡c | 465.3 (14.9) ‡ * | 393.7 (12.7) ‡ * | |
| Mexican American | 644.7 (17.6) †‡c | 455.5 (17.0) † * | 404.1 (11.2) ‡ * | |
| All Ethnicities | 657.6 (11.1) †‡ | 455.9 (10.7) * | 389.5 (12.2) ‡ * | |
| Overweight (85th to <95th %) | Non-Hispanic White | 561.0 (26.7) †a | 411.6 (19.3) † *a | 343.3 (25.9) * b |
| Non-Hispanic Black | 668.4 (30.5) ¶ac | 485.2 (23.7) ¶ * ac | 381.1 (21.9) * | |
| Mexican American | 570.8 (21.4) †c | 407.0 (16.6) †c | 427.8 (22.1) ¶b | |
| All Ethnicities | 579.5 (21.6) †¶ | 421.0 (16.4) * | 361.2 (20.1) * | |
| Obese (≥95th %) | Non-Hispanic White | 523.0 (31.1) ‡ | 408.2 (35.6) | 372.9 (21.1) |
| Non-Hispanic Black | 518.6 (26.3) ‡¶ | 424.6 (16.5) ‡¶ * | 345.1 (13.8) ‡ * | |
| Mexican American | 534.4 (16.2) ‡ | 447.9 (12.6) * | 358.4 (17.9) ‡¶ * | |
| All Ethnicities | 524.5 (16.8) ‡¶ | 416.8 (23.6) * | 364.8 (12.7) ‡ * | |
BMI= Body Mass Index; defined by the 2000 CDC age- and gender- specific cut points (Kuczmarski et al., 2002).
6–11 differ from both 12–15 and 16–19 (p<.050) within all activity levels.
12–15 differ from 16–19 (p<.050).
The letters and weight status symbols indicate statistically significant differences within activity levels by columns.
Normal weight and overweight differ by p<.050.
Normal weight and obese differ by p<.050.
Overweight and obese differ by p<.050.
Non-Hispanic White differ from non-Hispanic Black by p<.050.
Non-Hispanic White differ from Mexican American by p<.050.
Non-Hispanic Black differ from Mexican American by p<.050.
Table 3.
Mean (standard error) counts per minute by race/ethnicity, gender, & BMI percentile category1
| Gender | Male§ | Female | Both Genders | |
|---|---|---|---|---|
| Normal (5th to <85th %) | Non-Hispanic White | 567.6 (12.8) †‡a | 476.5 (14.7) †‡ | 522.8 (9.1) †‡ |
| Non-Hispanic Black | 610.1 (15.3) ‡a | 465.9 (19.2) | 542.9 (14.8) ‡ | |
| Mexican American | 608.2 (18.3) †‡ | 454.6 (13.9) | 530.7 (13.1) †‡ | |
| All Ethnicities | 579.6 (10.6) †‡ | 472.1 (11.2) †‡ | 527.0 (7.1) †‡ | |
| Overweight (85th to <95th %) | Non-Hispanic White | 500.0 (21.9) †a | 403.1 (16.8) † | 451.2 (13.3) †ab |
| Non-Hispanic Black | 604.0 (23.7) ¶ac | 449.8 (17.6) | 530.2 (16.0) ¶ac | |
| Mexican American | 536.6 (19.5) †c | 433.4 (20.1) | 489.8 (13.0) †bc | |
| All Ethnicities | 521.4 (19.3) †¶ | 413.6 (12.0) † | 468.2 (11.6) †¶ | |
| Obese (≥95th %) | Non-Hispanic White | 488.5 (25.6) ‡ | 378.7 (28.3) ‡ | 440.5 (21.5) ‡ |
| Non-Hispanic Black | 493.2 (23.5) ঠ| 410.1 (23.2) | 444.2 (18.4) ঠ| |
| Mexican American | 507.4 (14.5) ‡ | 435.3 (11.4) | 472.7 (11.1) ‡ | |
| All Ethnicities | 492.5 (17.1) ‡¶ | 396.7 (15.8) ‡ | 446.8 (12.6) ‡¶ | |
BMI= Body Mass Index; defined by the 2000 CDC age- and gender- specific cut points (Kuczmarski et al., 2002).
Males and females in all race/ethnic & BMI percentile categories differ by p<.010.
The letters and weight status symbols indicate statistically significant differences within activity levels by columns.
Normal weight and overweight differ by p<.050.
Normal weight and obese differ by p<.050.
Overweight and obese differ by p<.050.
Non-Hispanic White differ from non-Hispanic Black by p<.050.
Non-Hispanic White differ from Mexican American by p<.050.
Non-Hispanic Black differ from Mexican American by p<.050.
Mean Minutes in Activity Levels
The 6 to 11 age group recorded 88 minutes of MVPA per day whereas youth 12 to 15 and 16 to 19 recorded 33 and 26 minutes of MVPA per day, respectively (Table 4). The 6 to 11 age group also spent fewer minutes in sedentary behavior, and more minutes in moderate PA and vigorous PA per day than the 12 to 15 and the 16 to 19 age groups across all race/ethnic groups (p<.001 for both). Mexican American 12 to 15 year olds were the most inactive race/ethnic subgroup, spending 280 minutes per day in sedentary behavior. Non-Hispanic White youth spent fewer minutes in vigorous PA than both non-Hispanic Black and Mexican American youth (p<.001 and p=.004, respectively) (Table 5). Females spent fewer minutes in MVPA than males (p<.001) and 7 more minutes per day in sedentary behavior than males (p=.007). Normal weight youth spent more minutes in moderate PA, vigorous PA, and MVPA (p<.001 for all) than obese youth (Table 6). Normal weight non-Hispanic White youth spent 7 fewer minutes in sedentary behavior per day than normal weight non-Hispanic Black and Mexican American youth (p=.011 and p=.003, respectively). Multivariable linear regression with continuous variables indicated that age was inversely associated with MVPA in all race/ethnic groups for both genders (p<.001 for all) (Table 7). Similarly, BMI percentile was negatively associated with MVPA in all race/ethnic groups for both genders (p<.050 for all) however the effect was not as strong as age. Age, BMI percentile, and poverty to income ratio accounted for 44% of the variance in males and 49% of the variance in females.
Table 4.
Mean (standard error) minutes per day above specified thresholds1 for sedentary behavior, moderate, vigorous, & moderate + vigorous physical activity by race/ethnicity and age group
| Age Group (yr) | 6–11 | 12–15§ | 16–19§ | |
|---|---|---|---|---|
| Sedentary | Non-Hispanic White | 219.3 (2.4) b | 266.3 (3.6) ab | 272.6 (5.3) |
| Non-Hispanic Black | 224.9 (5.5) | 271.7 (3.2) ac | 276.7 (3.0) | |
| Mexican American | 228.9 (2.3) b | 280.4 (2.8) * bc | 269.6 (2.8) * | |
| All Ethnicities | 221.7 (2.1) | 269.0 (3.0) | 273.0 (3.8) | |
| Moderate | Non-Hispanic White | 74.1 (2.0) | 27.4 (1.2)*ab | 22.0 (1.6) *a |
| Non-Hispanic Black | 79.7 (2.7) c | 33.5 (1.8) * a | 26.7 (2.1) *a | |
| Mexican American | 71.4 (1.6) c | 32.3 (1.7) * b | 26.2 (1.6) * | |
| All Ethnicities | 74.7 (1.4) | 29.0 (1.0) * | 23.3 (1.3) * | |
| Vigorous | Non-Hispanic White | 12.4 (0.7) a | 4.0 (0.4)*ab | 2.3 (0.4) * |
| Non-Hispanic Black | 17.0 (0.8) ac | 5.0 (0.4) *a | 2.1 (0.3) * | |
| Mexican American | 13.6 (0.9) c | 5.0 (0.4) * b | 2.0 (0.2) * | |
| All Ethnicities | 13.3 (0.6) | 4.3 (0.3) * | 2.2 (0.3) * | |
| Moderate + Vigorous | Non-Hispanic White | 86.6 (2.4) a | 31.4 (1.5) *ab | 24.3 (1.7) * |
| Non-Hispanic Black | 96.7 (3.3) ac | 38.5 (2.1) *a | 28.8 (2.1) * | |
| Mexican American | 85.1 (2.3) c | 37.3 (2.0) * b | 28.2 (1.6) * | |
| All Ethnicities | 88.0 (1.8) | 33.3 (1.3) * | 25.5 (1.4) * | |
Physical activity categories were based on age-specific criteria for moderate and vigorous intensity for ages 6–17 years (Trost et al., 2002); for ages 18 & older: moderate intensity cut point = 2020 cpm & vigorous intensity cut point = 5999 cpm (Troiano et al., 2008); sedentary cut point = 100 cpm for all ages (Matthews et al., 2008).
6–11 differ from both 12–15 and 16–19 (p<.050) within all activity levels.
12–15 differ from 16–19 (p<.050). The letters and weight status symbols indicate statistically significant differences within activity levels by columns.
Normal weight and overweight differ by p<.050.
Normal weight and obese differ by p<.050.
Overweight and obese differ by p<.050.
Non-Hispanic White differ from non-Hispanic Black by p<.050.
Non-Hispanic White differ from Mexican American by p<.050.
Non-Hispanic Black differ from Mexican American by p<.050.
Table 5.
Mean (standard error) minutes per day above specified thresholds1 for sedentary behavior, moderate, vigorous, & moderate + vigorous physical activity by race/ethnicity and gender
| Gender | Male | Female | Both Genders | |
|---|---|---|---|---|
| Sedentary | Non-Hispanic White | 245.9 (2.7) b | 251.4 (3.2) ab | 248.5 (2.4) ab |
| Non-Hispanic Black | 248.9 (3.7) § | 258.1 (4.0) a | 253.5 (3.5) a | |
| Mexican American | 251.2 (2.4) §b | 258.1 (2.3) b | 254.0 (1.6) b | |
| All Ethnicities | 246.9 (2.3) § | 253.4 (2.5) | 250.1 (2.1) | |
| Moderate | Non-Hispanic White | 52.4 (2.0) §a | 37.8 (1.5) | 45.3 (1.2) a |
| Non-Hispanic Black | 61.1 (2.2) §a | 40.6 (2.2) | 51.0 (1.9) a | |
| Mexican American | 57.9 (1.9) § | 40.5 (1.7) | 49.3 (1.3) | |
| All Ethnicities | 54.6(1.7) § | 38.6 (0.9) | 46.8 (1.0) | |
| Vigorous | Non-Hispanic White | 8.2 (0.6) §ab | 5.8 (0.4) | 7.0 (0.4) ab |
| Non-Hispanic Black | 12.5 (0.7) §a | 6.0 (0.6) | 9.2 (0.5) a | |
| Mexican American | 11.1 (0.8) §b | 5.9 (0.6) | 8.4 (0.5) b | |
| All Ethnicities | 9.3 (0.5) § | 5.8 (0.2) | 7.6 (0.3) | |
| Moderate + Vigorous | Non-Hispanic White | 60.5 (2.4) §ab | 43.6 (1.8) | 52.3 (1.5) a |
| Non-Hispanic Black | 73.7 (2.8) §a | 46.9 (2.7) | 60.2 (2.4) a | |
| Mexican American | 69.0 (2.5) §b | 46.5 (2.7) | 57.7 (1.8) | |
| All Ethnicities | 63.8 (2.0) § | 44.4 (1.1) | 54.4 (1.2) | |
Physical activity categories were based on age-specific criteria for moderate and vigorous intensity for ages 6–17 years (Trost et al., 2002); for ages 18 & older: moderate intensity cut point = 2020 cpm & vigorous intensity cut point = 5999 cpm (Troiano et al., 2008); sedentary cut point = 100 cpm for all ages (Matthews et al., 2008). The letters and symbol indicate statistically significant differences within activity levels by columns and rows, respectively.
Males and females differ by p<.050.
Non-Hispanic White differ from non-Hispanic Black by p<.050.
Non-Hispanic White differ from Mexican American by p<.050.
Non-Hispanic Black differ from Mexican American by p<.050.
Table 6.
Mean (standard error) minutes per day above specified thresholds1 for sedentary behavior, moderate, vigorous, & moderate + vigorous physical activity by race/ethnicity and BMI percentile category2
| BMI Percentile Category | Normal (5th to <85th %) | Overweight (85th to <95th %) | Obese (≥95th %) | |
|---|---|---|---|---|
| Sedentary | Non-Hispanic White | 245.7 (3.0) ab | 256.5 (7.1) | 251.4 (6.6) |
| Non-Hispanic Black | 252.7 (3.9) a | 250.9 (4.7) | 257.6 (6.6) | |
| Mexican American | 252.3 (2.2) b | 256.9 (3.8) | 256.8 (2.8) | |
| All Ethnicities | 247.7 (2.4) | 255.7 (5.3) | 253.6 (4.8) | |
| Moderate | Non-Hispanic White | 48.5 (1.5) †‡a | 39.5 (2.9) †a | 38.0 (4.0) ‡ |
| Non-Hispanic Black | 55.3 (2.7) ‡a | 52.5 (2.9) ¶a | 37.1 (2.7) ‡¶ | |
| Mexican American | 52.4 (1.7) ‡ | 46.8 (2.7) | 42.4 (1.7) ‡ | |
| All Ethnicities | 50.1 (1.2) †‡ | 42.4 (2.4) †¶ | 38.5 (2.3) ‡¶ | |
| Vigorous | Non-Hispanic White | 8.2 (0.4) †‡a | 4.5 (0.5) †ab | 4.5 (0.7) ‡ |
| Non-Hispanic Black | 10.8 (0.8) ‡a | 9.0 (0.9) ¶a | 4.9 (0.5) ‡¶ | |
| Mexican American | 9.5 (0.7) †‡ | 7.3 (0.7) †b | 6.1 (0.4) ‡ | |
| All Ethnicities | 8.8 (0.3) †‡ | 5.6 (0.5) †¶ | 4.9 (0.4) ‡¶ | |
| Moderate + Vigorous | Non-Hispanic White | 56.8 (1.8) †‡a | 44.0 (3.2) †ab | 42.5 (4.7) ‡ |
| Non-Hispanic Black | 66.1 (3.4) ‡a | 61.6 (3.5) ¶a | 42.0 (3.2) ‡¶ | |
| Mexican American | 61.9 (2.3) †‡ | 54.1 (3.2) †b | 48.5 (2.1) ‡ | |
| All Ethnicities | 58.9 (1.4) †‡ | 48.0 (2.8) †¶ | 43.4 (2.7) ‡¶ | |
Physical activity categories were based on age-specific criteria for moderate and vigorous intensity for ages 6–17 years (Trost et al., 2002); for ages 18 & older: moderate intensity cut point = 2020 cpm & vigorous intensity cut point = 5999 cpm (Troiano et al., 2008); sedentary cut point = 100 cpm for all ages (Matthews et al., 2008).
BMI= Body Mass Index; defined by the 2000 CDC age- and gender- specific cut points (Kuczmarski et al., 2002). The letters and weight status symbols indicate statistically significant differences within activity levels by columns.
Normal weight and overweight differ by p<.050.
Normal weight and obese differ by p<.050.
Overweight and obese differ by p<.050.
Non-Hispanic White differ from non-Hispanic Black by p<.050.
Non-Hispanic White differ from Mexican American by p<.050.
Non-Hispanic Black differ from Mexican American by p<.050.
Table 7.
Multivariable linear regression model predicting MVPA (min/day)
| Males R-square= .44 |
Females R-square= .49 |
|||||
|---|---|---|---|---|---|---|
| Non-Hispanic White | Non-Hispanic Black | Mexican American | Non-Hispanic White | Non-Hispanic Black | Mexican American | |
| Intercept | 178.2 (7.8) ‡ | 214.6 (8.6) ‡ | 185.0 (8.3) ‡ | 147.4 (6.8)‡ | 167.9 (13.4) ‡ | 136.3 (6.3) ‡ |
| Age (yr) | −8.3 (0.5) ‡ | −9.4 (0.5) ‡ | −7.8 (0.4) ‡ | −7.6 (0.4)‡ | −7.9 (0.8) ‡ | −6.7 (0.4) ‡ |
| BMI (%) | −0.2 (0.1) * | −0.3 (0.1) ‡ | −0.3 (0.1) ‡ | −0.1 (0.1)* | −0.3 (0.1) ‡ | −0.1 (0.0) † |
| PIR | −1.5 (1.4) | −3.1 (1.1) † | −1.5 (1.2) | −0.4 (1.0) | −3.0 (1.2) * | −1.5 (0.7)* |
Values are beta coefficients with standard error in parentheses. MVPA= moderate to vigorous physical activity. BMI= Body Mass Index. PIR= Poverty to Income Ratio.
p< .050,
p< .010,
p< .001.
There was a statistically significant 3-way interaction for mean minutes per day spent in MVPA between age group, BMI percentile category, and race/ethnic group for both males and females (p<.001) (Figures 1 and 2). In the 12 to 15 year old Mexican American race/ethnic group, male and female overweight youth spent significantly fewer minutes in MVPA than normal weight youth (p=.022 and p=.027, respectively), however this consistent difference was not seen within the other race/ethnic groups.
Figure 1. 3-way age group-BMI-race/ethnic interaction of MVPA in males.
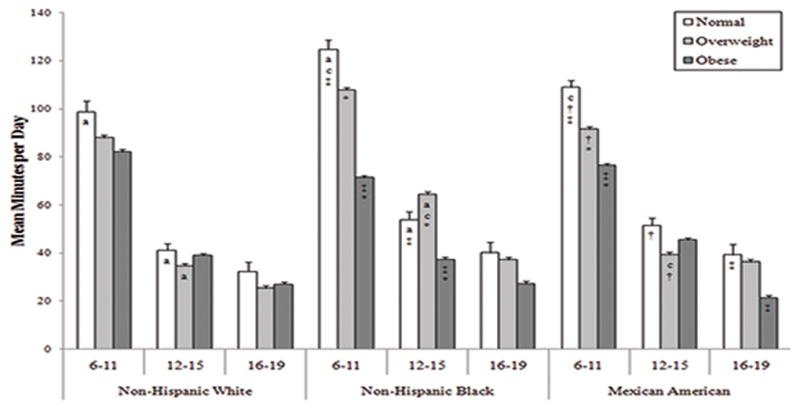
Within Race/Ethnic & Age Groups:
†Normal differ from overweight p< 0.05
‡Normal differ from obese by p< 0.05
*Overweight differ from obese by p< 0.05
Within Age Groups:
a Non-Hispanic White differ from Non-Hispanic Black p< 0.05
b Non-Hispanic White differ from Mexican American p< 0.05
c Non-Hispanic Black differ from Mexican American p< 0.05
Figure 2. 3-way age group-BMI-race/ethnic interaction of MVPA in females.
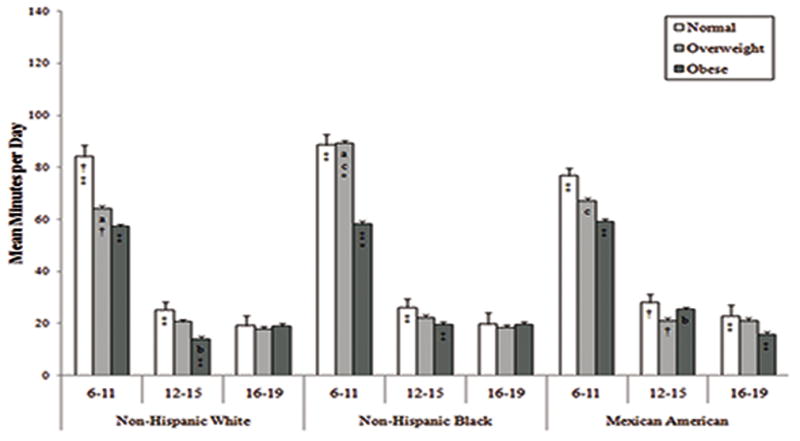
Within Race/Ethnic & Age Groups:
†Normal differ from overweight p< 0.05
‡Normal differ from obese by p< 0.05
*Overweight differ from obese by p< 0.05
Within Age Groups:
a Non-Hispanic White differ from Non-Hispanic Black p< 0.05
b Non-Hispanic White differ from Mexican American p< 0.05
c Non-Hispanic Black differ from Mexican American p< 0.05
Race/Ethnic Physical Activity Differences
By Age
Table 4 presents differences in physical activity levels by age group. Non-Hispanic White 6 to 11 (p=.018) and 12 to 15 (p=.005) year olds spent fewer minutes in MVPA than non-Hispanic Black youth of the same age groups. Non-Hispanic Black 6 to 11 year olds spent 12 more minutes per day in MVPA than Mexican American 6 to 11 year olds (p=.007). Non-Hispanic Black 12 to 15 year olds spent 9 fewer minutes in sedentary behavior than Mexican American 12 to 15 year olds (p=.040), while non-Hispanic Black 6 to 11 year olds spent 3 more minutes in vigorous PA than Mexican American 6 to 11 year olds (p=.007). Although differences in physical activity were seen in younger age groups, physical activity levels declined in the oldest age group so that youth ages 16 to 19 of all race/ethnic groups spent the same amount of time (between 24 and 29 minutes) in MVPA (p>.050).
By Gender
Table 5 presents differences in activity levels by gender. Non-Hispanic Black males spent fewer mean minutes in sedentary behavior than females of the same race/ethnic group (p=.005). Non-Hispanic White males spent fewer minutes per day in vigorous PA than both non-Hispanic Black (p<.001) and Mexican American males (p=.004). With the exception of non-Hispanic White youth, females of all race/ethnic groups spent significantly more time in sedentary behavior (p<.050) and less time in physical activity behavior (p<.050) than males.
By BMI Percentile
Table 6 presents the physical activity differences by weight status. Normal weight and overweight non-Hispanic Whites spent 9 and 18 fewer minutes in MVPA per day than normal weight and overweight non-Hispanic Blacks (p=.043 and p=.001, respectively). There were no race/ethnic differences within the obese group for any activity level. However, the only differences in minutes spent in moderate PA, vigorous PA, and MVPA between the overweight and obese groups were seen in the non-Hispanic Black race/ethnic group, where the overweight group recorded more minutes in each of the activity levels than obese youth (p<.001 for all activity levels).
Age- Gender-BMI Interaction Effects within Race/Ethnic Groups (Figures 1 & 2)
In 6 to 11 and 16 to 19 year old Mexican American males and females, obese youth spent fewer minutes in MVPA than normal weight youth (p<.016) but in the 12 to 15 Mexican American males and females, obese and normal weight youth spent statistically equivalent amounts of time in MVPA per day (p>.379). In 6 to 11 non-Hispanic Black males and females, obese youth recorded less time in MVPA than both normal weight and overweight youth. In non-Hispanic White females, 6 to 11 and 12 to 15 year old normal weight youth recorded more minutes in MVPA per day than obese youth (p<.019).
Age- Gender-BMI Interaction Effects between Race/Ethnic Groups (Figures 1 & 2)
In 6 to 11 year old females, normal weight youth spent more minutes per day in MVPA than obese youth in all race/ethnic groups (p<.050). However, in 6 to 11 year old males this difference was seen in the non-Hispanic Black (p<.001) and Mexican American (p<.001) race/ethnic groups but not in the non-Hispanic White race/ethnic group. Most of the interaction effects were seen in the youngest age group. Within the 6 to 11 year old females, the non-Hispanic White and Mexican American race/ethnic groups had the greatest differences in MVPA between the normal and obese groups however the non-Hispanic Black race/ethnic group had the greatest differences in MVPA between the overweight and obese groups.
Meeting Physical Activity Guidelines
Table 8 presents the results from the logistic regression analysis to determine which groups were more likely to meet the 2008 physical activity guidelines. In this sample, 41.4% met the recommendations. Females were less likely to adhere to the 2008 PA guidelines than males (OR = 0.41; 95% CL: 0.30–0.54). For males, those most likely to meet the 2008 PA Guidelines were non-Hispanic Black, ages 6 to 11, and of normal weight. Because females were found to be profoundly inactive, race/ethnicity did not predict whether or not they would meet the guidelines. Females in the older age groups who were obese and had a higher poverty level were less likely to meet the guidelines.
Table 8.
Logistic regression model predicting meeting the 2008 PA Guidelines1 by gender
| Males
|
Females
|
|
|---|---|---|
| Odds Ratio (95% CI) | Odds Ratio (95% CI) | |
| Race/Ethnicity (vs. Non-Hispanic White) | ||
| Non-Hispanic Black | 1.61* (1.07 – 2.42) | 1.15 (0.66 – 2.01) |
| Mexican American | 1.30 (0.84 – 2.02) | 0.74 (0.46 – 1.18) |
| Age Group (vs. 6 – 11) | ||
| 12 – 15 | 0.08* (0.06 – 0.14) | 0.02* (0.01 – 0.03) |
| 16 – 19 | 0.18* (0.12 – 0.27) | 0.16* (0.10 – 0.24) |
| BMI Category2 (vs. Normal (5th to <85th)) | ||
| Overweight (85th to <95th) | 0.52* (0.29 – 0.95) | 0.78 (0.45 – 1.35) |
| Obese (≥95th) | 0.42* (0.23 – 0.76 | 0.47* (0.28 – 0.79) |
| Poverty to Income Ratio Category (vs. <100%) | ||
| 101–199% | 1.03 (0.26 – 1.89) | 0.71 (0.46 – 1.11) |
| 200–299% | 1.32 (0.73 – 2.41) | 0.44* (0.22 – 0.89) |
| 300–399% | 1.08 (0.60 – 1.95) | 0.75 (0.44 – 1.27) |
| ≥400% | 0.62 (0.34 – 1.16) | 0.52* (0.29 – 0.92) |
Outcome modeled is ‘Yes, meeting 2008 PA Guidelines’. PA= physical activity. BMI= Body Mass Index.
Defined by the 2000 CDC age- and gender- specific cut points (Kuczmarski et al., 2002).
p< 0.05.
DISCUSSION
Based on objectively measured levels of PA, non-Hispanic White youth were the least active race/ethnic group and non-Hispanic Black youth were the most active race/ethnic group. Previous findings using self-report measures of physical activity in U.S. samples showed that non-Hispanic Black youth were the least physically active race/ethnic group (1). However, using accelerometers to measure physical activity Owen et al (2008) found that Blacks recorded four more minutes per day in MVPA than Whites (35). In our sample, non-Hispanic Black youth spent about 8 more minutes per day in MVPA than non-Hispanic White youth.
Troiano et al (2008) previously reported an age-related decline in physical activity in U.S. youth based on results from NHANES 2003–4 (42). For 2003–4 and 2005–6 survey combined samples, we also found an age-related decline in physical activity. Pate et al (2009) reported a 4% annual decline in MVPA in adolescent girls (35). Broderson et al (2007) found that physical activity dropped off between ages 11 and 12 (6). In our sample, 6 to 11 year olds participated in twice as much MVPA than the older age groups, consistent with the observation that the most dramatic age-related decline in physical activity may occur at the start of puberty.
To better understand the age-related decline in MVPA observed in this sample, the 3-way interaction between age, BMI category, and race/ethnic group was examined for each gender. Non-Hispanic Whites and Blacks in higher BMI categories spent less time in MVPA than normal weight non-Hispanic White and non-Hispanic Black youth, whereas obese 12 to 15 year old Mexican American youth recorded the same amount of time in MVPA per day as normal weight youth. A previous study in adolescent Hispanic females found a trend for normal weight Mexican American females spending fewer minutes in MVPA than overweight females (8). This suggests that BMI may interact with physical activity levels differently in Mexican American youth than in other race/ethnic groups. In the non-Hispanic White race/ethnic group, the largest difference in MVPA is between the normal and overweight groups, with the overweight and obese groups participating in approximately the same amount of MVPA. However, in the non-Hispanic Black race/ethnic group, the largest difference in MVPA is between the overweight and obese youth. Thus, the findings indicate that different race/ethnicities have different thresholds of BMI percentile past which MVPA declines.
The large difference in physical activity between males and females is particularly striking. Normal weight females of all race/ethnic groups achieved less physical activity than obese males of all race/ethnic groups. A recent study conducted in adolescents using accelerometers found that while the rates of decline of physical activity were the same for both genders, females participated in significantly fewer minutes of MVPA than males and MVPA dropped below 60 min/day one year earlier in females than in males (32). Non-Hispanic Black youth had the largest gender differences in counts per minute and minutes spent in MVPA: females recorded about 140 counts per minute and 27 minutes per day less than males. Using previous prediction equations based on overweight youth (18), this deficit is broadly similar to 600 kcal per day. The difference in physical activity levels between males and females in this sample may contribute to the fact that the non-Hispanic Black females had the highest prevalence of obesity.
Overall, the inverse association between physical activity levels and BMI percentile in this sample is consistent with previous findings (38). Contrary to our expectations, higher levels of physical activity were not associated with lower prevalence of obesity across the race/ethnic groups. Non-Hispanic White youth had lower mean counts per minute and spent fewer minutes per day in MVPA than non-Hispanic Black and Mexican American youth, yet had a lower prevalence of obesity than the other race/ethnic groups. This paradox may be accounted for by the fact that non-Hispanic White youth may spend more time in activities not captured well by accelerometry such as swimming or bicycling. These differences could also be attributed to the higher socioeconomic status found in the non-Hispanic White youth since socioeconomic status has been inversely related to obesity and positively related to physical activity (24). However, socioeconomic status was controlled for in all analyses; other factors may contribute to the pattern of obesity and physical activity in non-Hispanic White youth.
Genetic predisposition to obesity, socioeconomic status, and cultural differences in behavior may play a role in the race/ethnic differences found in this sample and elsewhere (46). Non-Hispanic Black and Mexican American adults have the highest prevalence of overweight and obesity in the U.S. population (33). Children of overweight and obese parents have been shown to have higher rates of obesity than children of normal weight parents (4). Furthermore, non-Hispanic Black and Mexican American females have been shown to have lower basal metabolic rates and expend less activity energy than non-Hispanic White females which may put them at higher risk for overweight and obesity (17). Dietary intake may also account for the differences in the obesity prevalence between non-Hispanic White youth and the minority race/ethnic groups, particularly given that there are race/ethnic differences in the consumption of unhealthy foods. Arcan et al (2009) found that non-Hispanic Black high school students were more likely to consume sugar-sweetened beverages and high-fat foods than other race/ethnic groups (2). The higher rate of obesity in non-Hispanic Blacks may be explained by a higher intake of unhealthy foods, particularly in non-Hispanic Black females who have been found to have the lowest levels of physical activity and highest intakes of unhealthy foods (27).
In this study adjustment for reported energy intake did not moderate the associations between total physical activity and age, race/ethnicity, or weight status and physical activity levels. Non-Hispanic White youth reported significantly higher energy intake than the other race/ethnic groups, and normal weight youth reported significantly higher energy intake than overweight or obese youth. Differences across weight status may be due to differential underreporting of energy intake (29, 41), while differences across race/ethnicity may be due to a combination of differential misreporting and actual differences in true intake. Although the observed differences suggest that energy intake was a potential confounder, analysis determined that it was not confounding the relationship between weight status and race/ethnicity and physical activity levels. Further analysis of the association between patterns of food intake and physical activity could be of interest because of the high quality data available in this survey.
No other past study that we are aware of has described race/ethnic differences in objectively measured physical activity in large representative sample of U.S. youth, however several limitations to the present study merit discussion. First, this is a cross-sectional analysis, thus we cannot determine any causal associations. However, the large sample size allows robust estimates of associations between variables of interest and may help inform future longitudinal studies. Second, accelerometers do not capture all types of physical activity (40). However, accelerometers are considered to be an excellent objective measurement of physical activity in youth because they minimize self-report bias and eliminate human error in recalling previous physical activity (14). Third, the accelerometers do not record the type of physical activity as do self-report measures, which prevents us from exploring the frequency of specific behaviors (i.e.: TV viewing) that could explain the observed differences in physical activity levels among race/ethnic groups. Fourth, the NHANES survey is designed to sample the three largest race/ethnic groups in the U.S. and therefore does not provide data sufficient for a national estimate for other minority groups such as Asians or other non-Mexican Hispanic populations that comprise a significant and growing proportion of the U.S. population. Finally, BMI percentile category is used here as a proxy measure of adiposity. While some findings indicate that it is not an accurate measure of body fat for all race/ethnic groups, Flegal et al (2009) recently demonstrated that it corresponds well with percent body fat in an adult sample (19) and BMI has been shown to be significantly correlated with percent body fat in youth (36). Furthermore, BMI percentile is a cost efficient and feasible measure in a large population-based study (15).
As measured by accelerometry, non-Hispanic White youth engaged in less physical activity than both non-Hispanic Black and Mexican American youth yet had the lowest prevalence of obesity in this sample. Also, non-Hispanic Black females are the least physically active and have the highest prevalence of obesity in this sample. Mexican American 12 to 15 year old obese and normal weight youth had the same amount of MVPA. Explanations for differences in obesity rates between youth of different race/ethnic groups must be influenced by other factors than variations in physical activity levels.
Acknowledgments
Funding: This work was supported by the National Institutes of Cancer (NCI), NCI Centers for Transdisciplinary Research on Energetics and Cancer (TREC, U54 CA 116848)
This work was supported by the University of Southern California Center for Transdisciplinary Research on Energetics and Cancer (NCI U54 CA 116848). NCI reviewed and approved this article before submission. The findings and conclusions in this article are those of the authors and do not necessarily represent the views of the funding agency. The results of the present study do not constitute endorsement by ACSM. No author reports any conflicts of interest.
References
- 1.Anderson S, Economos C, Must A. Active play and screen time in us children aged 4 to 11 years in relation to sociodemographic and weight status characteristics: A nationally representative cross-sectional analysis. BMC Public Health. 2008;8(1):366. doi: 10.1186/1471-2458-8-366. [DOI] [PMC free article] [PubMed] [Google Scholar]
- 2.Arcan C, Kubik MY, Fulkerson JA, Story M. Sociodemographic differences in selected eating practices among alternative high school students. J Am Diet Assoc. 2009 May;109(5):823–9. doi: 10.1016/j.jada.2009.02.001. [DOI] [PMC free article] [PubMed] [Google Scholar]
- 3.Berkey C, Rockett H, Field A, Gillman M, Frazier A, Camargo C. Activity, dietary intake, and weight changes in a longitudinal study of preadolescent and adolescent boys and girls. Pediatrics. 2000;105(4):e56. doi: 10.1542/peds.105.4.e56. [DOI] [PubMed] [Google Scholar]
- 4.Boney C, Verma A, Tucker R, Vohr B. Metabolic syndrome in childhood: Association with birth weight, maternal obesity, and gestational diabetes mellitus. Pediatrics. 2005;115(3):e290. doi: 10.1542/peds.2004-1808. [DOI] [PubMed] [Google Scholar]
- 5.Brage S, Wedderkopp N, Franks P, Bo A. Reexamination of validity and reliability of the csa monitor in walking and running. Medicine & Science in Sports & Exercise. 2003;35(8):1447. doi: 10.1249/01.MSS.0000079078.62035.EC. [DOI] [PubMed] [Google Scholar]
- 6.Brodersen N, Steptoe A, Boniface D, Wardle J, Hillsdon M. Trends in physical activity and sedentary behaviour in adolescence: Ethnic and socioeconomic differences* commentary. British journal of sports medicine. 2007;41(3):140. doi: 10.1136/bjsm.2006.031138. [DOI] [PMC free article] [PubMed] [Google Scholar]
- 7.Butte N, Puyau M, Adolph A, VOHRA F, ZAKERI I. Physical activity in nonoverweight and overweight hispanic children and adolescents. Medicine & Science in Sports & Exercise. 2007;39(8):1257. doi: 10.1249/mss.0b013e3180621fb6. [DOI] [PubMed] [Google Scholar]
- 8.Byrd-Williams C. Influence of gender, bmi and hispanic ethnicity on physical activity in children. International Journal of Pediatric Obesity. 2007;2(3):159–66. doi: 10.1080/17477160701369167. [DOI] [PubMed] [Google Scholar]
- 9.Carroll R. Measurement error in nonlinear models: A modern perspective. 2. CRC Press; 2006. pp. 65–95. [Google Scholar]
- 10.Center for Disease Control and Prevention (CDC) National health and nutrition examination survey analytic and reporting guidelines. Hyattsville, MD: U.S. Department of Health and Human Services, Centers for Disease Control and Prevention; 2006. Available from: http://www.cdc.gov/nchs/data/nhanes/nhanes_03_04/nhanes_analytic_guidelines_dec_2005.pdf. [Google Scholar]
- 11.Center for Disease Control and Prevention (CDC) National health and nutrition examination survey analytic guidelines. Hyattsville, MD: U.S. Department of Health and Human Services, Centers for Disease Control and Prevention; 2006. Available from: http://www.cdc.gov/nchs/data/nhanes/nhanes_general_guidelines_june_04.pdf. [Google Scholar]
- 12.Center for Disease Control and Prevention (CDC) MEC in-person dietary interviewers procedures manual. Hyattsville, MD: U.S. Department of Health and Human Services, Centers for Disease Control and Prevention; 2006. Available from: http://www.cdc.gov/nchs/data/nhanes/nhanes_05_06/DIETARY_MEC.pdf. [Google Scholar]
- 13.Davis JN, Alexander KE, Ventura EE, Kelly LA, Lane CJ, Byrd-Williams CE, Toledo-Corral CM, Roberts CK, Spruijt-Metz D, Weigensberg MJ. Associations of dietary sugar and glycemic index with adiposity and insulin dynamics in overweight latino youth. American Journal of Clinical Nutrition. 2007;86(5):1331. doi: 10.1093/ajcn/86.5.1331. [DOI] [PubMed] [Google Scholar]
- 14.de Leeuw E, Borgers N, Smits A. Pretesting questionnaires for children and adolescents. In: Presser S, Rothgeb J, Couper M, Lessler J, Martin E, Martin J, Singer E, editors. Methods for testing and evaluating survey questionnaires. Wiley-Interscience; 2004. pp. 409–29. [Google Scholar]
- 15.Dietz W, Robinson T. Use of the body mass index (bmi) as a measure of overweight in children and adolescents. Journal of Pediatrics. 1998;132:191–2. doi: 10.1016/s0022-3476(98)70426-3. [DOI] [PubMed] [Google Scholar]
- 16.Dodd K, Guenther P, Freedman L, Subar A, Kipnis V, Midthune D, Tooze J, Krebs-Smith S. Statistical methods for estimating usual intake of nutrients and foods: A review of the theory. Journal of the American Dietetic Association. 2006;106(10):1640–50. doi: 10.1016/j.jada.2006.07.011. [DOI] [PubMed] [Google Scholar]
- 17.Dugas L, Ebersole K, Schoeller D, Yanovski J, Barquera S, Rivera J, Durazo-Arzivu R, Luke A. Very low levels of energy expenditure among pre-adolescent mexican-american girls. International Journal of Pediatric Obesity. 2008;3(2):123–6. doi: 10.1080/17477160801902248. [DOI] [PMC free article] [PubMed] [Google Scholar]
- 18.Ekelund U, Särnblad S, Brage S, Ryberg J, Wareham N, Åman J. Does physical activity equally predict gain in fat mass among obese and nonobese young adults? International journal of obesity. 2006;31(1):65–71. doi: 10.1038/sj.ijo.0803361. [DOI] [PubMed] [Google Scholar]
- 19.Flegal K, Shepherd J, Looker A, Graubard B, Borrud L, Ogden C, Harris T, Everhart J, Schenker N. Comparisons of percentage body fat, body mass index, waist circumference, and waist-stature ratio in adults. American Journal of Clinical Nutrition. 2009;89(2):500. doi: 10.3945/ajcn.2008.26847. [DOI] [PMC free article] [PubMed] [Google Scholar]
- 20.Freedson P, Melanson E, Sirard J. Calibration of the computer science and applications, inc. Accelerometer. Medicine & Science in Sports & Exercise. 1998;30(5):777. doi: 10.1097/00005768-199805000-00021. [DOI] [PubMed] [Google Scholar]
- 21.Fulton JE, Dai S, Steffen LM, Grunbaum JA, Shah SM, Labarthe DR. Physical activity, energy intake, sedentary behavior, and adiposity in youth. American Journal of Preventive Medicine. 2009;37(1, Supplement 1):S40–S9. doi: 10.1016/j.amepre.2009.04.010. [DOI] [PMC free article] [PubMed] [Google Scholar]
- 22.Hill JO. Understanding and addressing the epidemic of obesity: An energy balance perspective. Endocrine reviews. 2006;27(7):750. doi: 10.1210/er.2006-0032. [DOI] [PubMed] [Google Scholar]
- 23.Jago R, Harrell J, McMurray R, Edelstein S, El Ghormli L, Bassin S. Prevalence of abnormal lipid and blood pressure values among an ethnically diverse population of eighth-grade adolescents and screening implications. Pediatrics. 2006;117(6):2065. doi: 10.1542/peds.2005-1716. [DOI] [PMC free article] [PubMed] [Google Scholar]
- 24.Janz K, Burns T, Levy S. Tracking of activity and sedentary behaviors in childhood the iowa bone development study. American Journal of Preventive Medicine. 2005;29(3):171–8. doi: 10.1016/j.amepre.2005.06.001. [DOI] [PubMed] [Google Scholar]
- 25.Korn E, Graubard B. Analysis of health surveys. Wiley-Interscience; 1999. p. 31. [Google Scholar]
- 26.Kuczmarski RJ, Ogden CL, Guo SS, Grummer-Strawn LM, Flegal KM, Mei Z, Wei R, Curtin LR, Roche AF, Johnson CL. CDC growth charts for the united states: Methods and development. Vital Health Stat. 2000 May;11(246):1–190. 2002. [PubMed] [Google Scholar]
- 27.Kumanyika S. Environmental influences on childhood obesity: Ethnic and cultural influences in context. Physiology & Behavior. 2008;94(1):61–70. doi: 10.1016/j.physbeh.2007.11.019. [DOI] [PubMed] [Google Scholar]
- 28.Leenders J. Evaluation of methods to assess physical activity in free-living conditions. Medicine & Science in Sports & Exercise. 2001;33(7):1233. doi: 10.1097/00005768-200107000-00024. [DOI] [PubMed] [Google Scholar]
- 29.Lissner L, Troiano R, Midthune D, Heitmann B, Kipnis V, Subar A, Potischman N. Open about obesity: Recovery biomarkers, dietary reporting errors and bmi. International journal of obesity. 2007;31(6):956–61. doi: 10.1038/sj.ijo.0803527. [DOI] [PubMed] [Google Scholar]
- 30.Matthews CE, Chen KY, Freedson PS, Buchowski MS, Beech BM, Pate RR, Troiano RP. Amount of time spent in sedentary behaviors in the united states, 2003–2004. Am J Epidemiol. 2008 April 1;167(7):875–81. doi: 10.1093/aje/kwm390. [DOI] [PMC free article] [PubMed] [Google Scholar]
- 31.McMurray RG, Ward DS, Elder JP, Lytle LA, Strikmiller PK, Baggett CD, Young DR. Do overweight girls overreport physical activity? American Journal of Health Behavior. 2008;32(5):538–46. doi: 10.5555/ajhb.2008.32.5.538. [DOI] [PMC free article] [PubMed] [Google Scholar]
- 32.Nader P, Bradley R, Houts R, McRitchie S, O’Brien M. Moderate-to-vigorous physical activity from ages 9 to 15 years. JAMA. 2008;300(3):295. doi: 10.1001/jama.300.3.295. [DOI] [PubMed] [Google Scholar]
- 33.Ogden C, Carroll M, Curtin L, McDowell M, Tabak C, Flegal K. Prevalence of overweight and obesity in the united states, 1999–2004. JAMA. 2006;295(13):1549. doi: 10.1001/jama.295.13.1549. [DOI] [PubMed] [Google Scholar]
- 34.Ogden CL, Carroll MD, Flegal KM. High body mass index for age among us children and adolescents, 2003–2006. JAMA. 2008;299(20):2401. doi: 10.1001/jama.299.20.2401. [DOI] [PubMed] [Google Scholar]
- 35.Owen CG, Nightingale CM, Rudnicka AR, Cook DG, Ekelund U, Whincup PH. Ethnic and gender differences in physical activity levels among 9–10-year-old children of white european, south asian and african-caribbean origin: The child heart health study in england (chase study) Int J Epidemiol. 2009 Aug;38(4):1082–93. doi: 10.1093/ije/dyp176. [DOI] [PMC free article] [PubMed] [Google Scholar]
- 36.Pietrobelli A, Faith M, Allison D, Gallagher D, Chiumello G, Heymsfield S. Body mass index as a measure of adiposity among children and adolescents: A validation study. The Journal of pediatrics. 1998;132(2):204–10. doi: 10.1016/s0022-3476(98)70433-0. [DOI] [PubMed] [Google Scholar]
- 37.Reichert F, Menezes A, Wells J, Dumith S, Hallal P. Physical activity as a predictor of adolescent body fatness: A systematic review. Sports Medicine. 2009;39(4):279–94. doi: 10.2165/00007256-200939040-00002. [DOI] [PubMed] [Google Scholar]
- 38.Rubin D, McMurray R, Harrell J, Hackney A, Thorpe D, Haqq A. The association between insulin resistance and cytokines in adolescents: The role of weight status and exercise. Metabolism: clinical and experimental. 2008;57(5):683. doi: 10.1016/j.metabol.2008.01.005. [DOI] [PMC free article] [PubMed] [Google Scholar]
- 39.Sirard JR, Pfeiffer KA, Dowda M, Pate RR. Race differences in activity, fitness, and bmi in female eighth graders categorized by sports participation status. Pediatr Exerc Sci. 2008 May;20(2):198–210. doi: 10.1123/pes.20.2.198. [DOI] [PubMed] [Google Scholar]
- 40.Spruijt-Metz D, Berrigan D, Kelly L, McConnell R, Dueker D, Lindsey G, Atienza A, Nguyen-Rodriguez S, Irwin M. Measures of physical activity and exercise. Handbook of Assessment Methods for Eating Behaviors and Weight-Related Problems: Measures, Theory, and Research. 2009:187. [Google Scholar]
- 41.Tooze J, Subar A, Thompson F, Troiano R, Schatzkin A, Kipnis V. Psychosocial predictors of energy underreporting in a large doubly labeled water study. American Journal of Clinical Nutrition. 2004;79(5):795. doi: 10.1093/ajcn/79.5.795. [DOI] [PubMed] [Google Scholar]
- 42.Troiano RP, Berrigan D, Dodd KW, Masse LC, Tilert T, McDowell M. Physical activity in the united states measured by accelerometer. Med Sci Sports Exerc. 2008 Jan;40(1):181–8. doi: 10.1249/mss.0b013e31815a51b3. [DOI] [PubMed] [Google Scholar]
- 43.Trost SG, Pate RR, Sallis JF, Freedson PS, Taylor WC, Dowda M, Sirard J. Age and gender differences in objectively measured physical activity in youth. Med Sci Sports Exerc. 2002 Feb;34(2):350–5. doi: 10.1097/00005768-200202000-00025. [DOI] [PubMed] [Google Scholar]
- 44.USDHHS. 2008 physical activity guidelines for americans of Work. Washington, D.C: 2008. pp. 15–26. Available from: http://www.health.gov/paguidelines/guidelines/default.aspx. [Google Scholar]
- 45.Woodruff R. A simple method for approximating the variance of a complicated estimate. Journal of the American Statistical Association. 1971;66(334):411–4. [Google Scholar]
- 46.Yang W, Kelly T, He J. Genetic epidemiology of obesity. Epidemiologic reviews. 2007;29(1):49. doi: 10.1093/epirev/mxm004. [DOI] [PubMed] [Google Scholar]
- 47.Yngve A, Nilsson A, Sjostrom M, Ekelund U. Effect of monitor placement and of activity setting on the mti accelerometer output. Medicine & Science in Sports & Exercise. 2003;35(2):320. doi: 10.1249/01.MSS.0000048829.75758.A0. [DOI] [PubMed] [Google Scholar]