Abstract
Purpose
To correlate dynamic MRI assays of macromolecular endothelial permeability with microscopic area-density measurements of vascular endothelial growth factor (VEGF) in tumors.
Methods and Material
This study compared tumor xenografts from two different human cancer cell lines, MDA-MB-231 tumors (n=5), and MDA-MB-435 (n=8), reported to express respectively higher and lower levels of VEGF. Dynamic MRI was enhanced by a prototype macromolecular contrast medium (MMCM), albumin-(Gd-DTPA)35. Quantitative estimates of tumor microvascular permeability (KPS; μl/min·100cm3), obtained using a two-compartment kinetic model, were correlated with immunohistochemical measurements of VEGF in each tumor.
Results
Mean KPS was 2.4 times greater in MDA-MB-231 tumors (KPS=58±30.9μl/min·100cm3) than in MDA-MB-435 tumors (KPS=24±8.4μl/min·100cm) (p<0.05). Correspondingly, the area-density of VEGF in MDA-MB-231 tumors was 2.6 times greater (27.3±2.2%, p<0.05) than in MDA-MB-435 cancers (10.5±0.5%, p<0.05). Considering all tumors without regard to cell type, a significant positive correlation (r=0.67, p<0.05) was observed between MRI-estimated endothelial permeability and VEGF immunoreactivity.
Conclusion
Correlation of MRI assays of endothelial permeability to a MMCM and VEGF immunoreactivity of tumors support the hypothesis that VEGF is a major contributor to increased macromolecular permeability in cancers. When applied clinically, the MMCM-enhanced MRI approach could help to optimize the appropriate application of VEGF-inhibiting therapy on an individual patient basis.
Keywords: DCE-MRI, macromolecular contrast media, endothelial permeability, immunohistochemical tumor VEGF levels, correlation
Introduction
Angiogenesis plays a pivotal role in tumor growth, tumor progression and the development of metastases (1). Vascular endothelial growth factor (VEGF) a major angiogenesis signaling molecule, stimulates endothelial cell mitoses and migration. VEGF is also recognized as being chemically identical to what was originally-termed vascular permeability factor (VPF) (2); the mitogenic and permeability-enhancing effects being discovered separately with only a subsequent recognition that VEGF and VPF were indeed the same molecule (2). The dual functionality of VEGF/VPF suggests a direct link between cancer blood vessel formation and increased vascular leakiness. If confirmed, a hypothesized cause and effect relationship between VEGF expression and degree of macromolecular permeability could be exploited using non-invasive imaging to quantitatively characterize the angiogenesis activity in a particular cancer. Newly formed cancer vessels, influenced by high VEGF activity, are already recognized to be abnormal in architecture with poorly-aligned defective endothelial cell junctions, wide fenestrations, and a lack of mural smooth muscle, factors that all potentially contribute to their observed abnormal microvascular permeability, particularly with respect to macromolecular solutes (3). Non-invasive assessments of VEGF-activity in tumors could therefore be of practical value to clinicians in their selection of patients most likely to benefit from VEGF-inhibiting drugs.
Dynamic MRI enhanced with macromolecular contrast medium (MMCM) has been applied to generate quantitative estimates of tissue vascular permeability, expressed physiologically as the coefficient of endothelial permeability (KPS, μl/min·100 cm3). In published studies using multiple experimental tumors and a prototypic MMCM, albumin-(Gd-DTPA)35 (4), DCE-MRI has been applied with success to augment the imaging differentiation of benign and malignant tumors ; to grade tumors correspondingly to their microvascular densities (MVD), a surrogate of angiogenesis ; to stratify tumors according to their pathologic aggressiveness defined by pathological Scarff-Bloom-Richardson scoring ; and to detect early cancer responses to multiple forms of angiogenesis inhibiting therapy (5, 6). However, a hypothesized mechanistic link between MRI assayed macromolecular permeability of cancer blood vessels has not been directly supported by demonstration of a positive correlation between MRI-defined macromolecular permeability and immunohistochemical VEGF expression in the same tumors. Therefore, the purpose of this study was to investigate whether dynamic MRI enhanced with macromolecular contrast media can be applied to estimate VEGF expression in tumors non-invasively by correlating MRI measurements of tumor endothelial with immunohistochemical quantifications of VEGF expression in two different tumor types.
Material and Methods
Animal Model
The study was conducted with the approval of the Institutional Committee for Animal Research and in accordance with the guidelines of the National Institute of Health. Four-week-old female athymic rats (Hsd: RH-Foxn1rnu, Harlan, Indianapolis, IN) were injected subcutaneously with 5×10⁶ cells of either MDA-MB-435 or MDA-MB-231 (ATCC, Manassas, VA), two poorly differentiated, human cancer cell lines. When tumor volumes reached 800 mm3, animals were anaesthetized by intraperitoneal injection of 35 mg/kg pentobarbital (Abbott Laboratories, North Chicago, IL) and 0.025 mL/kg buprenorphine hydrochloride (Reckitt Benckiser, Richmond, VA). A 25-gauge butterfly catheter was inserted in a tail vein for bolus injections.
Contrast-enhanced MRI and Kinetic Analyses
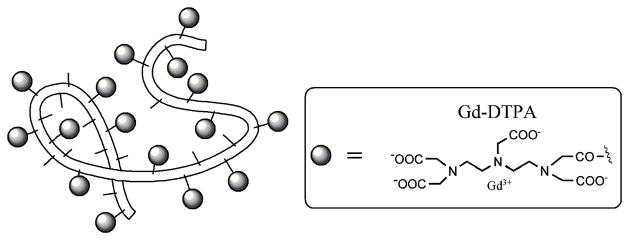
Albumin-(Gd-DTPA)35 (Figure 1), synthesized as previously published by Ogan et al. (7), with an effective molecular weight of a 180 kDa globulin and a T1-relaxivity of 11 mM−1s−1/Gd ion and 297 mM−1s−1/albumin-core was administered at a dose of 0.03 mmol Gd/kg bodyweight as a manual fast bolus. The tubing of the tail vein catheter was charged with the weight-adapted amount of albumin-(Gd-DTPA), followed by a fast manual bolus of saline (1 mL), emptying the syringe within 2 s, resulting in a flow rate of 0.5 mL/s. MRI was performed with a 2.0 Tesla CSI-II system (Bruker Instruments, Fremont, CA) on rats placed supine within a custom-built birdcage radiofrequency coil. Baseline relaxation rates (R1) of tumor tissue were calculated by curve fitting, as shown by Schwickert et al (8). Dynamic contrast-enhanced MRI was acquired over a 55 minute interval using a T1-weighted 3D-spoiled gradient refocused (SPGR) sequence with TR = 50 ms, TE = 3 ms, NA = 1, flip angle (α) = 90°, matrix = 128 × 128 × 16, field of view = 50 × 50 × 48 mm, partition thickness = 3 mm, TA = 1 minute 42 seconds per image. Data processing and analysis was performed on a Dell Precision 670 Workstation (Dell Inc., Austin, TX) with a Linux WS v.4 operating system and MR Vision Software (MR Vision Co., Winchester, MA). Regions of interest (ROI) were determined for venous (IVC) blood and the tumor periphery, defined as the outer two millimeter rim, for signal intensity (SI) measurements (9). Based on measured postcontrast signal intensities, ΔR1 values were calculated and assumed to be directly proportional to the concentration of gadolinium in the tissue (10). Kinetic analysis of the ΔR1 data generated estimates of the endothelial transfer coefficient KPS (μl/min·100 cm3) are described in detail in the literature (11). Briefly, a monoexponential function was used to fit the blood ΔR1 data, serving as a forcing function for the two-compartment bi-directional kinetic model used to fit the tumor ΔR1 data (Figure 2). Both blood and tissue models were fit to the data concurrently using the SAAM II software (SAAM Institute, Seattle, WA) that employs a weighted, non-linear least squares estimation algorithm.
Figure 1.
Schematic structure of albumin-(Gd-DTPA)35. The belt-like random coil represents the human albumin core structure with amino-containing side chains of the lysine residues (small sticks) to which Gd-DTPA (grey ovals) are covalently attached. The actual molecular weight of this macromolecule is 92 kDa, while its effective molecular weight is approximately 180 kDa with a measured hydrodynamic diameter of approximately 6 nanometers.
Figure 2.
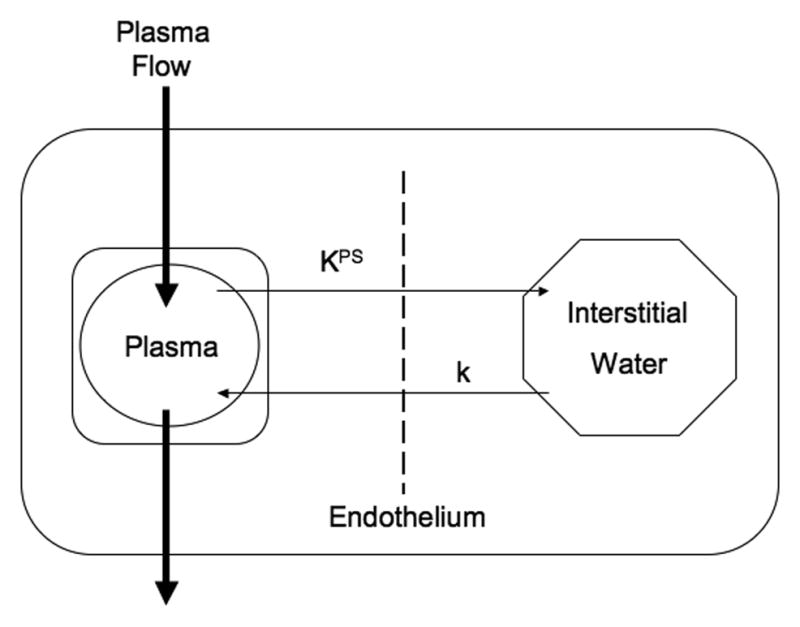
Two-compartment kinetic model used to describe the kinetics of contrast media transport from the plasma space into the interstitial fluid. The endothelial transfer coefficient KPS [μL/(min · 100 cm3)] denotes the clearance of contrast medium from plasma to interstitial water. Potential reflux of contrast media molecules from interstitial fluid back to plasma, denoted as the rate constant k (min−1), was not resolvable in the short, one hour time course of these experiments and was therefore set to zero. The box around the plasma compartment denotes a forcing function representing the mono-exponential disappearance of MMCM from the blood. The combined kinetics of both compartments, when considered together, reflect the dynamic response of the entire tissue/tumor to contrast medium enhancement.
Immunohistochemistry and Fluorescence Microscopy
Following MRI, deeply anesthetized rats were perfused for 2 minutes at a pressure of 140 mmHg with paraformaldehyde in PBS, pH 7.4; Sigma-Aldrich, St. Louis, MO) (12). Fixed tumors were excised, immersed in fixative for 1 hour at 4°C, rinsed with PBS, infiltrated with 30% sucrose, and frozen in Tissue-Tek OCT compound (Optimal Cutting Temperature, VWR, Brisbane, CA) (12).
Cryostat sections (80-μm thickness) of MDA-MB-231 and MDA-MB-435 tumors were stained following an established literature method (12). Endothelial cells were stained with mouse monoclonal anti-RECA-1 (1:250, Pharmingen, San Diego, CA). VEGF was detected using goat polyclonal antibody anti-human VEGF (1:500, R&D Systems, Minneapolis MN). The secondary antibody for mouse anti-RECA-1 was FITC-labeled donkey anti-mouse IgG (1:400, Jackson ImmunoResearch, West Grove, PA); the secondary antibody for goat anti-VEGF was Cy3-labeled donkey anti-goat IgG (1:400, Jackson ImmunoResearch, West Grove, PA).
Area density of VEGF in tissue sections was defined as the proportion of the total area occupied by VEGF-immunoreactive pixels. Fluorescence intensity was analyzed using ImageJ software (http://rsb.info.nih.gov/ij) in digital fluorescence microscopic images, each measuring 960 × 1280 μm (10x objective, 1x Optovar). Based on pixel fluorescence intensities, which ranged from 0 to 255, the signal for VEGF was distinguished from background by counting only pixels above a threshold value of 40. The same camera settings and threshold were applied to all sections. Tumor sections were also examined with a Zeiss LSM 510 confocal microscope (1024 × 1024–pixel RGB color images; Carl Zeiss Inc., Peabody, MA). The microscopic VEGF area-density was defined as the proportion of the section’s total area occupied by the positively-VEGF-stained pixels. Fluorescence was analyzed using ImageJ software (http://rsb.info.nih.gov/ij) in digital fluorescence microscopic images, each measuring 960 × 1280 μm (10x objective, 1x Optovar). Based on an analysis of pixel fluorescence intensities, which ranged from 0 to 255, the signal for VEGF was distinguished from background by empirically counting only those pixels above a threshold value of 40, thus maximizing the inclusion of only those pixels with specific VEGF staining. The area-density was calculated as the percentage of total pixels having a fluorescence intensity value equal to or greater than the threshold (13).
Statistical Analysis
Comparison of KPS determinations from dynamic MRI between MDA-MB-435 tumors and MDA-MB-231 tumors was performed using unpaired t-tests. Correlation between KPS determinations and VEGF area-density measurements from the same tumors was assessed using standard Pearson correlation. All statistical testing was performed using the GraphPad Prism Software (GraphPad Inc., San Diego, CA). For the microscopy data, differences between VEGF staining in MDA-MB-231 and MDA-MB-435 tumors was assessed using ANOVA followed by the Fisher test for multiple comparisons. Comparisons with p<0.05 were considered significantly different.
Results
All components of the experimental protocol including enhanced MRI examinations, kinetic analyses for estimation of permeability (KPS), and corresponding immunohistochemical microscopic assays for tissue VEGF area-density measurements were successfully completed in a total of 13 rats implanted with either MDA-MB-435 (n=8) or MDA-MB-231 (n=5). Data for each tumor/subject are listed in Table 1. Serial contrast-enhanced MR images of two representative rats bearing respectively a subcutaneous MDA-MB-435 tumor and a MDA-MB-231 tumor are shown in Figure 3. The model fit well the dynamic ΔR1 MRI data for blood and tumor in all studies. A representative fit is shown in Figure 4.
Table 1.
Numeric values for MRI assayed endothelial transfer coefficients, KPS (μl/min·100cm3), and immunohistochemical assays of VEGF-area-density.
| Tumor | Subject | KPS (μl/min·100cm3) | VEGF-area-density (%) |
|---|---|---|---|
| MDA-MB-435 | 1 | 16.5 | 9.7 |
| 2 | 38.9 | 10.6 | |
| 3 | 19.9 | 9.6 | |
| 4 | 16.3 | 8.1 | |
| 5 | 16.4 | 12.7 | |
| 6 | 27.5 | 12.0 | |
| 7 | 30.5 | 12.5 | |
| 8 | 28.8 | 8.1 | |
| Mean ± SD | 24.3 ± 8.4 | 10.6 ± 0.5 | |
| MDA-MB-231 | 1 | 27.6 | 23.3 |
| 2 | 39.5 | 31.4 | |
| 3 | 75.2 | 21.5 | |
| 4 | 33.8 | 27.5 | |
| 5 | 115.3 | 32.8 | |
| Mean ± SD | 58.3 ± 36.9 | 27.3 ±2.2 | |
Correlation with endothelial transfer coefficient KPS r = 0.67, p<0.05
Figure 3.
Representative T1-weighted spoiled gradient refocused (SPGR) images, precontrast and at 5 min, 15 min, 30 min and 55 min post injection of albumin-(Gd-DTPA)35 which were applied for the calculation of the endothelial transfer coefficient (KPS). Note the moderate tumor enhancement, most prominent in the rim in the MDA-MB-435 tumor (a) and in the MDA-MB-231 (b) tumor. The blood enhancement seen clearly in the inferior vena cava (white arrow) and nearby hepatic vein, persisted over the 55-minute course of data acquisition. The highly vascularized liver enhances substantially.
Figure 4.
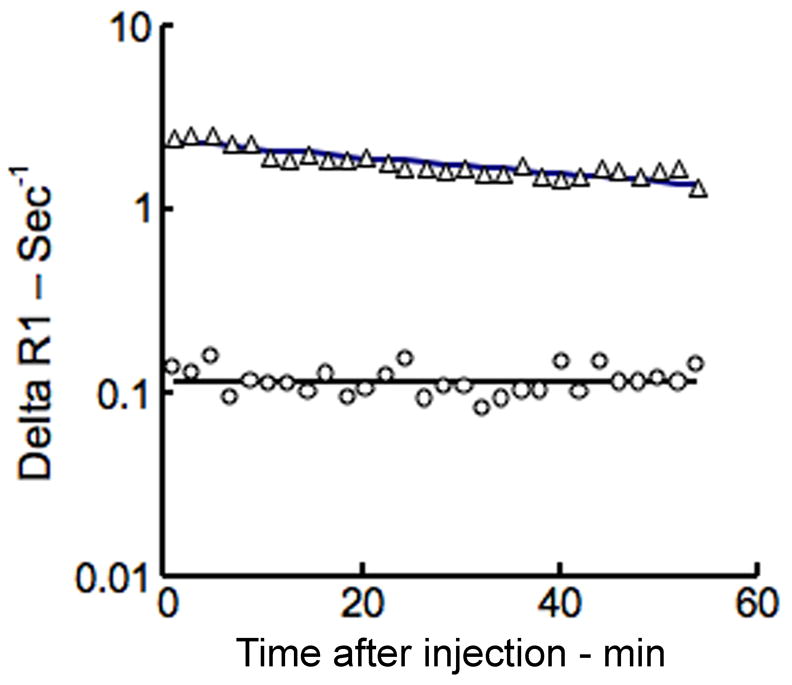
Representative fit (solid lines) of model to delta R1 data from blood (△) and tumor (○) using this MMCM-enhanced protocol. Notice the trend toward convergence of the blood and tumor plots on this semi-logarithmic graph indicative of a gradual leak of the MMCM from the intravascular space into the interstitial compartment of this tumor; the more the convergence, the larger is the leak. No convergence, i.e., parallel, gradually decreasing behavior on this semi-logarithmic graph implies the lack of a leak.
The mean endothelial transfer coefficient, KPS (Table 1 and Figure 4), was 2.4 times greater (p<0.05) in the MDA-MB-231 tumors (KPS = 58 ± 36.9 μl/min·100cm3) than in MDA-MB-435 tumors (KPS = 24 ± 8.4 μl/min·100cm3) with individual values for all tumors displayed in Table 1. Representative examples of the microscopic immunochemical staining for determination of VEGF area-density are shown in Figure 5 for MDA-MB-435 and MDA-MB-231 tumors, qualitatively revealing a greater concentration of VEGF in the MDA-MB-231 tumor. Correspondingly, the mean value for VEGF area-density was 2.6 times greater in the MDA-MB-231 tumor group than in the MDA-MB-435 group (27.3 ± 2.2 % vs. 10.5 ± 0.5 %, p<0.05). A significant positive correlation was found between KPS values and percent VEGF area-density when considering all 13 tumors (r = 0.67, p<0.05) (Figure 6).
Figure 5.
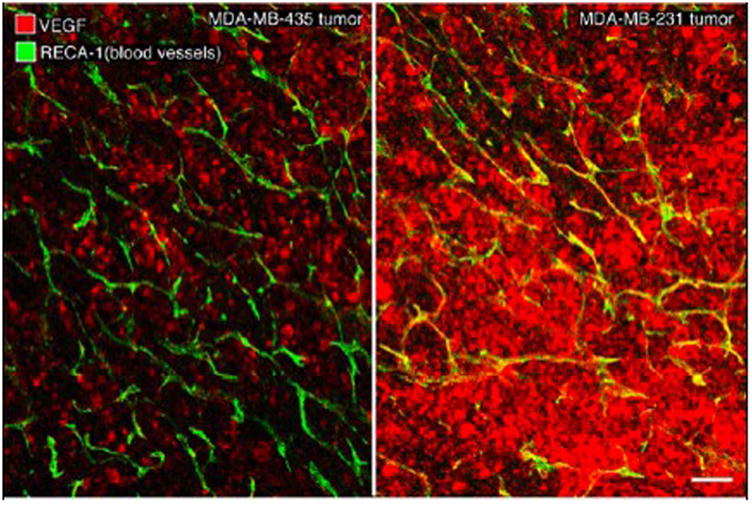
Confocal microscopic images of representative MDA-MB-435 (left) and MDA-MB-231 (right) tumors, specifically-stained for VEGF (red) with blood vessels shown as green/yellow. Note the relatively lower level of red-staining VEGF in MDA-MB-435 tumor and the much higher expression of VEGF in MDA-MB-231 tumor. White scale bar: 120 μm.
Figure 6.
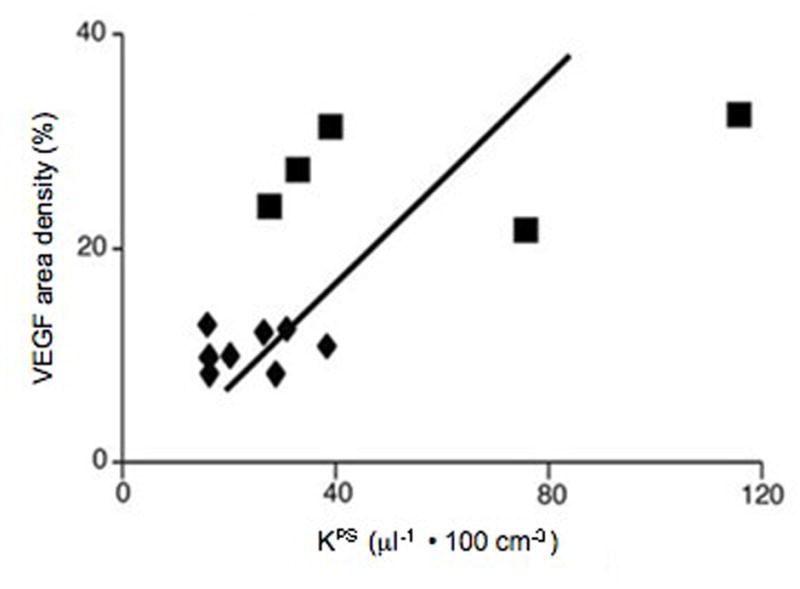
Correlation of VEGF area-density measurements with KPS determinations based upon 13 tumors. MDA-MB-435 tumors are depicted by triangles and MDA-MB-231 tumors by squares. Solid line denotes the best fit linear correlation line. The correlation (r=0.67) is statistically significant (p<0.05), with some overlap in the KPS determinations from the two tumor groups.
Discussion
MRI assays of macromolecular vascular permeability, expressed as the endothelial transfer coefficient KPS, correlated significantly with immunohistochemical microscopic measurements of VEGF in xenografts of human cancer. These results provide support for VEGF functioning as a major mediator of microvascular leakiness to macromolecular contrast media recognized in cancers. With some limitations, the data add support to the hypothesis that the tumor elaboration of VEGF, as a prominent signaling molecule in angiogenesis, is a key actor for steering vascular endothelial permeability, which can be quantified by DCE-MRI and MMCM. Results also confirm a previously reported difference in intrinsic VEGF expressions between MDA-MB-435 and MDA-MB-231 (14), while demonstrating that a functional non-invasive MRI approach is capable of detecting and quantifying this difference in molecular VEGF presence.
VEGF influence on endothelial permeability
Vascular endothelial growth factor (VEGF), a 45 kDa protein, chemically identical to vascular permeability factor (VPF), has both mitogenic and permeability enhancing effects on vascular endothelium. As a highly potent mediator of vascular permeability with a reported 50,000 times the effect of histamine (15), VEGF/VPF has been hypothesized as a mechanistic link between angiogenesis and the enhanced MMCM permeability observed consistently in cancers and inflammatory lesions. Although MRI-assayed values for macromolecular endothelial permeability correlated significantly with microscopic VEGF area-density measurements (p<0.05), the correlation was only modest (r=0.67). The r2 value of 0.445 indicates that VEGF area-density accounts for slightly less than one-half of the variance observed in the KPS values. At least two explanations seem possible. First, VEGF is not the only bioactive molecule that influences vascular permeability to a macromolecular contrast agent. Other molecules involved in the complex pathways of angiogenesis or other molecules not directly involved with angiogenesis may also influence microvascular permeability. Secondly, VEGF detected by immunohistochemical staining does not distinguish between intracellular VEGF, matrix bound VEGF, and free VEGF that can increase vascular permeability by activating receptors on endothelial cells. Ideally, one would selectively measure free VEGF as most likely to correlate with the vascular permeability, but we know of no assay for free VEGF.
Contrast media molecular weight
Vascular leakiness is understandably not the same for solutes of substantially differing molecular weights and sizes. Despite the absence in this study of comparable KPS data from use of a small molecular contrast medium (< 1 kDa,) results do confirm that a prototype MMCM and its vascular permeability are suitable for generating a significant correlation between KPS and the expression of VEGF in human cancer models. As no MMCM is yet approved for human use, the study by necessity was conducted in animal models using a prototype albumin-based agent with a MW of 92 kDa. The permeability to macromolecules like albumin-(Gd-DTPA)35 is readily measurable in cancers. However, in physiologic tissue vessels MMCM remain intravascular with KPS quantifications equalling zero representing the lower detection limit of the method (16). By comparison, microvessel permeability to small molecular weight contrast molecules like gadopentetate dimeglumine (<0.7 kDa) have been detected and measured by MRI even in physiologic tissues without elevated angiogenic activity (17). Quantitative values for endothelial permeability (KPS, ml/100ml/min) quantified by DCE-MRI and small molecular contrast media can be up to 1000 times greater than those acquired with MMCM (molecular weight >70kDa) (18). Therefore, an increase in endothelial permeability of tumor vessels resulting from elevated VEGF activity in angiogenically active tissues may be lost in the noise of normal-tissue permeability when using small- or intermediate -sized contrast molecules. A macromolecule, on the other hand, showing no detectable leak in physiologic tissues by our methods, has a sufficiently high dynamic range to allow for accurate quantification of contrast media leakage in tumor tissues with significant correlations to the individual tumor VEGF concentration. In the future, novel, PET-based strategies with dedicated tracers targeting VEGF/VEGF receptor (VEGFR) for in vivo quantification may offer interesting new insights into the relation between MRI-assayed endothelial permeability and VEGF presence as well as the development of MRI perfusion parameters under therapy in dependence from VEGF (19).
Potential Applications
Earlier studies have shown that dynamic MRI enhanced with macromolecular contrast media can be applied to detect and quantify changes in cancer vessel permeability induced by different inhibitors of angiogenesis; these include bevacizumab, a monoclonal anti-VEGF-antibody (20), celecoxib, a COX-2 inhibitor, and PTK787, a VEGF-receptor tyrosine kinase inhibitor as well as thalidomide (5, 21), all of which can be linked to the VEGF-associated pathways. This study aims at clarifying on the underlying mechanisms for cancer vessel hyperpermeability while further supporting the potential of MMCM-enhanced MRI for the non-invasive evaluation of VEGF expression in individual cancers. Pending technique translation into clinical practice with governmental approval of a suitable, safe MMCM formulation, the ability to quantitatively estimate VEGF expression in a non-invasive manner could aid substantially in patient stratification and assignment to specific forms of therapy, in new drug testing, in treatment monitoring, and for dose optimization.
Conclusions drawn from our study are limited in several ways. Only two human cancer cell lines were investigated in an optimized experimental setting. The experiments were conducted in a subcutaneous tumor model in rats with potentially limited translational implications for humans. Experiments were conducted with only one prototype macromolecular contrast agent that is not suitable for human use. Moving towards clinical translation, corresponding tumor studies using clinically available, small molecular contrast media may have to be conducted.
Conclusions
In conclusion, study results show that MMCM-enhanced MRI assays of endothelial permeability allowed for non-invasive estimation of VEGF-expression in cancer tissue. Once translated into clinical practice, this MMCM-enhanced MRI method may serve as a valuable tool for selection of specific therapy providing functional imaging biomarkers for monitoring novel molecular, anti-angiogenic drugs in personalized medicine.
Footnotes
Publisher's Disclaimer: This is a PDF file of an unedited manuscript that has been accepted for publication. As a service to our customers we are providing this early version of the manuscript. The manuscript will undergo copyediting, typesetting, and review of the resulting proof before it is published in its final citable form. Please note that during the production process errors may be discovered which could affect the content, and all legal disclaimers that apply to the journal pertain.
References
- 1.Folkman J. What is the evidence that tumors are angiogenesis dependent? J Natl Cancer Inst. 1990;82(1):4–6. doi: 10.1093/jnci/82.1.4. [DOI] [PubMed] [Google Scholar]
- 2.Nagy JA, Benjamin L, Zeng H, Dvorak AM, Dvorak HF. Vascular permeability, vascular hyperpermeability and angiogenesis. Angiogenesis. 2008;11(2):109–19. doi: 10.1007/s10456-008-9099-z. [DOI] [PMC free article] [PubMed] [Google Scholar]
- 3.Ferrara N, Gerber HP, LeCouter J. The biology of VEGF and its receptors. Nat Med. 2003;9(6):669–76. doi: 10.1038/nm0603-669. [DOI] [PubMed] [Google Scholar]
- 4.Jeong AK, Choi SI, Kim DH, et al. Evaluation by contrast-enhanced MR imaging of the lateral border zone in reperfused myocardial infarction in a cat model. Korean J Radiol. 2001;2(1):21–7. doi: 10.3348/kjr.2001.2.1.21. [DOI] [PMC free article] [PubMed] [Google Scholar]
- 5.Cyran CC, Sennino B, Chaopathomkul B, et al. Magnetic resonance imaging for monitoring the effects of thalidomide on experimental human breast cancers. Eur Radiol. 2009;19(1):121–31. doi: 10.1007/s00330-008-1111-x. [DOI] [PMC free article] [PubMed] [Google Scholar]
- 6.Raatschen HJ, Simon GH, Fu Y, et al. Vascular permeability during antiangiogenesis treatment: MR imaging assay results as biomarker for subsequent tumor growth in rats. Radiology. 2008;247(2):391–9. doi: 10.1148/radiol.2472070363. [DOI] [PMC free article] [PubMed] [Google Scholar]
- 7.Ogan MD, Schmiedl U, Moseley ME, Grodd W, Paajanen H, Brasch RC. Albumin labeled with Gd-DTPA. An intravascular contrast-enhancing agent for magnetic resonance blood pool imaging: preparation and characterization. Invest Radiol. 1987;22(8):665–71. [PubMed] [Google Scholar]
- 8.Schwickert HC, Roberts TP, Shames DM, et al. Quantification of liver blood volume: comparison of ultra short TI inversion recovery echo planar imaging (ULSTIR-EPI), with dynamic 3D-gradient recalled echo imaging. Magn Reson Med. 1995;34(6):845–52. doi: 10.1002/mrm.1910340609. [DOI] [PubMed] [Google Scholar]
- 9.Preda A, Turetschek K, Daldrup H, et al. The choice of region of interest measures in contrast-enhanced magnetic resonance image characterization of experimental breast tumors. Invest Radiol. 2005;40(6):349–54. doi: 10.1097/01.rli.0000163740.40474.48. [DOI] [PubMed] [Google Scholar]
- 10.van Dijke CF, Brasch RC, Roberts TP, et al. Mammary carcinoma model: correlation of macromolecular contrast-enhanced MR imaging characterizations of tumor microvasculature and histologic capillary density. Radiology. 1996;198(3):813–8. doi: 10.1148/radiology.198.3.8628876. [DOI] [PubMed] [Google Scholar]
- 11.Daldrup H, Shames DM, Wendland M, et al. Correlation of dynamic contrast-enhanced magnetic resonance imaging with histologic tumor grade: comparison of macromolecular and small-molecular contrast media. Pediatr Radiol. 1998;28(2):67–78. doi: 10.1007/s002470050296. [DOI] [PubMed] [Google Scholar]
- 12.Cyran CC, Sennino B, Chaopathomkul B, et al. Magnetic resonance imaging assays for dimethyl sulfoxide effect on cancer vasculature. Invest Radiol. 2008;43(5):298–305. doi: 10.1097/RLI.0b013e318164b71d. [DOI] [PMC free article] [PubMed] [Google Scholar]
- 13.Inai T, Mancuso M, Hashizume H, et al. Inhibition of vascular endothelial growth factor (VEGF) signaling in cancer causes loss of endothelial fenestrations, regression of tumor vessels, and appearance of basement membrane ghosts. Am J Pathol. 2004;165(1):35–52. doi: 10.1016/S0002-9440(10)63273-7. [DOI] [PMC free article] [PubMed] [Google Scholar]
- 14.Scott PA, Gleadle JM, Bicknell R, Harris AL. Role of the hypoxia sensing system, acidity and reproductive hormones in the variability of vascular endothelial growth factor induction in human breast carcinoma cell lines. Int J Cancer. 1998;75(5):706–12. doi: 10.1002/(sici)1097-0215(19980302)75:5<706::aid-ijc8>3.0.co;2-2. [DOI] [PubMed] [Google Scholar]
- 15.Shulman K, Rosen S, Tognazzi K, Manseau EJ, Brown LF. Expression of vascular permeability factor (VPF/VEGF) is altered in many glomerular diseases. J Am Soc Nephrol. 1996;7(5):661–6. doi: 10.1681/ASN.V75661. [DOI] [PubMed] [Google Scholar]
- 16.Cyran CC, Fu Y, Raatschen HJ, et al. New macromolecular polymeric MRI contrast agents for application in the differentiation of cancer from benign soft tissues. J Magn Reson Imaging. 2008;27(3):581–9. doi: 10.1002/jmri.21245. [DOI] [PubMed] [Google Scholar]
- 17.Demsar F, Roberts TP, Schwickert HC, et al. A MRI spatial mapping technique for microvascular permeability and tissue blood volume based on macromolecular contrast agent distribution. Magn Reson Med. 1997;37(2):236–42. doi: 10.1002/mrm.1910370216. [DOI] [PubMed] [Google Scholar]
- 18.Daldrup H, Shames DM, Wendland M, et al. Correlation of dynamic contrast-enhanced MR imaging with histologic tumor grade: comparison of macromolecular and small-molecular contrast media. AJR Am J Roentgenol. 1998;171(4):941–9. doi: 10.2214/ajr.171.4.9762973. [DOI] [PubMed] [Google Scholar]
- 19.Cai W, Chen X. Multimodality imaging of tumor angiogenesis. J Nucl Med. 2008;49:113S–128S. doi: 10.2967/jnumed.107.045922. [DOI] [PubMed] [Google Scholar]
- 20.Turetschek K, Preda A, Novikov V, et al. Tumor microvascular changes in antiangiogenic treatment: assessment by magnetic resonance contrast media of different molecular weights. J Magn Reson Imaging. 2004;20(1):138–44. doi: 10.1002/jmri.20049. [DOI] [PubMed] [Google Scholar]
- 21.Fournier LS, Novikov V, Lucidi V, et al. MR monitoring of cyclooxygenase-2 inhibition of angiogenesis in a human breast cancer model in rats. Radiology. 2007;243(1):105–11. doi: 10.1148/radiol.2431050658. [DOI] [PubMed] [Google Scholar]


