Abstract
We demonstrate a miniature, near-infrared microscope (λ = 785 nm) that uses a novel dual axes confocal architecture. Scalability is achieved with post-objective scanning, and a MEMS mirror provides real time (>4 Hz) in vivo imaging. This instrument can achieve sub-cellular resolution with deep tissue penetration and large field of view. An endoscope-compatible version can image digestive tract epithelium to guide tissue biopsy and monitor therapy.
Index Terms: fluorescence, imaging, medical diagnosis, microelectromechanical devices, microscopy, mirrors
I. Introduction
Pathological evaluation of tissue is currently being performed by analyzing biopsy specimens under a laboratory microscope [1]. While this method is effective, the process can be limited by sampling error, processing costs, and preparation time. In addition, the interpretive accuracy of the specimens can be affected by artefacts associated with tissue sectioning, paraffin embedding, and histochemical staining. Thus, enthusiasm has been growing for the development of new methods to perform real time in vivo imaging with sub-cellular resolution using endoscope-compatible microscopes.
Confocal microscopy is a powerful optical imaging method that can achieve sub-cellular resolution in real time. The technique of optical sectioning provides clear images from “optically thick” biological tissues that have previously been collected with large, laboratory instruments that occupy the size of a table [2,3]. They can be used to collect either reflectance or fluorescence to identify morphological or molecular features of cells and tissues, respectively. Moreover, images in both modalities can be captured simultaneously with complete spatial registration. This approach uses a “pinhole” placed in between the objective lens and the detector to allow only the light that originates from within a focal tiny volume below the tissue surface to be collected. For endoscope-compatible instruments, the core of an optical fiber is used as the “pinhole.”
Recently, significant progress has been made in the development of endoscope-compatible confocal imaging instruments for visualizing inside the human body. This direction has been accelerated by the availability, variety and low cost of optical fibers, scanners, and light sources, in particular, semiconductor lasers. These methods are being developed for use in the clinic as an adjunct to endoscopy. The addition of a real-time, high resolution imaging instrument can help guide tissue biopsy and reduce pathology costs. However, these efforts are technically challenging because of the demanding performance requirements for small instrument size, high image resolution, long penetration depth, and fast frame rates.
The performance parameters for miniature confocal instruments for imaging in vivo are governed by the specific application. An important goal is the early detection and image guided therapy of disease in hollow organs, including colon, esophagus, lung, oropharynx, and cervix. Applications can be found for both small animal and clinical imaging. In particular, localization of pre-malignant (dysplastic) lesions can guide tissue biopsy for early detection and prevention of cancer. On reflectance imaging, sub-cellular resolution (typically <5 μm) is needed to identify nuclear features, such as morphology and nuclear-to-cytoplasm ratio. On fluorescence imaging, high signal-to-noise is needed to attain contrast between the target and background. With both modalities, a fast imaging frame rate (>4 Hz) is necessary to reduce motion artefact.
There are numerous optical designs that are being developed to achieve endoscope compatibility with high resolution, including single [4-6] and multiple fiber [7,8] strategies. Different methods of scanning are also being explored [9-13]. So far, the aforementioned miniaturization techniques deploy a conventional single-axis confocal architecture that has the objective and optical fiber aligned along the same optical axis. Good lateral resolution can be achieved with a high numerical aperture (NA) lens at the expense of the axial range. Therefore, the objective lens typically has a physical dimension on the centimeter scale to achieve adequate resolution along both dimensions. The optics cannot be reduced to the millimeter dimensions necessary for endoscope compatibility without sacrificing either resolution, field of view (FOV), or working distance (WD). Furthermore, the scanning mechanism must be located proximal to the objective lens (pre-objective position) where off-axis beams can cause aberrations. Moreover, the large collection angle of the objective lens results in greater sensitivity to light backscattered by the tissue, reducing the dynamic range of detection.
II. Dual axes confocal architecture
A. Configuration of optics
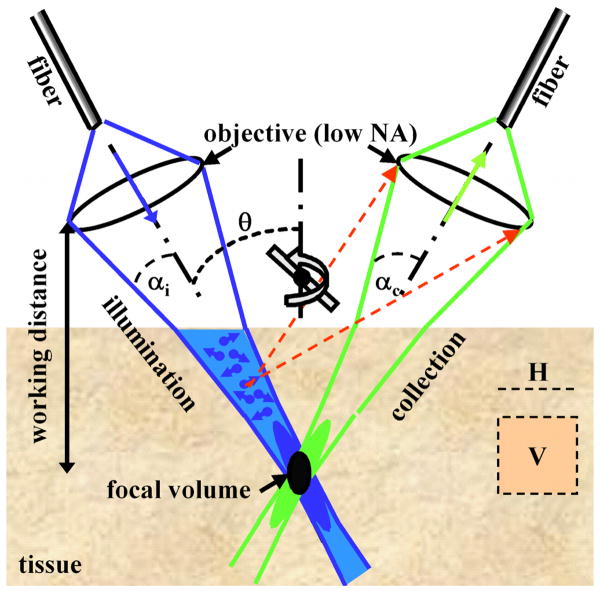
In order to overcome some of these limitations for endoscope compatibility and in vivo imaging, we have developed the novel dual axes confocal configuration, shown in Fig. 1. We use two fibers oriented along separate optical axis of different low NA objectives to spatially separate the light paths for illumination and collection [14,15]. The region of overlap between the two beams (crossed at a half angle θ from the midline) defines the focal volume, hence the resolution, and can achieve sub-cellular dimensions. A very low probability exists for light scattered by tissue along the illumination path (blue cone) to enter the low NA collection objective (green cone), thus significant improvement in the dynamic range of detection can be achieved.
Fig. 1. Novel dual axes confocal architecture uses separate optical fibers and low NA lenses for off-axis light collection, achieving long working distance, high dynamic range, and scalability while preserving resolution.
Furthermore, the low NA objectives enable an increased working distance so that the scanning mirror can be placed on the distal (tissue) side of the lens (post-objective position), resulting in less sensitivity to off-axis aberrations [15]. In this configuration, the beams always pass through the low NA objectives on axis, resulting in a diffraction-limited focal volume that can then be scanned over a large FOV, limited by the scanner rather than by the optics. This design feature allows for the instrument to be scaled down in size to millimeter dimensions for compatibility with medical endoscopes without loss of performance.
We first develop the theory to explain the unique performance features of the dual axes confocal architecture by characterizing the point-spread function (PSF) and dynamic range. Then, we demonstrate the scaled down implementation of this configuration in miniature prototypes. Because of the challenges of packaging in such a small form factor, we first demonstrate a handheld (10 mm diameter) instrument and then an endoscope-compatible (5.5 mm diameter) prototype, using the same MEMS mirror and scanhead optics.
B. Definition of coordinates
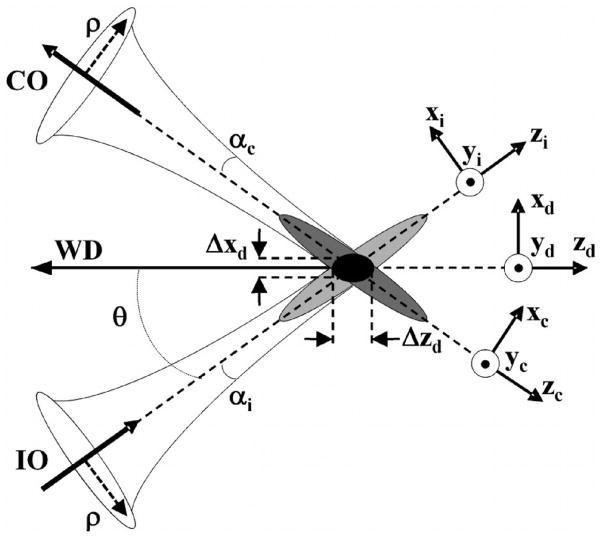
The coordinates for the dual axes confocal configuration are shown in Fig. 2. The illumination (IO) and collection (CO) objectives represent separate low NA lenses. The maximum convergence half-angles of the illumination and collection beams are represented by αi and αc, respectively. The separate optical axes are defined to cross the z-axis (zd) at an angle θ. The main lobe of the point-spread function (PSF) of the illumination objective is represented by the light gray oval. This lobe has a narrow transverse but a wide axial dimension.
Fig. 2. Coordinates for dual axes confocal configuration.
Similarly, the main lobe of the PSF of the collection objective is similar in shape but symmetrically reflected about zd, as represented by the dark gray oval. For dual axes, the combined PSF is represented by the overlap of the two individual PSF's, represented by the black oval. This region is characterized by narrow transverse dimensions, Δxd and Δyd (out of the page), and by a significantly reduced axial dimension, Δzd, which depends on the transverse rather than the axial dimension of the individual beams where they intersect.
C. Point spread function
The dual axes PSF can be derived using diffraction theory with paraxial approximations [16]. The coordinates for the illumination (xi,yi,zi) and collection (xc,yc,zc) beams are defined in terms of the coordinates of the main optical axis (xd,yd,zd), and may be expressed as follows:
| (1) |
The maximum convergence half-angles of the focused illumination and collection beams in the sample media are represented as αi and αc, respectively [17]. The angle at which the two beams intersect the main optical axis is denoted as θ. A set of general dimensionless coordinates may be defined along the illumination and collection axes, as follows:
| (2) |
The wavenumbers for illumination and collection are defined as ki = 2π/λi and kc = 2π/λc, respectively, where λi and λc are the wavelengths, and n is the index of refraction of the media.
| (3) |
The amplitude PSF describes the spatial distribution of the electric field of the focused beams. Diffraction theory may be used to show that the PSF of the illumination and collection beams is proportional to the Huygens-Fresnel integrals below [25]:
| (4) |
The PSF's for the illumination and collection are given by Ui and Uc in Eq. (3) and (4), where J0 is the Bessel function of order zero, and ρ is a normalized radial distance variable at the objective aperture. The weighting function, W(ρ), describes the truncation (apodization) of the beams. For uniform illumination, W(ρ) = 1. For Gaussian illumination, the objectives truncate the beams at the 1/e2 intensity, resulting in a weighting function of W(ρ) = e−ρ2. In practice, the beams are typically truncated so that 99% of the power is transmitted. For a Gaussian beam with a radius (1/e2 intensity) given by w, an aperture with diameter πw passes ∼99% of the power. In this case, the weighting function is given as follows:
| (5) |
For the single axis configuration, the illumination and collection PSF's at the focal plane (ui = uc = 0) are identical functions of the radial distance ρ, and can both be given by Us using the substitution ν = knrsin α, as follows:
| (6) |
The resulting signal at the detector V from a point source reflector in the media is proportional to the power received, and is given by the square of the product of the overlapping PSF's as follows:
| (7) |
where A is a constant.
Similarly, since the depth of focus for each individual beam, described within the exponential term in the integral product of Eqs. (3) and (4), is much larger than that of the transverse width, the exponential term may be neglected. As a result, the detector output vd for the dual axes configuration for uniform illumination (W = 1), is given as follows:
| (8) |
This expression can be combined with Eqs. (1) and (2) to derive the result for transverse and axial resolution with uniform illumination as follows [14]:
| (9) |
Note that for the dual axes configuration, the axial resolution is proportional to 1/NA, where NA=n sin α ≈ nα, rather than 1/NA2, as is the case for the single axis design [3]. For example, with uniform illumination and the following parameters: α = 0.21 radians, θ = 30 degrees, λ = 0.785 μm and n = 1.4 for tissue, Eq. (9) reveals a result for the dual axes configuration of Δxd = 1.1 μm, Δyd = 1.0 μm, and Δzd = 2 μm for the transverse and axial resolutions, respectively. Thus, sub-cellular resolution can be achieved in both the transverse and axial dimensions with the dual axes configuration using low NA optics but not with the single axis architecture.
For an endoscope-compatible instrument, delivery of the illumination and collection light is performed with use of optical fibers and is more appropriately modeled by a Gaussian rather than a uniform beam. With this apodization, the detector response for the dual axes configuration from a point source reflector in the media, given by Eq. (8), may be solved numerically as a function of transverse (xd and yd) and axial (zd) dimensions. The integrals are calculated in Matlab, and use the weighting function with 99% transmission. In comparison, this model reveals a result of Δxd = 2.4 μm, Δyd = 2.1 μm, and Δzd = 4.2 μm for the transverse and axial resolutions, respectively. Thus, the use of optical fibers, modeled by a Gaussian beam, produces results that are slightly worse but still comparable to that of uniform illumination [26].
D. Dynamic range
Differences in the dynamic range between the single and dual axes confocal configurations can also be illustrated with this model [17]. The calculated axial response for the single axis design with Gaussian illumination is shown by the dashed line in Fig. 3a, where optical parameters are used that achieve the same axial resolution (FWHM) of 4.2 μm. The result reveals that the main lobe falls off in the axial (z-axis) direction as 1/z2, and reaches a value of approximately -25 dB at a distance of 10 μm from the focal plane (z = 0). In addition, a number of side lobes can be appreciated.
Fig. 3. Dynamic range of novel dual axes confocal architecture. a) The axial response of the single axis (dashed line) configuration falls off as 1/z2 and that for the dual axes (solid line) design falls off as exp(-kz2), resulting in a significant improvement in dynamic range, allowing for vertical cross-sectional imaging to be performed. b) Transverse (X-Y direction) response.
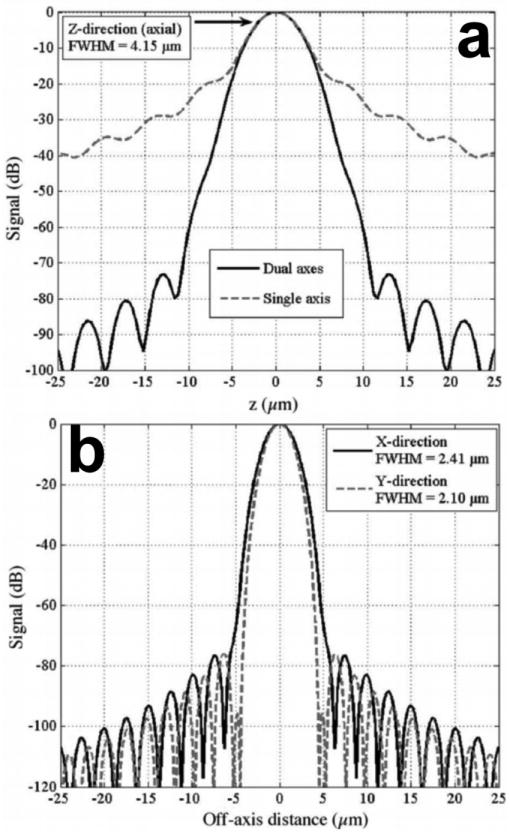
In comparison, the response for the dual axes configuration, shown by the solid line in Fig. 3a, reveals that the main lobe rolls off in the axial (z-axis) direction as exp(-kz2), and reaches a value of -60 dB at a distance of 10 μm from the focal plane (z = 0). Thus, off-axis illumination and collection of light in the dual axes architecture results in a significant improvement in dynamic range and in an exponential rejection of out-of-focus scattered light in comparison to that for single axis. This advantage allows for the dual axes configuration to collect images with deeper tissue penetration and with a vertical cross-section orientation. The transverse response with Gaussian illumination is shown in Fig. 3b.
III. MEMS-Based Scanner
A. Device Fabrication
For in vivo imaging, a fast scan rate is needed to overcome motion artifacts introduced by organ peristalsis, heart beating, and respiratory activity, typically requiring a frame rate of >4 per second. We have developed a miniature mirror fabricated with MEMS technology to perform beam scanning. This strategy is much more complex than other approaches being developed, but is well suited to meet the size and speed requirements for in vivo imaging in a compact package [18-20]. The design of this mirror uses a gimbal geometry to perform scanning in the horizontal (X-Y) plane, and rotation around an inner and outer axes defined by the location of the respective springs. The overall structure has a barbell shape with two individual mirrors that have active surface dimensions of 600×650 μm2. A 1.51 mm long strut connects these two mirrors so that the illumination and collection beams preserve the overlapping focal volume in the tissue.
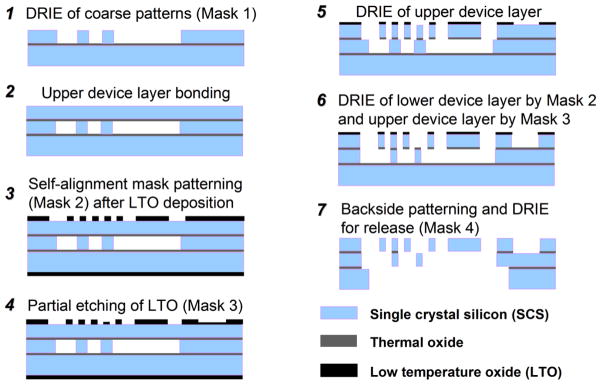
The fabrication process flow, shown in Fig. 4, starts with a silicon-on-insulator (SOI) wafer composed of a silicon substrate, buried oxide, and silicon lower device layers that are 530, 1, and 30 μm thick, respectively [20]. A deep-reactive-ion-etch (DRIE) of coarse patterns, including the combdrives and trenches, is performed on the SOI wafer with Mask 1 (step 1). Next, an oxide layer is grown on a plain silicon wafer using a wet oxidation process. This wafer is then fusion bonded onto the etched surface of the SOI wafer (step 2). The yield is increased by bonding in vacuum, and the bonded plain wafer is ground and polished down to 30 μm thickness, forming the upper device layer.
Fig. 4. MEMS scanner fabrication process flow.
The two oxide layers between the silicon layers provide electrical isolation, and act as etch stops, allowing for precise thickness control. The front side of the double-stacked SOI wafer is patterned and DRIE etched to expose the underlying alignment marks in the lower device layer. Then, a low temperature oxide (LTO) layer is deposited on both sides of the wafer. The front side layer is patterned by two masks. The first mask (Mask 2) is the self-alignment mask (step 3), and is etched into the full thickness of the upper LTO layer. The second mask (Mask 3) is mainly for patterning the electrodes for voltage supplied to the lower device layer (step 4). It goes through a partial etch leaving a thin layer of LTO. The alignment accuracy of each step needs to be >g/2, where g is the comb gap. Since most devices have 6 μm comb gaps, this leads to a required alignment accuracy of better than 3 μm.
Good alignment accuracy is important to minimize failures due to electrostatic instability during actuation. These three masks eventually define the structures in the upper, lower, and double-stacked layers. After the front side patterning is done, the LTO layer on the wafer back side is stripped (step 5). The wafer is cleaned and photoresist is deposited on the back side. Then, front side alignment marks are patterned. Next, the upper silicon layer is etched with the features of Mask 2 in DRIE. Then, a thin LTO and buried oxide layer is anisotropically dry-etched. Finally, the lower and upper silicon layers are etched (DRIE) simultaneously with features patterned by Mask 2 and 3, respectively (step 6).
For backside processing, the wafer is bonded to an oxidized handle wafer with photoresist. The back side trenches are patterned with Mask 4 on photoresist (step 7). The back side trench should etch through the substrate to release the gimbal structure, so handle wafer bonding and thick resist is required for DRIE. Alignment to the front side features are accomplished by aligning to the previously etched patterns. After the substrate (530 μm) is etched by DRIE, the process wafer is separated from the handle wafer with acetone. After wafer cleaning, the exposed oxide layer is directionally dry-etched from the back side. Finally, the remaining masking LTO and exposed buried oxide layer is directionally etched from the front side.
B. Device Characterization
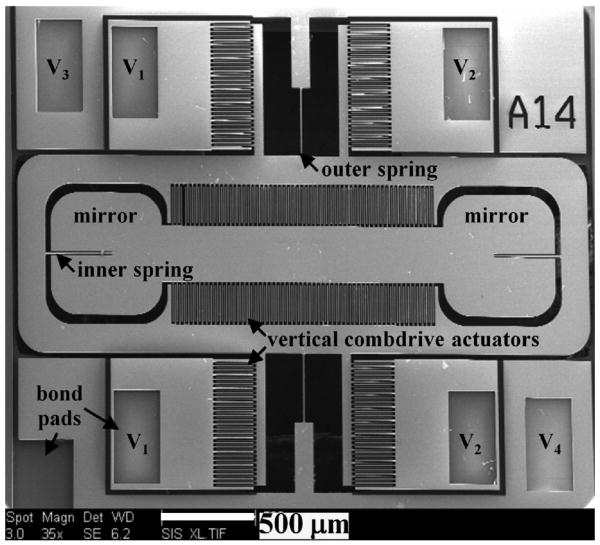
The 2D MEMS scanner is actuated by electrostatic vertical combdrive actuators [21]. Electrostatic actuation in each direction is provided by two sets of vertical comb actuators that generate a large force to produce sizable deflection angles. The scanning electron micrograph (SEM) of the scanner is shown in Fig. 5. There are 4 actuation voltages (V1, V2, V3, and V4) that power the device. The parameters of the scanner are characterized for quality control purposes prior to use in the miniature dual axes confocal microscope. First, the flatness of the mirror is measured with an interferometric surface profiler to identify micro-mirrors that have a peak-to-valley surface deformation <0.1 μm. The scanner is metalized with 10 nm thick aluminum (reflectivity = 67% at 785 nm wavelength) to increase reflectivity.
Fig. 5. SEM of 2D gimbaled MEMS scanner, scale bar 500 μm.
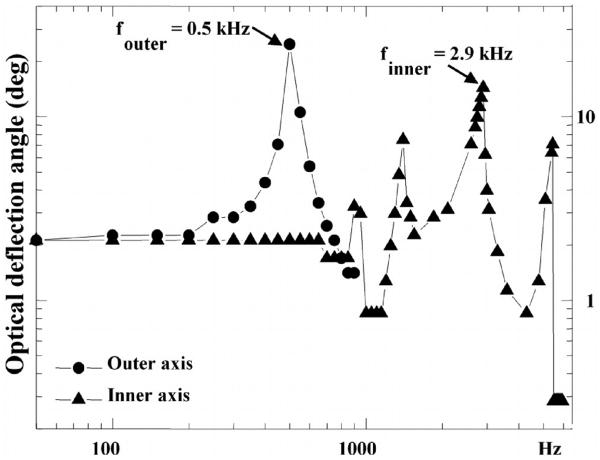
The radius of curvature of the mirror is greater than 60 cm with an average surface roughness of 7 nm. Static optical deflections of ±1.5 deg at 180 volts and ±4.25 deg at 150 volts are achieved for the outer and inner axis, respectively. The resonant frequencies are 0.5 kHz with ±10 deg optical angle at resonance for the outer axis and 2.9 kHz with ±17 deg optical angle at resonance for the inner axis. The frequency response of the device is shown in Fig. 6. The parametric resonances can sometimes be observed in the inner axis near frequencies of 2f0/n, where n is an integer ≥1 [22]. This phenomenon is caused by the non-linear response of the torsional combdrives, which leads to sub-harmonic oscillations.
Fig. 6. Frequency response of MEMS mirror shows resonant peaks at 0.5 kHz (outer axis) and 2.9 kHz (inner axis) to achieve real time operation.
IV. Dual Axes Scanhead
A. Scanhead design
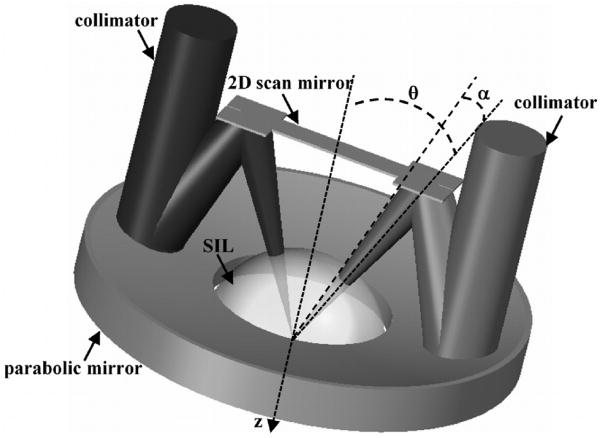
The design and integration of the miniature dual axes scanhead is a very challenging part of the development of this novel imaging technique because of the small size required for compatibility with medical endoscopes. This process requires a package that allows for precise mounting of the following optical elements: 1) two fiber-coupled collimators, 2) 2D MEMS scanner, 3) parabolic focusing mirror, and 4) hemispherical index-matching solid-immersion-lens (SIL) [23]. The basic design of the miniature scanhead is shown in Fig. 7. Two collimated beams are focused at an inclination angle θ to the z-axis by a parabolic mirror with a maximum cone half-angle α to an overlapping focal volume below the tissue surface after being deflected by a 2D MEMS scanner. The flat side of the SIL is placed against the tissue, and the curve surface accommodates the incident beams at normal incidence to minimize aberrations. The parabolic mirror is fabricated using a replicated molding process that provides a surface profile and smoothness needed for diffraction-limited focusing of the two collimated beams. Once the beams are aligned parallel to each other, the parabolic mirror then provides a “self-aligning” property that forces the focused beams to intersect at a common focal point below the tissue surface. Focusing is performed primarily by the parabolic mirror which is a non-refractive optical element with an NA of 0.12. This feature allows for the optical design to be achromatic. That is, light over a broad spectral regime can be focused to the same point below the tissue surface simultaneously, allowing for future multi-spectral imaging to be performed.
Fig. 7. Miniature dual axes scanhead. Two collimated beams that are focused by a parabolic mirror at angle θ to the z-axis for en face scanning by the 2D MEMS mirror. The solid-immersion lens (SIL) minimizes aberrations to the incident beams.
B. Scanhead alignment and packaging
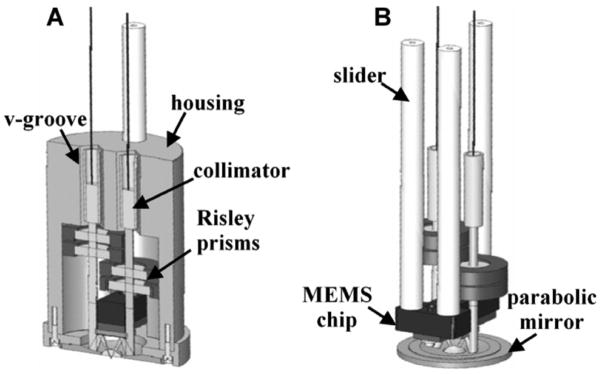
Alignment of the two beams in this configuration is a key step to maximizing imaging performance. This step can be accomplished by locating the two fiber-pigtailed collimators in a pair of v-grooves that are precision machined into the housing, as shown in Fig. 8a [24]. An accuracy of 0.05 deg can be achieved in aligning the two beams parallel to one another using the v-grooves with pre-assembled fiber collimators. Additional precision in alignment can be attained with use of Risley prisms (optical wedges) introduced into the light paths to provide fine steering of the collimated beams to bring the system into final alignment. These prisms are angled at 0.1 deg, and can be rotated to steer the collimated beam in an arbitrary direction over a maximum range of ∼0.05 deg. This feature maximizes the overlap of the two beams after they are focused by the parabolic mirror. Two wedges are used in each beam so that complete cancellation of the deflection by each can be achieved, if needed, to provide maximum flexibility.
Fig. 8. Alignment and assembly of dual axes scanhead. a) Precision machined v-grooves and Risley prisms provide coarse and fine alignment, respectively, of the two beams. b) Axial (z-axis) displacement of the MEMS chip is made with a slider mechanism.
Axial (z-axis) displacement of the MEMS chip is performed with a computer-controlled piezoelectric actuator (Physik Instrumente GmbH, P-783.ZL actuator, and E-662.LR controller) that moves a slider along 3 mechanical supports, shown in Fig. 8b. This feature adjusts the imaging depths to collect a stack of en face images to produce the 3D volume rendered images. The distal end of the slider has a mounting surface to attach the printed circuit board (PCB), which supports the MEMS chip, wire bonding surfaces, and soldering terminals.
A mixture of conductive epoxy (adhesive resin ECCOBOND Solder 56 C and Catalyst 9) from Emerson & Cuming, Inc. is used to attach aluminum-1% silicon bonding wire (Semiconductor Packaging Materials, Inc.) from the bond pads on the MEMS die to that on the PCB. Electrical power is delivered to the mirror via wires that run through the middle of the housing, and are soldered onto the PCB terminals. The z-axis translational stage is actuated by the closed-loop piezoelectric linear actuator. Finally, the scanhead assembly is covered and sealed from the environment using UV-curing glue to prevent leakage of bodily fluids.
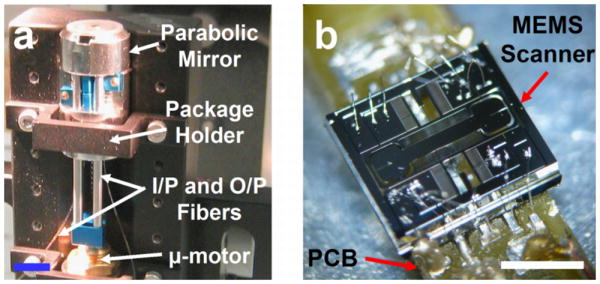
Packaging of the 10 mm diameter scanhead mounted on a V-block stage is shown in Fig. 9a. A piezoelectric (micro) μ-motor is used to perform vertical depth translation (z-axis). The MEMS scanner (die size is 3.2 (w) × 2.9 (h) mm2) mounted on the PCB is shown in Fig. 9b.
Fig. 9. a) Assembly of the dual axes confocal scanhead mounted on a V-block. b) Gimbaled 2D MEMS scanner wire bonded onto the PCB, scale bar 2 mm.
C. Instrument control and data acquisition
Both the data acquisition and MEMS actuation systems are controlled using LabVIEW™ with Vision Acquisition software package and two National Instruments data acquisition (DAQ) boards (PXI-6711 and PXI-6115). The frequency and amplitude of the actuation signals control the frame rate and FOV of the MEMS scanner. There are 4 live and 1 ground wires that provide voltage to the device and are connected to the wirebond pads on the PCB via an ultrasonic wedge bonding technique.
For each 2D en face image, the MEMS scanner is resonantly driven 180 deg out of phase to maximize the linear region of the angular deflection [25] around the outer axis (V1 and V2) at 1.22 kHz with a unipolar sine wave at a maximum of 70V, while rotation around the MEMS scanner inner axis (V3 and V4) is driven 180 deg out of phase in the DC mode (5 Hz) with a unipolar sawtooth waveform at a maximum of 200 V (AgilOptics, Inc). The unipolar sawtooth waveform is smoothed at the transition edges to mitigate higher frequency ringing from the inner axis. The step size and depth scan range of the piezoelectric actuator (vertical translation) can be adjusted to optimize the acquisition of the 3D datasets.
The photomultiplier tube (PMT) gain is synchronously adjusted to compensate for reduced signal levels at increased depths. Automated frame averaging and display can be performed to reduce noise and improve image quality during imaging. 2D en face images from the analog input channel are acquired and displayed in real time to enable continuous monitoring or visualization of the sample. All images are acquired in 16-bit data format. 3D volumetic data can be rendered by post-processing using Amira®software (Visage Imaging, Inc).
V. Prototype systems
A. Handheld instrument
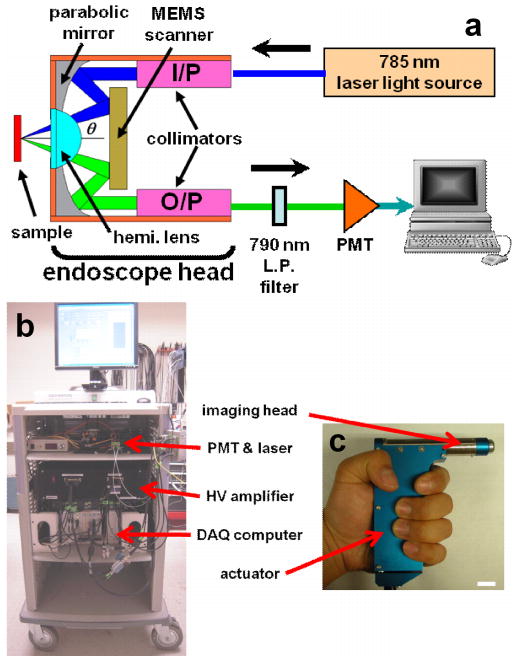
We first developed a 10 mm diameter handheld instrument, schematic shown in Fig. 10a [26]. A semiconductor laser delivers 25 mW of light (λ = 785 nm) into a single mode fiber (SMF, Fibercore Limited, SM750). The fiber terminates in a 1.8 mm diameter gradient index (GRIN) collimator (GRINTECH, GmbH). The output beam diameter (1/e2) from the collimator is 0.9 mm. The half angle θ between the input (illumination) and output (collection) beams is 24.3°. The input beam is focused by an aluminum coated parabolic mirror (PM) with the focal length of 4.6 mm (Anteryon BV) and reflected off the first mirror surface of the MEMS scanner. The center-to-center distance between the two collimators is 3.7 mm. The focused beam continues through a fused silica SIL (hemispheric lens) until it reaches the focal plane below the tissue surface. The SIL has a refractive index (1.47) that is similiar to that of the tissue and this material was chosen for index matching. The beams enter the air-silica interface at normal incidence to minimize aberrations as the focal point is scanned. Scattered light from the overlapping focal volume is collected through the optical window provided by the SIL and reflected off the MEMS mirror to the opposite surface of the parabolic mirror. The collected light is then focused onto the output fiber collimator for delivery to the PMT.
Fig. 10. Handheld prototype system. a) Schematic of complete instrument. b) Portable system demonstrated. c) Packaged handheld (10 mm diameter) dual axes confocal microscope with piezoelectric actuator in the handle, scale bar 10 mm.
As the MEMS mirror raster scans the overlapping beams, the 2D en face image is continuously displayed on a computer monitor as a using a frame grabber and image acquisition software. Intensity mapping of each 2D en face image is performed by reading the MEMS scanner driving voltages and estimating focal beam trajectory. Volumetric images (3D stack) are created with post-processing and rendering a series of 2D en face images. Each 3D volumetric image is obtained by translating the MEMS scanner with the piezoelectric micro-motor in the z-direction under computer-control. Imaging can be performed in reflectance mode or in fluorescence mode by inserting a 790-nm long pass optical filter (LP-02-785RU-25, Semrock, Inc.) in the collection path for the latter case. The maximum output laser power on the sample is 3 mW. A photograph of a fully-packaged miniature dual axes confocal microscope is shown in Fig. 10c.
B. Endoscope-compatible instrument
We scale down the basic design of the 10 mm diameter handheld instrument to develop the 5.5 mm endoscope-compatible version, shown in Fig. 11 [30]. This prototype uses the same replicated parabolic focusing and MEMS mirrors as that employed in the larger prototype. A pair of smaller (1 mm) diameter fiber-coupled GRIN collimator lenses is used in the smaller version. Alignment is provided by a pair of 1 mm diameter rotating wedges (Risley prisms), which are inserted into the path of one of the collimated beams. The collimators and Risley prisms are both located by precision wire-EDM machined v-grooves and glued into place with UV curing glue. As with the larger prototype, the combined precision of the v-grooves and the pointing accuracy of the pre-assembled fiber collimators allow for the collimated beams to become parallel to each other to within ∼0.05 deg accuracy. The alignment wedges have a small (0.1 deg) angle, which allows for steering of a collimated beam over a range of about 0.05 deg in any direction as each wedge is rotated.
Fig. 11. Endoscope-compatible dual axes confocal microscope. a) Microscope passes through the instrument channel of Olympus XT-30 therapeutic upper endoscope that has a 6 mm diameter instrument channel. b) Distal end of endoscope shows the protruding dual axes microendoscope.
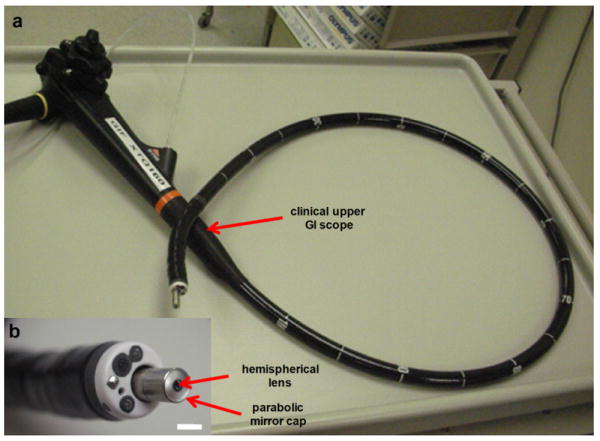
This smaller package design also accommodates a slider mechanism, which is used for axial (z-axis) scanning of the MEMS chip to provide a variable imaging depths within the tissue and for generating 3D volumetric images. This smaller slider mechanism comprises a single rod, which moves within a precision hole drilled through the housing. The MEMS chip is mounted by an adhesive to a PCB, which is in-turn mounted onto the slider. The PCB provides bondpads to accommodate wire bonding to the MEMS chip and also to provide soldering terminals for the external control wires that power the scan mirror. In Fig. 11a, the endoscope-compatible dual axes confocal microscope is shown inserted through the 6 mm diameter instrument channel of a therapeutic upper endoscope (Olympus GIF XTQ160). A magnified view of the distal tip is shown in Fig. 15b.
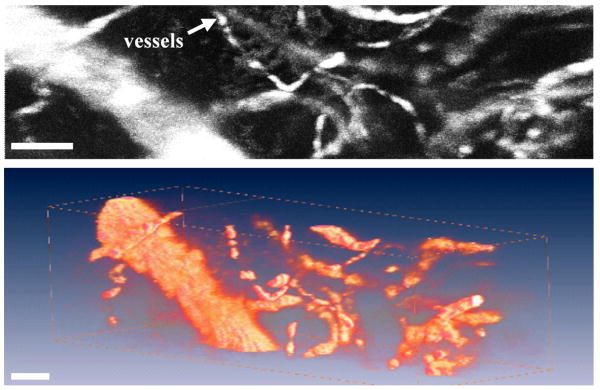
Fig. 15. a) A maximum intensity projected in vivo image of blood vessels in an intact mouse ear collected with handheld prototype. b) A 3D volume rendered image of blood vessels, scale bar 100 μm.
VI. Imaging Results
A. Reflectance imaging
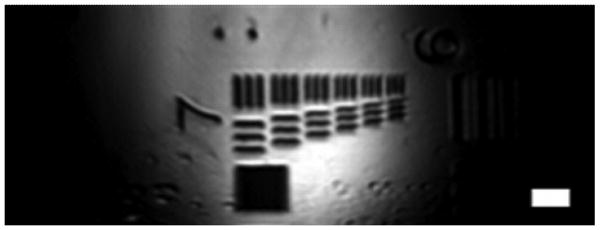
Probe characterization is performed in reflectance mode by imaging a reflective (chrome) surface of a standard (USAF) resolution target. It is also used as a sample to measure the image resolution and FOV. The transverse resolution was measured by the knife-edge method, defined by 10% to 90% of maximum intensity points, is 5 μm [27]. The axial resolution, defined by FWHM, is measured by translating a plane mirror in the z-direction and was found to be 7 μm.
Fig. 12 shows a reflectance image collected with the handheld confocal microscope that reveals clear resolution of group 7 of the USAF resolution target with no image correction. The measured values are slightly larger than the theoretical resolutions of 4.5 μm for the transverse dimensions, and 6.0 μm for the axial dimension. This is mainly due to the decrease in effective NA of the imaging system from the truncation of both input and output collimated beams by the width dimension of the MEMS scanner die. All acquired images are captured at 5 frames/second with the largest FOV of 800×450 μm2 (900×506 pixels2). This field of view is much larger than that most other miniature confocal instruments, and is achieved with use of post-objective scanning.
Fig. 12. Reflectance image of standard (USAF) resolution target collected with handheld dual axes confocal microscope, scale bar 20 μm.
B. Fluorescence imaging
B.1 Ex vivo fluorescence images with handheld dual axes confocal instrument
The 3D fluorescence imaging capability of the handheld dual axes confocal instrument is shown in Fig. 13. Excised tissue specimens of normal and dysplastic colonic mucosa are soaked in 0.5 mg of LI-COR IRDye® 800 CW NHS Ester (LI-COR Biosciences, Inc) diluted in 10 ml of phosphate-buffered saline (PBS) at neutral pH for 5 minutes and then rinsed with water to remove excess dye. After imaging, the specimens are fixed in 10% buffered formalin, cut into 5 μm sections, and processed for histology with hematoxylin and eosin (H&E). All ex vivo images are obtained from freshly excised human tissues (obtained with informed consent at the Palo Alto VA Health Care Systems).
Fig. 13. Ex vivo images. En face dual axes confocal images of a) normal, d) dysplastic colonic mucosa. Corresponding histology (H&E) of b) normal and e) dysplasia. 3D volumetric images of c) normal and f) dysplasia, scale bar 100 μm.
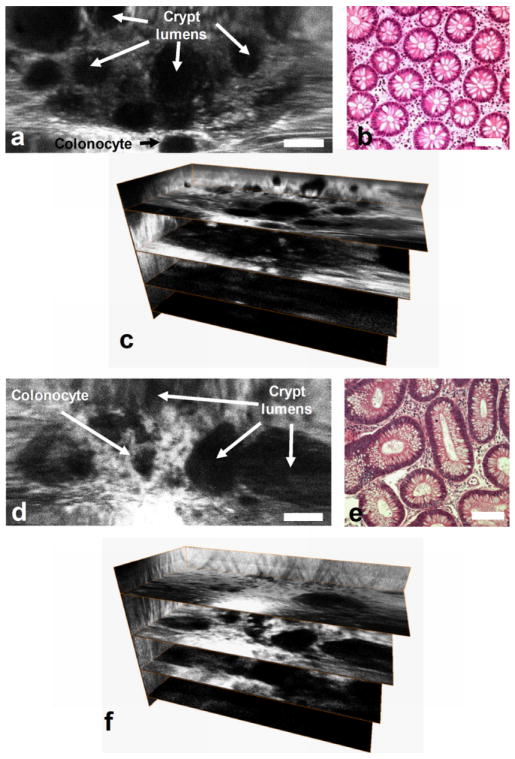
Fig 13a, b, and c and Fig 13d, e, and f show the en face image, histology (H&E), and 3D volumetric images of normal and adenomatous (dysplastic) colonic mucosa, respectively, scale bar 100 μm [28]. Features of colonic crypts, including colonocytes and crypt lumens, are clearly resolved. Fig. 13c and 13f show three extracted en face planes at 50, 170, and 230 μm below the tissue surface. The gain is increased with depth to compensate for the lower signal levels.
B.1 Ex vivo fluorescence images with endoscope-compatible dual axes confocal instrument
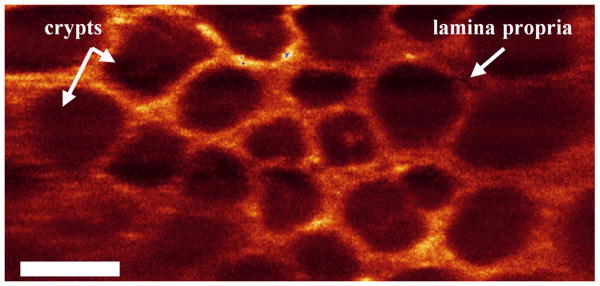
A 2D en face fluorescence image of normal colonic mucosa collected ex vivo with the 5.5 mm diameter endoscope-compatible dual axes confocal prototype is shown in Fig. 14, scale bar 100 μm. ICG was topically applied to enhance contrast, and the pseudocolor image shows dye enhancement in the lamina propria surrounding the circular shaped crypts.
Fig. 14. En face fluorescence image of normal colonic mucosa collected with endoscope-compatible dual axes confocal prototype ex vivo using topically applied ICG to enhance contrast shows regular crypt pattern, scale bar 100 μm.
B.2 In vivo imaging
In vivo imaging with the handheld dual axes confocal microscope has also been demonstrated. A mouse was anesthetized with avertin, and 10 mg of indocyanine green (Sigma-Aldrich, Corp) diluted in 10 ml of PBS was injected into the retro-orbital plexus of the mouse. Imaging was performed by resting the mouse on a translational stage and placing its ear intact on the SIL window of the microscope. Fig. 15a shows an in vivo image of blood vessels en face with maximum intensity projection. Fig. 15b shows a 3D volumetric rendering of the image stack obtained by scanning from the surface to 150 μm deep into the intact ear. The images were collected in 3 μm intervals along the z-axis by using the piezoelectric actuator. All images were taken at 5 Hz with 5 frames averaging (1 second per image). The full 3D volume rendered image was acquired in 50 seconds, scale bar 100 μm.
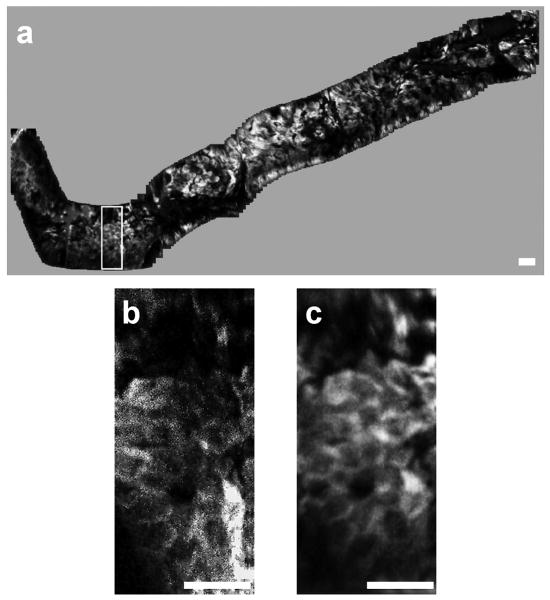
In addition, in vivo images of human skin collected with the handheld dual axes confocal microscope are shown in Fig. 16. A sequence of approximately 300 individual en face images of human skin were collected at a fixed depth of 60 μm below the tissue surface (stratum corneum) with a speed of 5 Hz μm [29]. Topically applied indocyanine green was used for contrast. Image stitching or mosaicing was performed to enlarge the FOV and to increase the signal-to-noise ratio in real time with custom mosaicing software, shown in Fig. 14a. The white rectangle box in Fig. 16a represents an individual en face image (100×400 μm2) obtained with the dual axes confocal microscope. The images were mosaiced by first correcting the image borders for scanning distortions. Then, each new image was registered and blended before proceeding to the next. Fig. 16b and 16c demonstrate how image mosaicing can increase the signal to noise ratio and dramatically improve image quality by tuning the amount of image overlap. The maximum input frame rate that our computer acquisition can process with the real-time mosaicing algorithm is 15 frames/second.
Fig. 16. a) Image mosaic of human skin acquired in vivo at a depth of 60 μm composed of roughly 300 images. The white box shows the corresponding location of individual images, b) A single input image; c) the corresponding area of the mosaic with improved signal-to-noise ratio, scale bars 50 μm.
VII. Discussion
We have demonstrated the theory, design and implementation of the dual axes confocal microendoscope. The use of separate illumination and collection of light using the region of overlap between the two beams (focal volume) provides a number of advantages for purposes of miniaturization and in vivo imaging. The instruments were developed with 785 nm illumination to take advantage of the “optical window” in tissue where the high dynamic range and deep tissue penetration of this novel architecture can be demonstrated. This instrument was able to achieve sub-cellular resolution (∼5 μm), sufficient for histopathological evaluation. Performance of the dual axes confocal microscope was demonstrated by collecting both en face images in real time and 3D volumetric images with post-processing at a maximum interrogating depth of 300 μm for both ex vivo and in vivo samples. Furthermore, we used this instrument as a test bed to further scale down the dimensions of this architecture to a 5.5 mm diameter package for endoscope compatibility. The size of the instrument was reduced with a more compact aligning mechanism.
We have demonstrated a tissue penetration depth with the miniature dual axes confocal microscope that is unmatched by any other endoscope-compatible instrument. From our in vivo experiments, fluorescence images can be collected up to a depth of 300 μm, limited by the maximum travel of the piezoelectric actuator. Greater depths have been achieved with our tabletop instruments. This demonstrates the large working distance and high dynamic range of the dual axes confocal architecture to enable deep subsurface tissue imaging. Further improvements in performance can be achieved by increasing light throughput. The relatively low output power of 2 mW can be significantly increased with use of either silver or gold coatings as the reflective surfaces of the MEMS scanner and parabolic mirror rather than aluminum. In addition, a higher power fiber-coupled laser source can be used.
Future development of dual axes confocal architecture will focus on achieving the theoretical levels of performance in a miniature instrument package. In addition, repeatability and reliability will be addressed. We will take advantage of the high dynamic range of the system by developing new z-axis actuators that rapidly scan the focal volume perpendicular to the tissue surface to achieve deep penetration in vertical cross-sections. This orientation provides a powerful view for studying the epithelium and presents a comprehensive picture of the biological differentiation patterns in this thin layer of tissue. The epithelium forms the inner lining of all hollow organs, and is accessible by medical endoscopes. In addition, we will extend this approach to multi-spectral imaging capabilities by developing achromatic optics using the same basic zig-zag design. Finally, smaller form factors will be developed to achieve compatibility with standard medical endoscopes.
As this novel approach matures, we will be able to use this high resolution imaging instrument to perform clinical investigation in human subjects and longitudinal studies in small animal models. Molecular specificity can be achieved by combining this microendoscope with use of probes that affinity bind to over expressed cell surface targets. This integrated imaging methodology will provide the ability to visualize molecular features of tissue micro-structures in the vertical plane with sub-mucosal axial depths. This powerful capability has tremendous potential to unravel previously unknown molecular mechanisms about important disease processes, such as cancer and inflammation.
VIII. Conclusion
We have successfully demonstrated a confocal microendoscope that uses the novel dual axes architecture with a MEMS-based scanner located in the post-objective position to achieve scalability and miniaturization. Off-axis illumination and collection of light with low NA objectives provide large dynamic range with long working distance while preserving high axial resolution to achieve optical sections with deep tissue penetration. Real-time ex vivo and in vivo images have been collected with both reflectance and fluorescence using 785 nm illumination. Furthermore, this novel design can be integrated into medical endoscopes for future use as an adjunct for clinical surveillance and biological investigation.
Acknowledgments
We thank Christopher H Contag, Shai Friedland, Gordon S Kino, Jonathon TC Liu, Hyejun Ra, Roy M Soetikno, Olav Solgaard, and Larry K Wong for their technical support.
This work was supported in part by grants from the National Institutes of Health, including U54 CA105296, R33 CA109988, K08 DK67618, P50 CA93990, and U54 CA136429.
Biographies
Wibool Piyawattanametha (S'98–M'04) received the B.Eng. (magna cum laude) degree in electronics engineering from King Mongkut's Institute of Technology Ladkrabang, Bangkok, Thailand, in 1994 and the M.S. and Ph.D. degrees in electrical engineering from the University of California, Los Angeles, in 1999 and 2004, respectively. From 1994 to 1997, he was with Schlumberger, Ltd. He led a team of 4 to provide petroleum reservoir evaluations to major oil companies and brought in more than $6M in revenue a year to the company. He is currently with the National Electronics and Computer Technology Center, Pathumthani, Thailand, as a senior research scientist, and the Bio-X Program, Stanford University, Stanford, CA, as a physical science research associate. He has authored or co-authored over 50 conference and journal papers, and has contributed 2 book chapters in the field of Microelectromechanical Systems (MEMS) and Photonics. He serves as a technical program chair for the Optical MEMS and Miniaturized Systems of the Society of Photo-Optical Instrumentation Engineers (SPIE) Photonics West Conference, USA, and The International Conference on Bioinformatics and Biomedical Imaging (iCBBE), USA from 2007 until present. Dr. Piyawattanametha is a member of IEEE and SPIE. His research interests include MEMS, biomedical imaging systems, neuroscience, and photonics.
Thomas D. Wang received the B.S. degree from Harvey Mudd College in 1985, Ph.D. in Biomedical Engineering (Health Sciences & Technology) from MIT in 1996, and M.D. from Harvard Medical School in 1998. He was a Post-doctoral Fellow at the Wellman Laboratory of Photomedicine (Massachusetts General Hospital) from 1996-98. He is currently an Assistant Professor of Medicine and Biomedical Engineering and Director of the NIH funded Network for Translational Research (http://sitemaker.umich.edu/ntr) program at the University of Michigan, Ann Arbor. In addition, Dr. Wang is a board-certified gastroenterologist who has pioneered the development of wide-area fluorescence endoscopy, the dual axes confocal microscope, and clinical use of fluorescence-labeled peptides to detect dysplasia in the gastrointestinal tract. Furthermore, he is experienced at validating novel optical imaging platforms, and applies his broad training to significantly accelerate the bench to bedside process. He has authored or co-authored over 50 journal and conference papers and 7 book chapters in the field of biomedical optics. He currently serves as a technical program chair for the Endoscopic Microscopy program at the Society of Photo-Optical Instrumentation Engineers (SPIE) Photonics West and is a member of the BiOS Executive Organizing Committee.
Contributor Information
Wibool Piyawattanametha, National Electronics and Computer Technology Center, Pathumthani 12120, Thailand; Departments of Applied Physics, Biology, Electrical Engineering, Microbiology & Immunology, and Pediatrics, Stanford University, CA 94305 USA (wibool@gmail.com).
Thomas D. Wang, Department of Medicine, Division of Gastroenterology, and Department of Biomedical Engineering, University of Michigan, Ann Arbor, MI 48104 (thomaswa@umich.edu)
References
- 1.Giordano A, De Falco G, Rubin E, Rubin R. Neoplasia. In: Rubin R, Strayer DS, editors. Rubin's Pathology: Clinicopathologic Foundations of Medicine. 5th. Philadelphia: Lippincott Williams & Wilkins; 2007. pp. 137–176. [Google Scholar]
- 2.Inoue S. Foundations of Confocal Scanned Imaging in Light Microscopy. In: Pawley JB, editor. Handbook of biological confocal microscopy. 3rd. New York: Springer; 2006. pp. 1–16. [Google Scholar]
- 3.Kino GS, Corle TR. Confocal Scanning Optical Microscopy and Related Imaging Systems. Boston: Academic Press; 1996. pp. 31–39. [Google Scholar]
- 4.Delaney PM, Harris MR, King RG. Fiber-optic laser scanning confocal microscope suitable for fluorescence imaging. Applied Optics. 1994 Feb;33:573–577. doi: 10.1364/AO.33.000573. [DOI] [PubMed] [Google Scholar]
- 5.Dickensheets DL, Kino GS. A Micromachined Scanning Confocal Optical Microscope. Optics Letters. 1996 May;21:764–766. doi: 10.1364/ol.21.000764. [DOI] [PubMed] [Google Scholar]
- 6.Liang C, Sung K, Richards-Kortum R, Descour MR. Design of a High-Numerical-Aperture Miniature Microscope Objective for an Endoscopic Fiber Confocal Reflectance Microscope. Applied Optics. 2002 Aug 1;41:4603–10. doi: 10.1364/ao.41.004603. [DOI] [PubMed] [Google Scholar]
- 7.Rouse AR, Gmitro AF. Multispectral imaging with a confocal microendoscope. Optics Letters. 2004 Dec 1;25:1708–1710. doi: 10.1364/ol.25.001708. [DOI] [PubMed] [Google Scholar]
- 8.Wang TD, Friedland S, Sahbaie P, Soetikno RM, Hsiung P, Liu JTC, Crawford JM, Contag CH. Functional Imaging of Colonic Mucosa with a Fibered Confocal Microscope for Real Time In Vivo Pathology. Clinical Gastroenterology & Hepatology. 2007 Nov;5:1300–05. doi: 10.1016/j.cgh.2007.07.013. [DOI] [PMC free article] [PubMed] [Google Scholar]
- 9.Dickensheets DL, Kino GS. Silicon-micromachined scanning confocal optical microscope. Journal of Microelectromechanical Systems. 1998 March;7:38–47. [Google Scholar]
- 10.Piyawattanametha W, Toshiyoshi H, LaCosse J, Wu MC. Surface-micromachined confocal scanning optical microscope. Conference on Lasers and Electro-Optics (CLEO); San Francisco, CA. May, 2000. pp. 447–448. [Google Scholar]
- 11.Murakami K, Murata A, Suga T, Kitagawa H, Kamiya Y, Kubo M, Matsumoto K, Miyajima H, Katashiro M. A miniature confocal optical microscope with MEMS gimbal scanner. IEEE International Solid-State Sensors and Actuators Conference; Boston, MA, USA. Jun, 2003. pp. 587–590. [Google Scholar]
- 12.Piyawattanametha W, Fan L, Hsu S, Fujino M, Wu MC, Herz PR, Aguirre AD, Chen Y, Fujimoto JG. Two-dimensional endoscopic MEMS scanner for high resolution optical coherence tomography. Conference on Lasers and Electro-Optics (CLEO); San Francisco, CA, USA. May, 2004. p. 3. [Google Scholar]
- 13.Piyawattanametha W, Patterson PR, Hah D, Toshiyoshi H, Wu MC. Surface- and bulk- micromachined two-dimensional scanner driven by angular vertical comb actuators. Journal of Microelectromechanical Systems. 2005;14:1329–1338. [Google Scholar]
- 14.Wang TD, Mandella MJ, Contag CH, Kino GS. Dual-axis confocal microscope for high-resolution in vivo imaging. Optics Letters. 2003 March 15;28:414–416. doi: 10.1364/ol.28.000414. [DOI] [PMC free article] [PubMed] [Google Scholar]
- 15.Wang TD, Contag CH, Mandella MJ, Chan NY, Kino GS. Dual axes confocal microscopy with post-objective scanning and low-coherence heterodyne detection. Optics Letters. 2003 October 15;28:1915–1917. doi: 10.1364/ol.28.001915. [DOI] [PMC free article] [PubMed] [Google Scholar]
- 16.Born M, Wolf E. Principles of Optics. 7th. Cambridge: Cambridge University Press; 1999. pp. 412–29. [Google Scholar]
- 17.Liu JTC, Mandella MJ, Friedland S, Soetikno R, Crawford JM, Contag CH, Kino GS, Wang TD. Dual axes confocal reflectance microscope for distinguishing colonic neoplasia. Journal of Biomedical Optics. 2006 Sep/Oct;11:054019-1–10. doi: 10.1117/1.2363363. [DOI] [PMC free article] [PubMed] [Google Scholar]
- 18.Kwon S, Lee LP. Micromachined transmissive scanning confocal microscope. Optics Letters. 2004 Apr 1;29:706–708. doi: 10.1364/ol.29.000706. [DOI] [PubMed] [Google Scholar]
- 19.Shin HJ, Pierce MC, Lee D, Ra H, Solgaard O, Richards-Kortum R. Fiber-optic confocal microscope using a MEMS scanner and miniature objective lens. Optics Express. 2007 Jul 10;15:9113–22. doi: 10.1364/oe.15.009113. [DOI] [PubMed] [Google Scholar]
- 20.Ra H, Taguchi Y, Lee D, Piyawattanametha W, Solgaard O. Two-dimensional MEMS scanner for dual axes confocal in vivo microscopy. Proceedings of the 19th IEEE International Conference on Micro Electro Mechanical Systems (MEMS); Istanbul, Turkey. Jan 25, 2006. pp. 862–865. [Google Scholar]
- 21.Ra H, Piyawattanametha W, Taguchi Y, Lee D, Mandella MJ, Solgaard O. Two-dimensional MEMS scanner for dual axes confocal microscopy. Journal of Microelectromechanical Systems. 2007 Aug;16:969–976. [Google Scholar]
- 22.Ataman C, Urey H. Nonlinear Frequency Response of Comb-Driven Microscanners. Proceedings of SPIE - The International Society for Optical Engineering MOEMS Display and Imaging Systems II; San Jose, CA. Jan, 2004. pp. 166–174. [Google Scholar]
- 23.Liu JTC, Mandella MJ, Ra H, Wong LK, Solgaard O, Kino GS, Piyawattanametha W, Contag CH, Wang TD. Miniature near-infrared dual axes confocal microscope utilizing a two-dimensional microelectromechanical systems scanner. Optics Letters. 2007 feb 1;32:256–258. doi: 10.1364/ol.32.000256. [DOI] [PMC free article] [PubMed] [Google Scholar]
- 24.Ra H, Piyawattanametha W, Mandella MJ, Hsiung PL, Hardy J, Wang TD, Contag CH, Kino GS, Solgaard O. Three-dimensional in vivo imaging by a handheld dual axes confocal microscope. Optics Express. 2008 May 12;16:7224–7232. doi: 10.1364/oe.16.007224. [DOI] [PMC free article] [PubMed] [Google Scholar]
- 25.Piyawattanametha W, Barretto RPJ, Ko TH, Flusberg BA, Cocker ED, Ra HJ, Lee DS, Solgaard O, Schnitzer MJ. Fast-scanning two-photon fluorescence imaging based on a microelectromechanical systems two-dimensional scanning mirror. Optics Letters. 2006 July 1;31:2018–2020. doi: 10.1364/ol.31.002018. [DOI] [PMC free article] [PubMed] [Google Scholar]
- 26.Piyawattanametha W, Ra H, Mandella MJ, Loewke K, Wang TD, Kino GS, Solgaard O, Contag CH. 3-D Near-Infrared Fluorescence Imaging Using an MEMS-Based Miniature Dual-Axis Confocal Microscope. IEEE J Sel Topics in Quantum Electronics. in press. [Google Scholar]
- 27.Siegman AE, Sasnett MW, Johnston TF. Choice of Clip Levels for Beam Width Measurements Using Knife-Edge Techniques. IEEE Journal of Quantum Electronics. 1991 Apr;27:1098–1104. [Google Scholar]
- 28.Piyawattanametha W, Ra H, Mandella MJ, Liu JTC, Wong LK, Du CB, Wang TD, Contag CH, Kino GS, Solgaard O. Three-Dimensional in Vivo Real Time Imaging by a Miniature Dual Axes Confocal Microscope Based on a Two-Dimensional MEMS Scanner. The 14th Interational Conference on Solid-State Sensors, Actuators and Microsystems; Jun, 2007. pp. 439–442. [Google Scholar]
- 29.Loewke K, Camarillo D, Piyawattanametha W, Breeden D, Salisbury K. Real-time image mosaicing with a hand-held dual axes confocal microscope. SPIE Photonics West 2008, Endoscopic Microscopy III; San Jose, CA, USA. Jan 20, 2008. pp. 68510F-1–9. [Google Scholar]
- 30.Mandella MJ, Wang TD. Dual Axes Confocal Microscopy. In: Tuchin VV, editor. Handbook of Photonics for Medical Science. London: Taylor & Francis Group; in press. [Google Scholar]


