Abstract
Motor vehicle collisions commonly result in serious life threatening liver injuries. Although finite element models are becoming an integral tool in the reduction of automotive related liver injuries, the establishment of accurate material models and tissue level tolerance values is critical for accurate injury risk assessment. This study presents a total of 51 tension tests performed on human liver parenchyma at various loading rates in order to characterize the viscoelastic and failure properties of human liver. Standard dog-bone coupons were obtained from fresh human livers and tested within 48 hours of death. Each coupon was tested once to failure at one of four loading rates (0.008 s–1, 0.089 s–1, 0.871 s–1, and 9.477 s–1) to investigate the effects of rate dependence. Load and acceleration data were obtained from each of the specimen grips. High-speed video and optical markers placed on the specimens were used to measure local displacement. Failure stress and strain were calculated at the location of failure in the gage length of the coupon. The results of the study showed that liver parenchyma is rate dependent, with higher rate tests giving higher failure stresses and lower failure strains. The failure strains for all tests ranged from 11% to 54% and the failure stresses ranged from 7 kPa to 95 kPa. This study provides novel biomechanical data that can be used in the development of both rate dependent material models and tissue level tolerance values critical for the validation of finite element models used to assess injury risk in automobile collisions.
INTRODUCTION
Motor vehicle collisions (MVCs) commonly result in serious blunt abdominal injuries [Mackenzie et al. 2003]. Although abdomen injuries account for only 3–5% of all injuries observed in MVCs, they comprise 8% of AIS 3+ injuries, 16.5% of AIS 4+ injuries and 20.5% of AIS 5+ injuries [Bondy, 1980; Rouhana and Foster, 1985; Elhagediab and Rouhana, 1998; Augenstein et al., 2000]. The liver is more susceptible to injury in blunt trauma than other solid abdominal organs due to the liver’s size and anatomical location [Fabian and Bee, 2003]. Elhagediab and Rouhana (1998) reported that the liver is the most frequently injured abdominal organ in MVCs and accounts for approximately 38% of all abdominal injuries. Holbrook et al. (2007) analyzed data from the Crash Injury Research and Engineering Network (CIREN) and reported that 47% of all reported liver injuries resulting from MVCs were either moderate or major in severity. Similarly, Christmas et al. (2005) reported that of the 561 patients with liver injuries 41% of the injuries were high severity. Holbrook et al. (2007) also reported that among the 316 subjects with liver injuries the majority of the injuries were lacerations (81%). Clinically it has been shown that the mortality rate for blunt liver injuries ranges from 9–17% [Christmas et al., 2005]. However, the mortality rate increases to 30% if surgical intervention is required and 67% if the inferior vena cava or the hepatic veins are involved [Christmas et al., 2005; Hurtuk et al., 2006].
Currently, no crash test dummies used to assess injury risk in MVCs are equipped to represent individual solid abdominal organs located asymmetrically in the human abdomen [Tamura et al., 2002]. Consequently, finite element models (FEMs) are becoming an integral tool in the reduction of automotive related abdominal injuries. However, the response of these models must be locally and globally validated based on appropriate biomechanical data in order to accurately assess injury risk. Furthermore, since FEMs allow for the prediction of injury based on the calculation of physical variables mechanically related to injury, such as stress and strain, the establishment of tissue level tolerance values is critical for the accurate prediction of injuries [Moorcroft et al., 2003; Stitzel et al., 2005a; Stitzel et al., 2005b ; Stitzel et al., 2009 ; Takhounts et al., 2008].
Several biomechanical studies have evaluated the mechanical response and injury tolerance of the liver by conducting compression tests on intact animal or human cadaver livers [Melvin et al., 1973; Trollope et al., 1973; Wang et al., 1992; Kerdok et al., 2006; Sparks et al., 2007]. It is important to note that the flat plate compression tests performed on whole human livers by Sparks et al. (2007) generated liver lacerations on the outer portions of the liver representative of those documented in CIREN cases. These studies not only provide valuable global liver response data, but have shown that the response of the liver is viscoelastic and that internal parenchyma pressure is the best indicator of injury. Although these studies have provided significant contributions to the literature, they are limited in their ability to accurately quantify localized stress and strain essential for local FEM validation. In order to directly quantify the material properties of biological tissue, tension and compression testing must be conducted on isolated tissue coupons [Kemper et al., 2005; Kemper et al., 2007].
There have only been a few studies which have investigated the compressive material properties of liver by performing compression tests on isolated samples of liver parenchyma. These studies have primarily focused on sub-failure loading performed on porcine or bovine liver [Tamura et al., 2002; Nasseri et al., 2003; Roan and Vemaganti, 2007; Mazza et al., 2007]. Tamura et al. (2002) performed failure testing at various loading rates and reported that average peak stress increased with increased loading rate. The peak strain, however, was not found to vary significantly with respect to loading rate. It is important to note that it is difficult to define the exact point at which tissue failure occurs in compressive loading. Failure in compressive loading is generally defined as the peak load or inflection point. However, tissue failure could occur prior to this point. To explain, in compressive loading the load can continually increase after the tissue begins to fail because with continued compression the load is redistributed throughout the sample. In addition, the compressive material properties of liver cannot be used to predict liver lacerations since the tensile and compressive responses of soft tissue cannot be assumed to be equal.
A number of studies have investigated the failure properties of liver by performing tension tests on isolated samples of liver tissue. Yamada (1970) reported the properties of rabbit liver parenchyma in uniaxial tension but did not report the loading rate used for these experiments. Uehara (1995) tested samples of porcine liver parenchyma in uniaxial tension at various loading rates and reported that the failure stress and modulus increased with increased loading rate, while the extension ratio decreased with increased loading rate. Stingl et al. (2002) performed tension tests on strips of isolated human liver capsule and strips of capsule with subcapsular tissue attached. Hollenstein et al. (2006) performed tension tests on the capsule of one bovine liver. Santago et al. (2009a) evaulated the effect of temperature on tensile material properties of bovine liver parenchyma and reported that there were no statistically significant differences found in failure stress or strain between specimens tested at 75°F versus those tested at 98°F. Santago et al. (2009b) evaulated the effect of freezing on the tensile material properties of bovine liver parenchyma and found that freezing significantly reduces the failure strain. Although these studies have provided considerable insight into the factors that affect the tensile material response of the liver parenchyma, these studies have been limited to testing of animal tissue or a single loading rate.
In summary, motor vehicle collisions commonly result in serious life threatening liver injuries and lacerations are the most common type of liver injury observed in MVCs. In order to accurately predict liver lacerations in MVCs, it is necessary to investigate the tensile material response of human liver tissue at various loading rates. However, to the authors’ knowledge there has been no attempt to quantify the viscoelastic response of human liver in tensile loading. Therefore, the purpose of this study is to quantify the tensile material properties of human liver parenchyma at various loading rates.
METHODS
Subject Information
Uniaxial tension tests were performed on the parenchyma of 7 human livers obtained from unembalmed post mortem human subjects (PMHS). All donors were screened to avoid any medical issues that might affect the mechanical properties of the liver such as hepatitis and abdominal cancer. Each liver was obtained within 36 hours of death and tested within 48 hours of death to minimize the adverse effects of tissue degradation. Subject gender, age, weight, and height were documented (Table 1). It should be noted that the livers were not frozen at any point between the time of death and testing since it has been shown that freezing significantly affects the tensile material properties of the liver parenchyma [Santago et al., 2009b]. In order to preserve the tissue between the time of procurement and specimen preparation, the livers were immersed in Dulbecco’s Modified Eagle Medium (DMEM), which is a tissue culture medium, and chilled with wet ice.
Table 1.
Subject Information.
| Subject ID | Gender | Age | Weight | Height |
|---|---|---|---|---|
| (M/F) | (years) | (kg) | (cm) | |
| 1 | F | 77 | 68.2 | 167.6 |
| 2 | M | 78 | N/A | N/A |
| 3 | F | 67 | 81.8 | 154.9 |
| 4 | F | 57 | 66.4 | 172.7 |
| 5 | M | 69 | N/A | N/A |
| 6 | F | 80 | N/A | N/A |
| 7 | F | 64 | 45.5 | 160.0 |
Note: N/A is Not Available.
Specimen Preparation
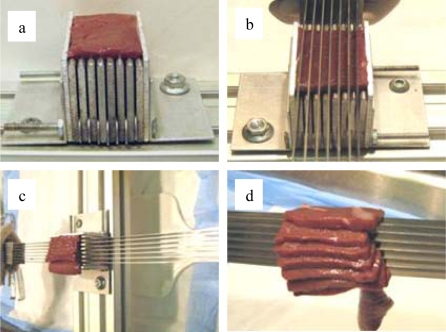
A custom blade assembly and slicing jig were used to obtain constant thickness slices of liver parenchyma. The blade assembly consisted of multiple 48.3 cm long razor blades spaced such that the tips of the blades were 5 mm apart. The slicing jig was an aluminum fixture, designed to securely hold a block of tissue, with vertical slots spaced 5 mm apart to act as guides for the blades. To generate tissue slices, a square block of tissue was first cut from the parenchyma of the liver and placed in the slicing jig (Figure 1a). The blades were then aligned in the blade guides on the slicing jig (Figure 1b). The slicing was performed in one smooth slow pass through the tissue while minimizing downward force in order to avoid damaging or deforming the tissue (Figure 1c). This methodology produced multiple constant thickness slices of liver parenchyma from each block of tissue (Figure 1d). The tissue slices were then immersed in a bath of DMEM to maintain specimen hydration.
Figure 1.
Specimen Slicing Methodology.
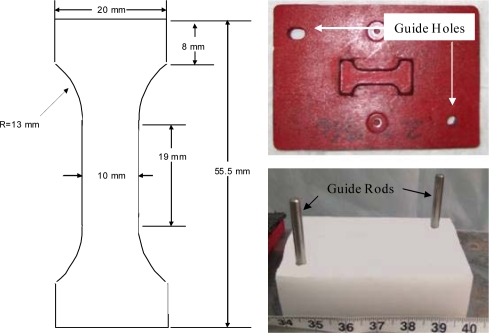
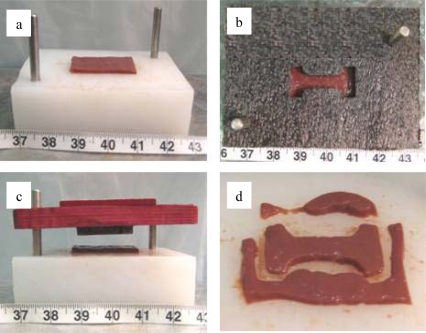
A custom stamp and stamping base were used to obtain “dog-bone” shaped specimens commonly used for uniaxial tension testing (Figure 2). The geometry of the dog-bone was designed to ensure that the specimen would fail in the gage length, which had a constant width and thickness. Prior to stamping, a template was used to position the tissue slice on the stamping base in order to obtain a specimen devoid of any visible vasculature or defects (Figure 3a and 3b). The stamp was then placed over the tissue slice and lightly struck several times in order to cut the tissue into the desired shape (Figure 3c and 3d). Guide rods attached to the stamping base provided a means to align both the template and stamp. In addition, the guide rods constrained the stamp during the stamping process, only allowing translation orthogonal to the tissue slice. After stamping, the dog-bone samples were then immersed in a bath of DMEM to maintain specimen hydration.
Figure 2.
Specimen Stamp and Stamping Base.
Figure 3.
Specimen Stamping Methodology.
Testing Configuration
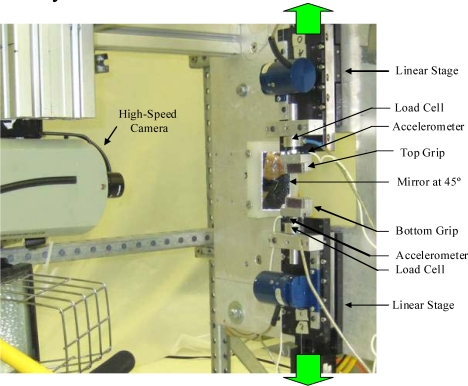
The primary component of the experimental setup was a custom designed uniaxial dynamic tensile testing system (Figure 4). It should be noted that the entire experimental setup was contained in an environmental test chamber heated to 37°C. The testing system consisted of two motor driven linear stages (Parker Daedal MX80S, Irwin, PA) mounted to a vertically oriented aluminum plate. Each of the linear stages was instrumented with a single-axis load cell (Interface, WMC Miniature-22.24N, Scottsdale, AZ) and accelerometer (Endevco 7264B, 2000 G, San Juan Capistrano, CA). The system was operated with a multi-axis controller (Parker ACR9000, Irwin, PA), which provided synchronized motion of both linear stages, and a motor driver (Parker ViX, Irwin, PA). The testing system placed a tensile load on the test specimen by simultaneously moving the top and bottom grips away from one another at a constant velocity.
Figure 4.
Experimental Setup.
In order to investigate rate dependence, each specimen was pulled to failure at one of four desired strain rates: 0.01 s–1, 0.1 s–1, 1.0 s–1, or 10.0 s–1. Specimen deformation was measured using optical markers placed on the specimen and a high-speed video camera (Phantom V4, Vision Research, Wayne, NJ), at a resolution of 7.7 pixels/mm [Manoogian et al., 2008a; Manoogian et al., 2008b]. The sampling rates used to acquire load cell data, accelerometer data and high-speed video are reported in Table 2.
Table 2.
Data Acquisition and High-Speed Video Sampling Rates by Loading Rate.
| Rate | Desired Strain Rate | Data Acquisition | High-Speed Video |
|---|---|---|---|
| (s–1) | (kHz) | (Hz) | |
| Rate 1 | 0.01 | 0.2 | 20 |
| Rate 2 | 0.10 | 2.0 | 70 |
| Rate 3 | 1.00 | 20.0 | 500 |
| Rate 4 | 10.00 | 40.0 | 1000 |
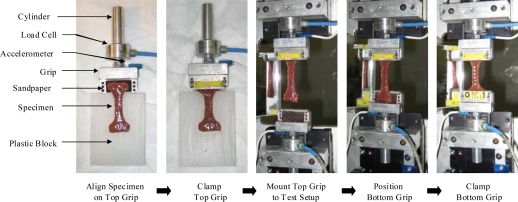
In order to minimize variations in initial specimen preload and the adverse affects of shear due to improper specimen alignment, a detailed specimen mounting procedure was developed (Figure 5). Immediately prior to mounting the specimens on the experimental setup, the specimens were immersed in a bath of DMEM heated to 37°C. To mount the specimens, the top grip assembly was first removed from the experimental setup and laid flat on a table top. The specimen was then aligned on the top grip so that the main axis of the specimen coincided with the centerline of the load train and clamped. Sandpaper was placed on the clamping surfaces to ensure that the specimens would not slip during loading. After clamping, the top grip assembly was then attached to the experimental setup and the specimen was allowed to hang in 1 g of tension. With the tissue hanging, the specimen was placed on the bottom grip and clamped. By allowing the specimens to hang under their own weight during the clamping process, all specimens had a minimal but consistent preload. Once the coupons were mounted, side view and back view pre-test pictures were taken with high resolution digital cameras, 14.6 pixels/mm and 13.8 pixels/mm respectively, in order to obtain initial width and thickness measurements. The error in the width and thickness measurements was ± 2 pixels. Finally, equally spaced optical markers were placed on the gage length in view of the high-speed camera.
Figure 5.
Specimen Mounting Methodology.
Data Processing and Analysis
In order for a test to be deemed acceptable, the location of the failure must have occurred in the gage length of the specimen. Therefore, specimens which tore next to the grip or pulled out of either grip were not included in the data set. Failure was defined as the point at which the failure tear initiated in the high-speed video. The timing of the initiation of the failure tear occurred at approximately the time of peak load preceding a significant decrease in the load. If the initiation of the failure tear could not be observed in the video, then failure was defined as the point of peak load preceding a significant decrease in the load.
Local strain was quantified by first tracking the optical markers placed on the tissue throughout the duration of the test using motion analysis software (TEMA, Image Systems, Linköping, Sweden). The measured displacement between the closest optical markers surrounding the location of the failure tear was then fit with a 5th degree polynomial up to the time of failure [Sokolis et al., 2002; Manoogian et al., 2008a; Manoogian et al., 2009]. The average R2 value for the displacement curve fit was 0.997. The stretch ratio (λ) and Green-Lagrangian strain (є) were then calculated from the curve fit displacement data (Equations 1 and 2). For the calculation of stretch ratio, Lo was defined as the original distance between the optical markers and Ln was the instantaneous distance between the optical markers. The strain rate was calculated as the slope of the strain time history from 25% to 75% of the peak strain.
| (1) |
| (2) |
Local stress was calculated based on the inertially compensated force and the original cross-sectional area at the location of the failure. The inertially compensated force (FIC) was calculated based on the measured force (F), grip acceleration (a), and effective mass (meff). The effective mass was defined as ½ the load cell mass plus the mass between the load cell and specimen (Equation 3). The inertially compensated force data was then curve fit with a 5th degree polynomial up to the time of failure [Sokolis et al., 2002; Manoogian et al., 2008a; Manoogian et al., 2009]. The average R2 value for the force curve fit was 0.977. The initial cross-sectional area was obtained by determining the location of the failure in the high-speed video and then determining width and thickness at that location from the pre-test pictures. The error for the picture measurements was ± 2 pixels. The 2nd Piola Kirchhoff Stress (S) was then calculated based on the curve fit inertially compensated force data, stretch ratio, and initial cross-sectional area (Equation 4).
| (3) |
| (4) |
A series of two-sample Student t-tests, assuming unequal variance, were performed to evaluate significance in failure stress and strain with respect to loading rate. Significance was defined as a p-value of ≤0.05. In addition, a standard method of determining the characteristic average was used to develop an average stress versus strain curve for each loading rate [Lessley et al., 2004]. Standard deviations of the stress and strain values were also calculated for each group of tests.
RESULTS
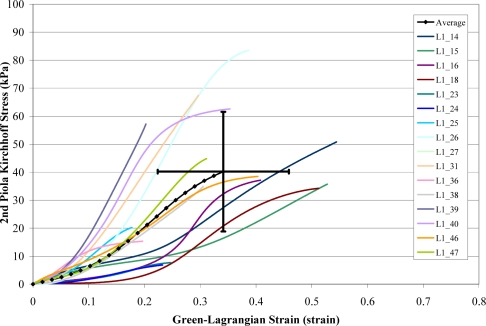
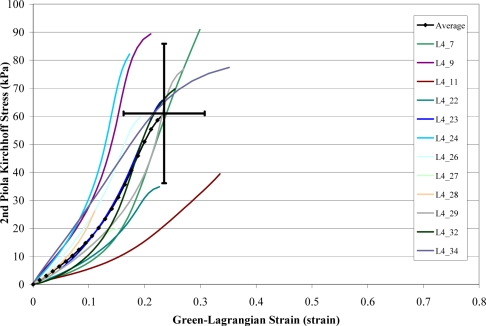
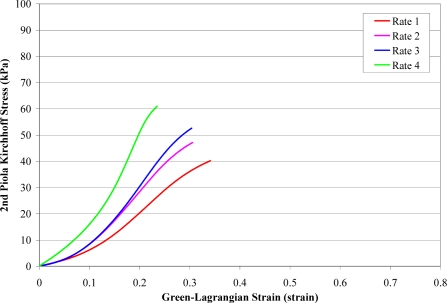
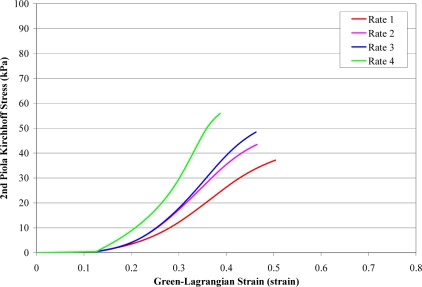
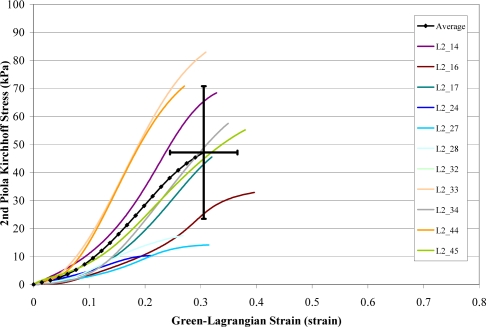
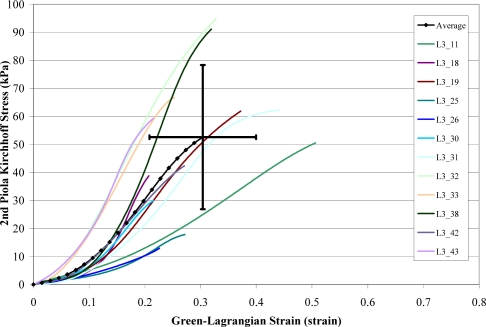
A total of 168 failure tests were performed on human liver parenchyma coupons in uniaxial tension at four different loading rates. Of the 168 failure tests, a total of 51 specimens failed in the gage length of the dog-bone coupon (Figure 6). The stress versus strain curves from the specimens which failed in the gage length were plotted by loading rate along with the corresponding characteristic averages and standard deviations for the failure stress and strain (Figure 7 to Figure 10). The stress versus strain curves show that the tensile response of liver parenchyma was nonlinear for all loading rates. The characteristic averages for each loading rate were plotted together to clearly compare the average responses with respect to loading rate (Figure 11). The average peak stress, average peak strain, and strain rate for each loading rate are tabulated in Table 3. The peak stress, peak strain, and strain rate for each test are tabulated in the Appendix (Tables A1–A4).
Figure 6.
High-Speed Video Stills of a Typical Uniaxial Tension Test.
Figure 7.
Stress vs. Strain Curves for Rate 1 Tests.
Figure 10.
Stress vs. Strain Curves for Rate 4 Tests.
Figure 11.
Characteristic Averages by Rate.
Table 3.
Averages and Standard Deviations by Loading Rate.
| Rate | Desired Strain Rate | Average Strain Rate | Average Failure Stress | Average Failure Strain |
|---|---|---|---|---|
| (s–1) | (s–1) | (kPa) | (strain) | |
| Rate 1 | 0.01 | 0.008 (± 0.001) | 40.21 (± 21.39) | 0.34 (± 0.12) |
| Rate 2 | 0.10 | 0.089 (± 0.014) | 46.79 (± 24.81) | 0.32 (± 0.05) |
| Rate 3 | 1.00 | 0.871 (± 0.093) | 52.61 (± 25.73) | 0.30 (± 0.10) |
| Rate 4 | 10.00 | 9.477 (± 1.964) | 61.02 (± 24.89) | 0.24 (± 0.07) |
The results show that the response of liver parenchyma in tensile loading varies with respect to loading rate (Table 3 and Table 4). Specifically, the average failure stress was found to significantly increase with increased loading rate. Conversely, the average failure strain was found to significantly decrease with increased loading rate. However, significance was not observed between all loading rates for either failure stress or failure strain.
Table 4.
Statistical Comparison between Rates.
| Comparison | Failure Stress | Failure Strain |
|---|---|---|
| p-value | p-value | |
| Rate 1 vs. Rate 2 | 0.45 | 0.48 |
| Rate 1 vs. Rate 3 | 0.36 | 0.19 |
| Rate 1 vs. Rate 4 | 0.01 | 0.03 |
| Rate 2 vs. Rate 3 | 0.71 | 0.59 |
| Rate 2 vs. Rate 4 | 0.01 | 0.18 |
| Rate 3 vs. Rate 4 | 0.06 | 0.42 |
DISCUSSION
The current study is the first study to quantify the material response of fresh human liver parenchyma in tensile loading at various loading rates. The data from this study shows that the response of human liver parenchyma is non-linear in tensile loading. In addition, the results show that liver parenchyma exhibits viscoelasticity in tensile loading. Specifically, with increased loading rate the failure stress significantly increased while the failure strain significantly decreased. Although this trend was not significant between all loading rates in the current study, it does indicate that the rate dependence of liver parenchyma should be taken into account when developing material models or injury thresholds.
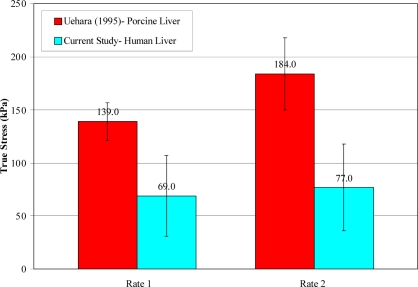
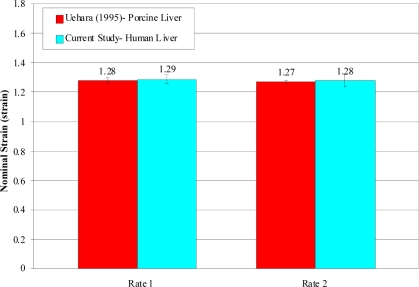
The trends in failure stress and failure strain with respect to loading rate observed in the current study are consistent with the findings of Uehara (1995). Uehara (1995) tested samples of porcine liver parenchyma in uniaxial tension at loading rates of 5, 20, 50, 200, and 500 mm/min. Based on loading velocity and average initial specimen length, it was then determined that the loading rates of 20 mm/min and 200 mm/min used by Uehara (1995) were comparable to the rate 1 (0.008 s–1) and rate 2 (0.089 s–1) tests in the current study. In order to directly compare the data from the current study to the porcine data reported by Uehara (1995), the stress data from the current study was converted to true stress, by assuming a Poisson’s ratio of 0.5, and the strain data was converted to nominal strain. The comparison of the two studies shows that although the failure strain values are extremely similar, the failure stress was significantly larger for porcine liver compared to human liver (Figure 12 and Figure 13). This is consistent with previous studies which have reported that porcine tissue has a higher injury tolerance than human tissue [Kennedy et al., 2006].
Figure 12.
Comparison of Failure Stress between Human and Porcine Liver.
Figure 13.
Comparison of Failure Strain between Human and Porcine Liver.
The differences between porcine and human liver could be attributed to differences in the structure of the liver parenchyma in each of these species. Specifically, there are differences in the delineation of adjacent hepatic lobules between human and porcine liver. The hepatic lobules are the basic functional units of the liver and consist of a roughly hexagonal arrangement of plates of hepatocytes radiating outward from a vein in the center. Regularly distributed portal triads are located at the vertices of the lobule and contain a bile duct, a terminal branch of the hepatic artery and portal vein. In porcine liver, the lobules are easily recognized in histology sections because the portal areas are connected by relatively thick layers of connective tissue, called septa, consisting primarily of collagen [Zhang, 1999; Bacha and Bacha, 2000; Ross and Pawlina, 2006]. The interlobular septum in pig liver creates a physical boundary between adjacent lobules, which compartmentalizes each lobule. Conversely, adjacent lobules are indistinctively separated from one another in human liver since there is no interlobular collagenous septum [Matthews and Martin, 1971; Zhang, 1999; Ross and Pawlina, 2006]. However, human liver does contain some connective tissue, i.e. collagen, at each of the portal triads and central vein [Zhang, 1999; Mazza et al., 2007].
Although collagen content was not quantified in the current study, the relationship between liver stiffness and collagen content could elucidate the difference in the material response between porcine and human liver. To explain, the stiffness of the human liver has been shown to increase with respect to the degree of liver fibrosis, which occurs in most types of chronic liver diseases [Yeh et al., 2002; Mazza et al., 2007]. Advanced liver fibrosis can result in cirrhosis, i.e. scaring. Liver fibrosis is defined as the excessive accumulation of extracellular matrix proteins, primarily collagen. Therefore, stiffness of the liver can be considered proportional to the collagen content. Consequently, the significantly higher proportion of collagen tissue in porcine liver, compared to that of human liver, could explain the significantly higher failure stress observed in porcine liver. Since the connective tissue is located on all sides of the hexagonal porcine hepatic lobules, the fibers are not oriented in a single direction. Therefore, the higher proportion of connective tissue in porcine liver could cause a significant increase in failure stress with little to no increase in failure strain.
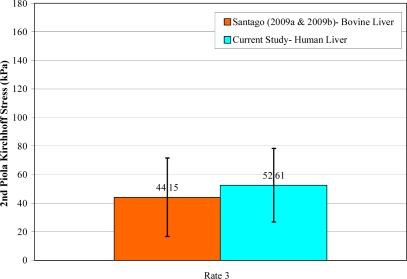
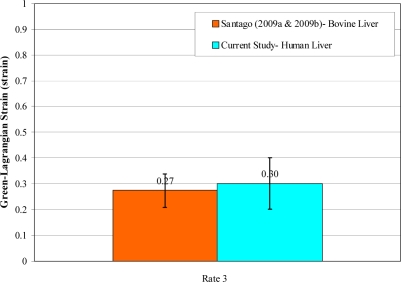
Unlike porcine liver, the structure of bovine liver parenchyma is similar to that of a human liver. Specifically, adjacent lobules are not separated by interlobular collagenous septa in human liver and bovine liver [Matthews and Martin, 1971; Zhang, 1999; Eurell and Frappier; 2006; Ross and Pawlina, 2006]. This accounts for the tougher nature of porcine liver compared to bovine liver [Eurell and Frappier; 2006]. There have been two previous studies which have investigated the tensile failure properties of bovine liver parenchyma using similar methods as the current study at a strain rate of 0.7 s–1 [Santago et al., 2009a; Santago et al., 2009b]. The average failure stress and failure strain of the fresh non-frozen bovine tissue presented in these studies was found to be comparable to the results of the testing conducted at rate 3 (0.871 s–1) in the current study (Figure 14 and Figure 15). Although the failure stress and failure strain of the human liver was found to be slightly higher than that of bovine liver, the differences were not significant (p> 0.05).
Figure 14.
Comparison of Failure Stress between Human and Bovine Liver.
Figure 15.
Comparison of Failure Strain between Human and Bovine Liver.
The comparison of the current study to previous studies involving animal tissue illustrates that differences in the parenchyma structure between animal and human liver can result in significant differences in the material response. The majority of previous studies have used animal liver as a surrogate for human liver. However, this study demonstrates that liver of a given animal species cannot be assumed to be a suitable surrogate for that of human liver when developing tissue level tolerance values for FEMs used to predict injuries of human motor vehicle occupants. Logically, it is essential to perform biomechanical testing on both human liver and the liver of a potential animal surrogate in order to determine if quantitative and qualitative differences exist.
Although there is currently no published data on the tensile material properties of isolated human liver parenchyma, Stingl et al. (2002) performed tension tests on strips of isolated human liver capsule and strips of liver capsule with subcapsular tissue attached. Stingl et al. (2002) reported the average failure stress for isolated human liver capsule specimens and capsule/subcapsular specimens to be 203.07 ± 138.01 kPa and 167.86 ± 85.38 kPa, respectively. Although Stingl et al. (2002) did not report a loading rate, it can be assumed the tests were performed at a relatively static rate based on the testing machine used. The lowest loading rate in the current study resulted in an average failure stress of 40.21 ± 21.39 kPa. This comparison indicates that the capsule of the liver is considerably stronger than the underlying parenchyma, which is to be expected given that the capsule is comprised almost entirely of collagen [Mazza et al., 2007].
One of the complications associated with the testing of soft tissue is the determination of a consistent initial state of strain due to the extremely compliant nature of soft tissue. In order to address this issue previous studies have defined the point of “zero strain” with an arbitrary force value [Tamura et al., 2002]. In the current study, specimens were allowed to hang in 1 g of tension prior to clamping the bottom grip. This was done because preliminary tension tests performed with specimens mounted on a horizontal test setup resulted in large inconsistent toe regions and first-mode vibration due to initial specimen slack. By allowing the specimens to hang under their own weight during the clamping process, all specimens had a minimal but consistent initial preload. If this procedure was not performed then the responses of each specimen could not be directly compared due to differences in the initial state of strain and the adverse effects of specimen vibration.
Although the 1 g initial condition used in the current study provided a consistent initial state of strain for all specimens, the effect of this condition on the toe region of the stress versus strain curve should be addressed in future studies. To that end, the authors have performed a preliminary study using bovine liver in order to quantify the deformation resulting from the 1 g initial condition. In this study the hepatic artery and vein of two whole bovine livers were perfused to physiologic pressures. Then white enamel paint was injected into the liver parenchyma with two syringes using 18 gage needles spaced 10 mm apart. A custom jig was used to hold both syringes a set distance apart so that the two injections could be performed simultaneously. In addition, a small aluminum plate with syringe needle guide holes spaced 10 mm apart was placed on the surface of the liver prior to performing the injection. The injections resulted in two parallel lines of paint in the perfused liver parenchyma. After the injections, tension coupon samples were prepared using the same methods described in this paper. During the slicing process, the cubes of liver were positioned in the slicing jig such that the slicing blades were orthogonal to the two parallel lines of paint. Special care was taken during the stamping process to ensure that the two injection sites, identified by dots of white paint, were centered in the gage length. The specimens were then mounted on the experimental setup using the same method described in this paper and photographed with a high resolution digital camera. The stretch ratio and Green-Lagrangian strain were calculated using the original ex vivo distance between the paint dots, Lo=10 mm, and the distance between the two paint dots under 1 g of tension, Ln. The average stretch ratio and strain of 14 specimens under 1g of tension were 1.12 ± 0.06 and 0.13 ± 0.06 strain, respectively. Based on the average width, thickness, one half of the specimen mass, and initial stretch ratio the average initial 2nd Piola Kirchhoff stress due to 1 g of tension was 0.465 kPa. Since 2nd Piola Kirchhoff stress is related to stretch ratio, the stress due to 1 g of tension cannot be simply added to the existing curves. Similarly, the strain due to 1 g of tension cannot be added to the existing curves because Green-Lagrangian strain is non-linearly related to stretch ratio. Therefore, the characteristic averages were recalculated to adjust for the average initial stretch ratio and initial stress due to 1 g of tension (Figure 16). Although the adjusted characteristic averages in Figure 16 provide an indication of the in vivo material response of liver parenchyma, additional testing should be conducted to quantify the effect of the 1 g initial condition.
Figure 16.
Adjusted Characteristic Averages.
CONCLUSION
This study presents a total of 51 uniaxial tension tests performed on human liver parenchyma dog-bone specimens within 48 hours of death. Each specimen was tested once to the point of failure at one of four loading rates (0.008 s–1, 0.089 s–1, 0.871 s–1, and 9.477 s–1) to investigate effects of rate dependence. The data from this study shows that the response of human liver parenchyma was non-linear in tensile loading for all loading rates. The results of the current study also showed that the reponse of liver parenchyma varied with repect to loading rate, with higher rate tests giving higher failure stresses and lower failure strains. The failure strains for all tests ranged from 11% to 54% and the failure stresses ranged from 7 kPa to 95 kPa. In summary, this study provides novel biomechanical data that can be used in the development of both rate dependant material models and tissue level tolerance values critical to the validation of finite element models used to assess injury risk in motor vehicle collisions. The development of finite element models with improved injury risk assessment capabilities would provide researchers and safety engineers with a more accurate tool to evaluate the effectiveness of both new and existing safety restraint technologies, which are integral in the mitigation of abdominal injuries and fatalities.
Figure 8.
Stress vs. Strain Curves for Rate 2 Tests.
Figure 9.
Stress vs. Strain Curves for Rate 3 Tests.
Acknowledgments
The authors would like to thank Toyota Motor Corporation for funding for this research.
APPENDIX
Table A1.
Peak Stress, Peak Strain, and Strain Rate for Rate 1 Tests.
| Test ID | Subject ID | Peak Strain | Peak Stress | Strain Rate |
|---|---|---|---|---|
| (strain) | (kPa) | (s–1) | ||
| L1_14 | 1 | 0.54 | 50.82 | 0.007 |
| L1_15 | 1 | 0.53 | 35.73 | 0.007 |
| L1_16 | 2 | 0.41 | 37.14 | 0.010 |
| L1_18 | 2 | 0.51 | 34.24 | 0.009 |
| L1_23 | 3 | 0.25 | 7.71 | 0.009 |
| L1_24 | 3 | 0.23 | 6.86 | 0.009 |
| L1_25 | 3 | 0.18 | 20.24 | 0.008 |
| L1_26 | 4 | 0.39 | 83.53 | 0.007 |
| L1_27 | 4 | 0.35 | 45.69 | 0.008 |
| L1_31 | 4 | 0.30 | 67.41 | 0.009 |
| L1_36 | 5 | 0.20 | 15.33 | 0.009 |
| L1_38 | 6 | 0.31 | 34.90 | 0.009 |
| L1_39 | 6 | 0.20 | 57.20 | 0.008 |
| L1_40 | 6 | 0.35 | 62.60 | 0.007 |
| L1_46 | 7 | 0.40 | 38.48 | 0.008 |
| L1_47 | 7 | 0.32 | 45.54 | 0.007 |
| Average | 0.34 | 40.21 | 0.008 | |
| Standard Deviation | 0.12 | 21.39 | 0.001 | |
Table A2.
Peak Stress, Peak Strain, and Strain Rate for Rate 2 Tests.
| Test ID | Subject ID | Peak Strain | Peak Stress | Strain Rate |
|---|---|---|---|---|
| (strain) | (kPa) | (s–1) | ||
| L2_14 | 1 | 0.33 | 68.41 | 0.083 |
| L2_16 | 2 | 0.40 | 32.84 | 0.118 |
| L2_17 | 2 | 0.32 | 45.50 | 0.093 |
| L2_24 | 3 | 0.21 | 10.29 | 0.095 |
| L2_27 | 3 | 0.31 | 14.13 | 0.109 |
| L2_28 | 3 | 0.27 | 17.50 | 0.083 |
| L2_32 | 4 | 0.32 | 59.65 | 0.088 |
| L2_33 | 4 | 0.31 | 82.91 | 0.078 |
| L2_34 | 4 | 0.35 | 57.50 | 0.086 |
| L2_44 | 6 | 0.27 | 70.81 | 0.073 |
| L2_45 | 7 | 0.38 | 55.19 | 0.078 |
| Average | 0.32 | 46.79 | 0.089 | |
| Standard Deviation | 0.05 | 24.81 | 0.014 | |
Table A3.
Peak Stress, Peak Strain, and Strain Rate for Rate 3 Tests.
| Test ID | Subject ID | Peak Strain | Peak Stress | Strain Rate |
|---|---|---|---|---|
| (strain) | (kPa) | (s–1) | ||
| L3_11 | 1 | 0.51 | 50.53 | 0.998 |
| L3_18 | 2 | 0.21 | 38.80 | 0.818 |
| L3_19 | 2 | 0.37 | 61.85 | 0.859 |
| L3_25 | 3 | 0.27 | 17.86 | 0.880 |
| L3_26 | 3 | 0.23 | 12.94 | 1.050 |
| L3_30 | 3 | 0.21 | 29.98 | 0.826 |
| L3_31 | 4 | 0.44 | 62.26 | 0.948 |
| L3_32 | 4 | 0.33 | 95.34 | 0.838 |
| L3_33 | 4 | 0.25 | 66.68 | 0.857 |
| L3_38 | 6 | 0.32 | 91.12 | 0.898 |
| L3_42 | 7 | 0.29 | 44.65 | 0.734 |
| L3_43 | 7 | 0.22 | 59.33 | 0.745 |
| Average | 0.30 | 52.61 | 0.871 | |
| Standard Deviation | 0.10 | 25.73 | 0.093 | |
Table A4.
Peak Stress, Peak Strain, and Strain Rate for Rate 4 Tests.
| Test ID | Subject ID | Peak Strain | Peak Stress | Strain Rate |
|---|---|---|---|---|
| (strain) | (kPa) | (s–1) | ||
| L4_7 | 1 | 0.30 | 90.90 | 8.841 |
| L4_9 | 2 | 0.21 | 89.39 | 8.136 |
| L4_11 | 2 | 0.34 | 39.43 | 10.853 |
| L4_22 | 3 | 0.24 | 35.11 | 11.531 |
| L4_23 | 4 | 0.23 | 65.71 | 10.019 |
| L4_24 | 4 | 0.17 | 82.23 | 6.332 |
| L4_26 | 4 | 0.19 | 59.51 | 7.254 |
| L4_27 | 5 | 0.15 | 19.80 | 10.193 |
| L4_28 | 5 | 0.11 | 26.19 | 9.908 |
| L4_29 | 6 | 0.27 | 76.84 | 10.668 |
| L4_32 | 6 | 0.25 | 69.73 | 7.137 |
| L4_34 | 7 | 0.35 | 77.42 | 12.856 |
| Average | 0.24 | 61.02 | 9.477 | |
| Standard Deviation | 0.07 | 24.89 | 1.964 | |
REFERENCES
- Augenstein J, Bowen J, Perdeck E, Singer M, Stratton J, Horton T, Rao A, Digges KH, Malliaris AC, Steps J. Injury Patterns in Near-Side Collisions. SAE 2000 World Congress: SAE International; 2000. [Google Scholar]
- Bacha W, Bacha L. Color Atlas of Veterinary Histology. 2nd Edition. Baltimore: Lippincott Williams & Wilkins; 2000. [Google Scholar]
- Bondy N. Abdominal Injuries in the National Crash Severity Study. National Center for Statistics and Analysis. 1980:59–80. [Google Scholar]
- Christmas A, Wilson A, Manning B, Franklin G, Miller F, Richardson J, Rodriquez J. Selective Managment of Blunt Hepatic Injuries Including Nonoperative Management is a Safe and Effective Strategy. Surgery. 2005;138(4):606–610. doi: 10.1016/j.surg.2005.07.018. [DOI] [PubMed] [Google Scholar]
- Elhagediab A, Rouhana S. Patterns of Abdominal Injury in Frontal Automotive Crashes. The 16th International Technical Conference on the Enhanced Safety of Vehicles; 1998. [Google Scholar]
- Eurell J, Frappier B. Dellmann’s Textbook of Veterinary Histology. 6th Edition. Ames: Blackwell Publishing; 2006. [Google Scholar]
- Fabian T, Bee T. Liver and Biliary Tract Trauma. In: Moore EE, Feliciano DV, Mattox KL, editors. Trauma. 5th ed. New York: McGraw-Hill; 2003. pp. 637–662. [Google Scholar]
- Holbrook T, Hoyt D, Eastman A, Sise M, Kennedy F, Velky T, Conroy C, Pacyna S, Erwin S. The Impact of Safety Belt Use on Liver Injuries in Motor Vehicle Crashes: The Importance of Motor Vehicle Safety Restrain Systems. Journal of Trauma. 2007;23(2):300–306. doi: 10.1097/TA.0b013e318074de05. [DOI] [PubMed] [Google Scholar]
- Hollenstein M, Nava A, Valtorta D, Snedeker JG, Mazza E. Mechanical Characterization of the Liver Capsule and Parenchyma. In: Szekely MHG, editor. Biomedical Simulation. Berlin/Heidelberg: Springer-Verlag; 2006. pp. 150–158. [Google Scholar]
- Hurtuk M, Reed R, Esposito T, Davis K, Luchette F. Trauma Surgeons Practice what the Preach: The NTDB Story on Solid Organ Injury Management. Journal of Trauma. 2006;61(2):243–255. doi: 10.1097/01.ta.0000231353.06095.8d. [DOI] [PubMed] [Google Scholar]
- Kemper A, McNally C, Kennedy E, Manoogian S, Rath A, Ng T, Stitzel J, Smith E, Duma S, Matsuoka F. Material Properties of Human Rib Cortical Bone from Dynamic Tension Coupon Testing. Stapp Car Crash Journal. 2005;49:199–230. doi: 10.4271/2005-22-0010. [DOI] [PubMed] [Google Scholar]
- Kemper A, McNally C, Pullins C, Freeman L, Duma S, Rouhana S. The Biomechanics of Human Ribs: Material and Structural Properties from Dynamic Tension and Bending Tests. Stapp Car Crash Journal. 2007;51:235–273. doi: 10.4271/2007-22-0011. [DOI] [PubMed] [Google Scholar]
- Kennedy E, Ng T, McNally C, Stitzel J, Duma S. Risk Functions for Human and Porcine Eye Rupture Based on Projectile Characteristics of Blunt Objects. Stapp Car Crash Journal. 2006;50:651–671. doi: 10.4271/2006-22-0026. [DOI] [PubMed] [Google Scholar]
- Kerdok A, Ottensmeyer M, Howe R. Effects of Perfusion on the Viscoelastic Characteristics of Liver. Journal of Biomechanics. 2006;(39):2221–2231. doi: 10.1016/j.jbiomech.2005.07.005. [DOI] [PubMed] [Google Scholar]
- Lessley D, Crandall J, Shaw G, Funk J, Kent R. SAE Technial Paper Series. Detriot, MI: 2004. A Normalization Technique for Developing Corridors from Individual Subject Responses. [Google Scholar]
- Mackenzie E, Fowler C. Epidemiology. In: Moore EE, Feliciano DV, Mattox KL, editors. Trauma. 5th ed. New York: McGraw-Hill; 2003. pp. 21–39. [Google Scholar]
- Manoogian S, Bisplinghoff J, McNally C, Kemper A, Santago A, Duma S. Dynamic Properties of Human Placenta. Journal of Biomechanics. 2008a;41:3436–3440. doi: 10.1016/j.jbiomech.2008.09.020. [DOI] [PubMed] [Google Scholar]
- Manoogian S, McNally C, Stitzel J, Duma S. Dynamic Biaxial Tissue Properties of Pregnant Porcine Uterine Tissue. Stapp Car Crash Journal. 2008b;52:167–185. doi: 10.4271/2008-22-0007. [DOI] [PubMed] [Google Scholar]
- Manoogian S, Bisplinghoff J, McNally C, Kemper A, Santago A, Duma S. Effect of Strain Rate on the Tensile Material Properties of Human Placenta. Journal of Biomedical Engineering. 2009;131(9):091008. doi: 10.1115/1.3194694. [DOI] [PubMed] [Google Scholar]
- Matthews J, Martin J. Atlas of Human Histology and Ultrastructure. Philadelphia: Lea & Febiger; 1971. [Google Scholar]
- Mazza E, Nava A, Hahnloser D, Jochum W, Bajka M. The Mechanical Response of Human Liver and its Relation to Histology: An In Vivo Study. Medical Image Analysis. 2007;11:633–672. doi: 10.1016/j.media.2007.06.010. [DOI] [PubMed] [Google Scholar]
- Melvin J, Stalnaker R, Roberts V, Trollope M. Proceedings of the 17th Stapp Car Crash Conference. Society of Automotive Engineers; Warrendale, PA: 1973. Impact Injury Mechanisms in Abdominal Organs; pp. 115–126. [Google Scholar]
- Moorcroft D, Duma S, Stitzel J, Duma G. Computational Model of the Pregnant Occupant: Predicting the Risk of Injury in Automobile Crashes. American Journal of Obstetrics and Gynecology. 2003;189(2):540–544. doi: 10.1067/s0002-9378(03)00519-2. [DOI] [PubMed] [Google Scholar]
- Nasseri S, Bilston L, Tanner R. Lubricated Squeezing Flow: A Useful Method for Measuring the Viscoelastic Properties of Soft Tissue. Biorheology. 2003;40:545–551. [PubMed] [Google Scholar]
- Roan E, Vemaganti K. The Non-Linear Material Properties of Liver Tissue Determined from No-Slip Uniaxial Compression Experiments. Transactions of ASME. 2007;129:450–456. doi: 10.1115/1.2720928. [DOI] [PubMed] [Google Scholar]
- Ross M, Pawlina W. Histology- A Text and Atlas with Correlated Cell and Molecular Biology. 5th Edition. Baltimore: Lippincott Williams & Wilkins; 2006. [Google Scholar]
- Rouhana S, Foster M. Proceedings of the 29th Stapp Car Crash Conference. Society of Automotive Engineers; Warrendale, PA: 1985. Lateral Impact – An Analysis of the Statistics in the NCSS; pp. 79–98. [Google Scholar]
- Santago A, Kemper A, McNally C, Sparks J, Duma S. The effect of Temperature on the Mechanical Properties of Bovine Liver. Biomed. Sci. Instrum. 2009a;45:376–381. [PubMed] [Google Scholar]
- Santago A, Kemper A, McNally C, Sparks J, Duma S. Freezing Affects the Mechanical Properties of Bovine Liver. Biomed. Sci. Instrum. 2009b;45:24–29. [PubMed] [Google Scholar]
- Sparks J, Bolte J, Dupaix R, Jones K, Steinberg S, Herriott R, Stammen J, Donnelly B. Using Pressure to Predict Liver Injury Risk from Blunt Impact. Stapp Car Crash Journal. 2007;51:401–432. doi: 10.4271/2007-22-0017. [DOI] [PubMed] [Google Scholar]
- Stingl J, Baca V, Cech P, Kovanda J, Kovandova H, Mandys V, Rejmontova J, Sosna B. Morphology and some biomechanical properties of human liver and spleen. Surgical and Radiological Anatomy. 2002;24(5):285–289. doi: 10.1007/s00276-002-0054-1. [DOI] [PubMed] [Google Scholar]
- Stitzel J, Gayzik F, Joth J, Mercier J, Gage D, Morton K, Duma S, Payne R. Development of a Finite Element-Based Injury Metric for Pulmonary Contusion Part I: Model Development and Validation. Stapp Car Crash Journal. 2005a;49:271–289. doi: 10.4271/2005-22-0013. [DOI] [PubMed] [Google Scholar]
- Stitzel J, Hansen G, Herring I, Duma S. Blunt Trauma of the Aging Eye: Injury Mechanisms and Increasing Lens Stiffness. Archives of Ophthalmology. 2005b;123:789–794. doi: 10.1001/archopht.123.6.789. [DOI] [PubMed] [Google Scholar]
- Stitzel J, Danelson K, Gayzik F, Yu M, Martin S, Duma S. Bilateral Carotid Artery Injury Response in Side Impact Using a Vessel Model Integrated with a Human Body Model. Annals of Advances in Automotive Medicine. 2009;53:271–278. [PMC free article] [PubMed] [Google Scholar]
- Sokolis D, Boudoulas H, Karayannaaco P. Assessment of the Aortic Stress-Strain Relationship in Uniaxial Tension. Journal of Biomechanics. 2002;35:1213–1223. doi: 10.1016/s0021-9290(02)00073-8. [DOI] [PubMed] [Google Scholar]
- Takhounts E, Ridella S, Tannous R, Campbell J, Malone D, Danelson K, Stitzel J, Rowson S, Duma S. Investigation of Traumatic Brain Injuries Using the Next Generation of Simulated Injury Monitor (SIMon) Finite Element Head Model. Stapp Car Crash Journal. 2008;52:1–31. doi: 10.4271/2008-22-0001. [DOI] [PubMed] [Google Scholar]
- Tamura A, Omori K, Miki K, Lee J, Yang K, King A. Mechanical Characterization of Porcine Abdominal Organs. Stapp Car Crash Journal. 2002;46:55–69. doi: 10.4271/2002-22-0003. [DOI] [PubMed] [Google Scholar]
- Uehara H. A Study on the Mechanical Properties of the Kidney, Liver, and Spleen, by Means of Tensile Stress Test with Variable Strain Velocity. Journal of Kyoto Prefectural University of Medicine. 1995;104(1):439–451. [Google Scholar]
- Wang B, Wang G, Yan D, Liu Y. An Experimental Study on Biomechanical Properties of Hepatic Tissue Using a New Measuring Method. BioMedical Materials and Engineering. 1992;2:133–138. [PubMed] [Google Scholar]
- Yamada H. Strength of Biological Materials. Baltimore: Williams and Wilkins; 1970. [Google Scholar]
- Yeh W, Li P, Jeng Y, Hsu H, Kuo P, Li M, Yang P, Lee P. Elastic Modulus of Human Liver and Correlation to Pathology. Ultrasound in Med. & Biol. 2002;28(4):467–474. doi: 10.1016/s0301-5629(02)00489-1. [DOI] [PubMed] [Google Scholar]
- Zhang S. An Atlas of Histology. New York: Sprinnger-Verlag; 1999. [Google Scholar]


