

Abstract
Despite activity as single agent cancer therapies, Rapamycin (rapa) and its rapalogs may have their greatest effects when combined with other therapeutic modalities. In addition to direct antitumor activity, rapalogs reverse multiple tumor-intrinsic immune evasion mechanisms. These should facilitate tumor-specific T cell activity, but since rapa directly inhibits effector T cells, this potential immune enhancement is lost. We hypothesized that if T cells were rendered resistant to rapa they could capitalize on its downregulation of tumor immune evasion. We therefore modified T cells with a rapa-resistant mutant of mTor, mTorRR, and directed them to B lymphomas by coexpressing a chimeric antigen receptor (CAR) for CD19 (CAR.CD19-28ζ). T cells expressing transgenic mTorRR from a piggyBac transposon maintain mTor signaling, proliferate in the presence of rapa and retain their cytotoxic function and ability to secrete interferon-γ (IFNγ) after stimulation, effector functions that were inhibited by rapa in control T cells. In combination, rapa and rapa-resistant-CAR.CD19-28ζ-expressing T cells produced greater antitumor activity against Burkitt's lymphoma and pre-B ALL cell lines in vitro than CAR.CD19-28ζ T cells or rapa alone. In conclusion, the combination of rapa and rapa-resistant, CAR.CD19-28ζ-expressing T cells may provide a novel therapy for the treatment of B cell malignancies and other cancers.
Introduction
Adoptive immunotherapy with antigen-specific cytotoxic T lymphocytes offers several desirable features in comparison with currently available cancer therapeutics. Antigen-specific T cells are exquisitely specific and have minimal off-target effects. They can actively migrate to and penetrate both primary tumors and distant metastases, specifically expand in response to antigenic stimulation in vivo, and persist long-term. Indeed, transfer of virus-specific cytotoxic T lymphocytes or tumor-specific T cells has induced complete sustained remissions in Epstein–Barr virus-associated lymphoma,1,2,3,4,5 nasopharyngeal cancer,6 and melanoma.7 However, the broader application of T cell therapy for cancer is limited by inadequate presentation of poorly immunogenic tumor antigens and by the establishment of an immune-suppressive tumor environment that provides a barrier to immune-mediated elimination.
Investigators have evaluated the transgenic expression of artificial chimeric antigen receptors (CARs) on T cells to redirect their cytolytic activity to tumor-associated cell surface antigens.8,9 This strategy bypasses the requirement for tumor antigen presentation on major histocompatibility complex class I molecules, a process that is inhibited at many levels by most tumors.10 The efficacy of CARs can be improved, by incorporation of the intracellular signaling domains of costimulatory molecules, so that costimulation accompanies antigen-ligation of the CAR. Nonetheless, CAR-expressing T cells remain susceptible to suppression through inhibitory ligands expressed by tumors and by tumor stroma.11,12 Moreover, tumor cells upregulate antiapoptotic factors, like Mcl-1, which provides tumor cells with intrinsic resistance to granzyme B-mediated apoptosis,13,14 a primary killing mechanism of cytotoxic T cells.
Genetic manipulation of T cells to provide resistance to individual components of the suppressive tumor microenvironment is one means of overcoming tumor resistance to conventional effector cells, and a number of such approaches have been described.15,16,17,18,19,20 We have investigated an alternative strategy.
The AKT/mTor pathway is frequently dysregulated in tumors and is a central regulator of cell growth and survival. mTor contributes to tumor development by mediating tumor cell proliferation and angiogenesis and by upregulating genes involved in chemo-21 and immunoresistance.13,22,23,24,25 The mTor pathway can be targeted by small-molecule inhibitors, such as rapamycin (rapa) and its rapalogs, which have a similar mechanism of action.26 In preclinical studies, rapalogs have activity against a wide range of malignancies, but have produced few objective tumor responses as single agents. Consequently, there is increasing interest in combining rapalogs with other therapies. Many of the effects of mTor inhibition, such as downregulation of antiapoptotic factors like Mcl-113,22 and downregulation of inhibitory cytokines and ligands, such as interleukin-10 (IL-10), vascular endothelial growth factor (VEGF), and PD-L121,23,24,27,28 would be expected to enhance T cell function and survival and increase tumor sensitivity to immune elimination. Unfortunately, these potential therapeutic benefits are offset by the directly suppressive effects of these drugs on effector T cells. Therefore, we reasoned that if tumor-specific T cells could be made resistant to rapalogs, these two agents could be used in combination to produce a therapy that capitalizes on both the direct antitumor activity of the drug as well as on its previously untapped ability to enhance antitumor T cell responses. To this end, we engineered T cells to express a rapa-resistant mutant of mTor (mTorRR) together with a CAR (CAR.CD19-28ζ) targeting CD19 expressed on B cell malignancies, and evaluated the function and anti-lymphoma activity of these T cells in the presence and absence of rapa.
Results
The piggyBac transposon enabled the expression the mTorRR gene in T cells
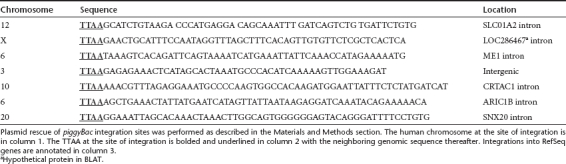
We first determined whether we could express a rapa-resistant mTor (mTorRR) in human T cells. The large size of the mTorRR open reading frame (7.8 kb) precluded the use of retrovirus or lentivirus vectors for stable gene transfer (data not shown). We have previously demonstrated the piggyBac transposon system to be capable of stable genetic modification of primary human T cells even with multiple genes or large genes.29 Therefore, we used the piggyBac transposon system to introduce mTorRR into peripheral blood mononuclear cells (PBMC). The mTorRR transposon and the green fluorescent protein (GFP) control transposon contain two markers, GFP and puromycin, either of which can be used for selection of transposon-containing cells (Figure 1a). PBMCs were co-transfected with a vector encoding the piggyBac transposase and the mTorRR or GFP-control transposon (all on separate plasmids) to generate mTorRR-expressing and control T cells, respectively. Transfected PBMCs were activated by culture with OKT3 antibody on irradiated feeder cells [either allogeneic PBMCs plus Epstein–Barr virus-transformed B cell lines or K562 cells genetically modified with CD80, CD83, CD86, 4-1BBL, and CD64 (aK562)] in the presence of IL-15. The initial (day 1) transfection efficiency was ~20% (range: 11–30%) for the mTorRR transposon and 40% (range: 19–76%) for the GFP-control transposon with an average recovery of viable cells of 31% ± 10% and 39% ± 14%, respectively. This level of transfection and recovery of cells is similar to our previous reports for primary human T cells.29 Stably transfected cells were selected based upon expression of one of the selectable markers (see Materials and Methods for details) and expanded by weekly stimulation with OKT3 on irradiated feeder cells with IL-15. Sufficient numbers of cells for experiments were generally obtained after the third stimulation (3 weeks in culture). After selection and expansion, the transfected T cells in each culture ranged from 35 to 90% for mTorRR and 66 to 90% for control (Figure 1b) as determined by fluorescence-activated cell sorting analysis of GFP expressed from the mTorRR or GFP-control transposons. Expression of the mTorRR transgene in transfected T cells was confirmed by western blot using an antibody to the HA tag. As shown in Figure 1c, culture in rapa increased mTorRR expression, suggesting a selective advantage for transduced cells in the presence of the drug. Furthermore, we confirmed that piggyBac was indeed able to integrate a large gene, such as mTorRR, into genomic DNA of primary human T cells by identifying integration sites of the mTorRR transposon. The locations of the genomic integration sites are listed in Table 1.
Figure 1.

Stable expression of a functional mTorRR transgene in human T cells. (a) Schematic of transposon vectors and transfection protocol. (b) Fluorescence-activated cell sorting (FACS) analysis of transfected T cells after selection for GFP+ cells. (c) Western blot for HA-mTorRR in transfected T cells after selection using puromycin. (d–e) Summary of intracellular staining for (d) phosphorylated ribosomal S6 protein or (e) phosphorylated AKTS473 in transfected T cells at the end of the third stimulation before and after addition of interleukin (IL)-15 (5 ng/ml) overnight. Data represent the mean ± SEM from paired T cell lines generated from four donors (gated on GFP+ cells). GFP, green fluorescent protein.
Table 1. mTorRR-piggyBac integrations in primary human T cells.
We next confirmed that the stably integrated mTorRR transgene was functional and maintained mTor signaling in T cells in the presence of rapa. mTor exists in two complexes. mTor associated with Raptor forms mTorC1 and is sensitive to rapa, and mTor associated with Rictor forms mTorC2 and is upstream of AKT and is generally resistant rapa.30 Therefore, we examined the phosphorylation status of ribosomal S6 protein, a downstream target and common readout of mTorC1 signaling, and AKTS473, a target of mTorC2 signaling. Ten days after their third stimulation and four days after addition of IL-15 (5 ng/ml), GFP-control and mTorRR-transfected T cells were treated with rapa (25 ng/ml) or vehicle control with and without the addition of IL-15 overnight prior to intracellular staining for phosphorylated ribosomal S6 protein and phosphophorylated AKTS473. Ribosomal S6 protein was phosphorylated in only about 10% of either GFP-control or mTorRR-transfected T cells without IL-15 and increased to ~60% of T cells receiving IL-15 (Figure 1d), indicating that mTorC1 activity was low in unfed cells and was activated by IL-15 signaling as expected. IL-15-induced activation of mTorC1 was substantially reduced in GFP-control cells treated with rapa, but not in mTorRR-expressing T cells under the same conditions, indicating that mTorRR is functional and maintains mTorC1 signaling in the T cells even in the presence of rapa. Ribosomal S6 protein remained phosphorylated in mTorRR-transfected T cells in rapa concentrations as high as 1,000 ng/ml (Supplementary Figure S1). In addition, we found that AKT is phosphorylated at serine 473 in ~20% of unfed GFP-control cells and ~30% of unfed mTorRR-expressing cells, and in both cases AKTS473 phosphorylation was increased by the addition of IL-15 (Figure 1e). The addition of rapa did not affect the phosphorylation of AKT at serine 473 in either GFP-control or mTorRR-expressing cells, suggesting that mTorC2 in T cells is not sensitive to rapa at least during this treatment timeframe.
mTorRR-expressing T cells expand in the presence of rapa
Having established that a functionally rapa-resistant mTorRR could be expressed in T cells, we next asked whether mTorRR could protect T cell effector functions from rapa. The antitumor efficacy of tumor-specific T cells in vivo requires T cells to proliferate, produce cytokines, and kill tumor cells. We therefore compared the effects of rapa in mTorRR-expressing and control T cells on these activities.
We stimulated selected, transfected T cells with OKT3 and IL-15 on irradiated allogenic feeder cells in the presence or absence of rapa (25 ng/ml). The T cells were counted and restimulated at the end of each 7-day expansion cycle. GFP-control and mTorRR-transfected T cells cultured in the absence of rapa expanded similarly (up to 1,000-fold) over 14 days (Figure 2a). However, in the presence of rapa, the expansion of GFP-control T cells fell by 52–90% (P = 0.04, n = 7) compared to untreated control cells. By contrast, expansion of mTorRR-transfected T cells was unaffected by the drug (895 ± 396-fold with rapa versus 984 ± 316-fold without rapa; P = NS).
Figure 2.

Expression of mTorRR in T cells maintains their ability to proliferate and expand in the presence of rapa. (a) The expansion of control or mTorRR-expressing T cells cultured in the presence or absence of rapa was determined at the end of each 7-day expansion cycle. Data represent the mean ± SEM for paired T cell lines generated from seven donors. *P = 0.04; control + rapa versus control. (b) Transfected T cells were labeled with PKH26 and proliferation was monitored by flow cytometry. Left: histograms are representative of paired T cell lines generated from seven donors (gated on GFP+ cells). Gray line is unstimulated T cells. T cells were stimulated with OKT3 and IL-15 in the absence (black line) or presence of rapa (dotted line). Right: graph represents the mean ± SEM of the proliferation of green fluorescent protein (GFP)-control and mTorRR-transfected T cells relative to their untreated counterparts (n = 7). (c) Apoptosis was determined by Annexin V/7-AAD staining of T cells after 5 days of culture with or without the indicated cytokines and in the presence or absence of rapa. Data represent the mean ± SEM from paired T cell lines generated from four donors (gated on CD3+GFP+ cells).
To understand the mechanism of rapa-mediated inhibition of control T cells, we compared proliferation and apoptosis in GFP-control and mTorRR-transfected T cells cultured in the presence of rapa. To examine proliferation, we labeled GFP-control and mTorRR-transfected T cells with PKH26 dye, stimulated them with OKT3 and IL-15 in the presence and absence of rapa, and measured the dilution of PKH26 fluorescence after 5 days by flow cytometry. Rapa substantially reduced the proliferation of GFP-control cells by 63% ± 10% relative to their untreated counterparts, whereas mTorRR-transfected T cells maintained a majority of their proliferative capacity in the presence of the drug (Figure 2b). Although mTorRR-transfected T cells are able to maintain their proliferation in the presence of rapa, these cells return to a resting state in the absence of cytokine and serum as indicated by a reduction in Ki-67 expression, a marker of cell proliferation (Supplementary Figure S2 and Supplementary Materials and Methods).
To examine the effects of rapa on T cell apoptosis, we cultured GFP-control and mTorRR-transfected T cells with IL-15 and in the presence of rapa for 5 days and then stained the cells with annexin V and 7-AAD. The percentage of apoptotic cells in GFP-control or mTorRR-transfected cells was <20%, and the addition of rapa did not significantly increase apoptosis in either case (Figure 2c). Similar results were obtained when cells were cultured in the presence of IL-2 or without any cytokine, although the overall level of apoptosis in both GFP-control and mTorRR-transfected T cells was higher in the absence of cytokine (Figure 2c). Together, these data suggest that rapa is cytostatic rather than cytolytic to T cells: reduced T cell expansion in the presence of rapa thus results largely from reduced proliferation, and this effect is overcome by mTorRR expression.
mTorRR-expressing T cells maintain their effector functions in the presence of rapa
We engineered GFP-control and mTorRR-transfected T cells that coexpressed a CAR that targets the CD19 antigen (CAR.CD19-28ζ) and transmits signals for cytolysis and IL-2 production through its ζ chain and CD28 signaling domains, respectively. These T cells were generated by co-transfecting a transposon encoding CAR.CD19-28ζ and the transposon encoding mTorRR (CAR.mTorRR) (or GFP-control; CAR.GFP) (Figure 3a) on separate plasmids. Cells were selected using the marker (either puro or GFP) present on the mTorRR transposon, and gene expression from each transposon was monitored by flow cytometry. T cells expressing CAR.CD19-28ζ ranged from 38 to 87% in the mTorRR co-transfected cultures and 44 to 77% in the GFP-control cultures, with a majority of CAR+ T cells coexpressing GFP (Figure 3b). Phenotypic analysis after selection and at the end of the third stimulation revealed that CAR.GFP and CAR.mTorRR cultures were similar containing both CD8+ and CD4+ cells that were predominantly CD45RO+ with a fraction expressing CD45RA, CD62L, CD27, or CD28 and limited expression of PD-1 (Figure 3c). Both CAR.GFP and CAR.mTorRR expressed the chemokine receptors such as CCR3, CCR5, CXCR2, CXCR3, and CXCR4 at similar levels with limited expression of CCR7 and CXCR1. These data suggest that the expression of mTorRR in T cells does not affect their overall phenotype.
Figure 3.

mTorRR-expressing T cells maintain their effector functions in the presence of rapa. (a) Transposon vectors used to generate T cells coexpressing CARCD19-28ζ and mTorRR (CAR.mTorRR) or CARCD19-28ζ and control vector (CAR.GFP). (b) CARCD19-28ζ and mTorRR can be coexpressed. Representative of paired T cell lines generated from 12 donors. (c) Phenotype of CAR.GFP and CAR.mTorRR T cells after selection and expansion. Data represent the mean ± SD for paired T cell lines generated from four donors (gated on CD3+GFP+ cells). (d) CAR.mTorRR and CAR.GFP T cells were restimulated and cultured in the presence and absence of rapa for 1 week and then used in a 4 hours cytotoxicity assay with Raji (CD19+) or HDLM-2 (CD19−) as targets. Effector to target ratio was 10:1. Data represent the mean ± SEM for paired T cell lines generated from five donors. *P = 0.01 (e) Intracellular staining for Granzyme B in CAR T cells 7 days after their 2nd stimulation in the presence (dotted line) or absence of rapa (black line). Shaded grey line is the isotype control. The figure is representative of paired T cell lines generated from three donors (gated on CD3+CAR+ cells). (f) CAR.GFP and CAR.mTorRR T cells were stimulated twice in the presence or absence of rapa and supernatants taken 24 hours after the second stimulation were analyzed for IFNγ. Data represent the mean ± SEM of the amount of IFNγ produced relative to their untreated counterparts from six different pairs of T cell lines generated from five different donors. GFP, green fluorescent protein.
We then verified that CAR.mTorRR and CAR.GFP T cells had comparable cytolytic activity against the CD19+ Burkitt's lymphoma cell line, Raji, in a standard 4-hour 51Cr release assays (Figure 3d). Control CAR.GFP T cells stimulated and cultured for 1 week in rapa were able to kill Raji cells, but their activity was reduced by 42% ± 13% (P = 0.01, n = 5) compared to their untreated counterparts. Expression of mTorRR, however, preserved the cytolytic activity of CAR.mTorRR T cells in the presence of the drug (Figure 3d). The ability of CAR.mTorRR T cells to maintain their cytolytic function in the presence of rapa corresponded to their sustained expression of granzyme B, a major cytotoxic effector molecule, after multiple stimulations in the presence of the drug (Figure 3e). In contrast, granzyme B expression was reduced in control CAR.GFP T cells stimulated in the presence of rapa.
We also assessed the ability of CAR.GFP and CAR.mTorRR T cells to secrete interferon-γ (IFNγ) in response to CD19+ Raji cells after culture in rapa. CAR.mTorRR and CAR.GFP cells were stimulated and cultured in the presence or absence of rapa for 1 week and then cocultured with Raji cells again in the presence or absence of rapa. Coculture supernatants harvested after 24 hours were analyzed for IFNγ by enzyme-linked immunosorbent assay. In the absence of rapa, both CAR.mTorRR and CAR.GFP T cells produced similar levels of IFNγ (69,611 ± 19,414 pg/ml/106 versus 63,708 ± 19,364 pg/ml/106 cells, respectively, n = 6, P = NS) in response to Raji cells, and while CAR.mTorRR T cells maintained their production of IFNγ even after multiple stimulations in rapa, IFNγ production by CAR.GFP T cells was consistently reduced compared to their untreated counterparts (Figure 3f). Together these data show that the functionality of T cells exposed to rapa is impaired and that these effects are avoided in cells expressing mTorRR.
The combination of Rapa with rapa-resistant CAR.CD19-28ζ T cells augments antitumor activity in vitro
We first examined the effects of rapa on tumor-intrinsic immune evasion mechanisms utilized by Raji cells, our model lymphoma line. We treated Raji cells overnight with rapa and determined the amount of the inhibitory cytokine, IL-10, and the angiogenic factor, VEGF, in cell culture supernatants by enzyme-linked immunosorbent assay. Rapa treatment reduced IL-10 production by 42% ± 13.5% and VEGF production by 45% ± 12% (Figure 4a). Rapa treatment also reduced the expression of the antiapoptotic factors, Mcl-1 and Bcl-xL, by 23% ± 8% (P = 0.02, n = 4) and 46% ± 21% (mean ± SD, n = 2), respectively (Figure 4b). As anticipated from their reduced expression of antiapoptotic factors, Raji cells that were pretreated with rapa were more readily killed by CAR.CD19-28ζ T cells in 4 hours cytotoxicity assays [50% ± 8% versus 34% ± 5% for pretreated and untreated, respectively, P = 0.004 (E:T) ratio, 5:1] (Figure 4c). Thus, rapa treatment simultaneously downregulates multiple immune-suppressive mechanisms utilized by Raji cells and has the potential to enhance the antitumor activity of T cells.
Figure 4.

Rapa treatment downregulates multiple immune evasion mechanisms and sensitizes Raji cells to T cell-mediated killing. (a) Raji cells were cultured on CD40L-expressing MRC5 cells in the presence or absence of 25 ng/ml Rapa and supernatants collected at 24 hours were analyzed by enzyme-linked immunosorbent assay (ELISA) for interleukin (IL)-10 (left, n = 3) and vascular endothelial growth factor (VEGF) (right, n = 3). Data represent the mean ± SD. (b) Mcl-1 (left) and Bcl-xL (right) expression in rapa treated (dotted) and untreated (black line) Raji cells was determined by intracellular staining and flow cytometry. Data are representative of four experiments (Mcl-1) and two experiments (Bcl-xL). (c) Raji cells and Raji cells pretreated overnight with rapa (PT-Raji) were used as targets for CAR.CD19 T cells in 4 hour chromium release assays. Data represent the mean ± SEM (n = 7) for T cell lines generated from five different donors.
We next evaluated the antitumor activity of Rapa when combined with CAR.mTorRR T cells. We cocultured CAR.mTorRR or CAR.GFP T cells with Raji cells in the presence or absence of rapa. We used tumor cell to T cell ratios that permitted expansion of the tumor cells even in the presence CAR-modified T cells and at the end of each assay, determined the total number of tumor cells remaining in each culture. We found an ~80% decrease (range 51–96%, n = 7) in the number of tumor cells in the presence of a combination of rapa and CAR.mTorRR T cells (Figure 5a), which was significantly better than the decrease in tumor cells obtained with CAR.mTorRR T cells alone (57 ± 8% decrease, P < 0.05), or with rapa and nonspecific T cells (39 ± 10% decrease, P < 0.001), or with the combination of rapa and CAR.GFP T cells (61 ± 9% decrease, P < 0.05). Hence, CAR.mTorRR T cells retain their function in the presence of rapa and the combination of cellular and drug therapy provides superior antitumor activity compared to either treatment alone.
Figure 5.

The combination of Rapa and rapa-resistant T cells exhibits superior antitumor activity in vitro. (a) Raji cells were cocultured with nonspecific (NS), CAR.GFP, or CAR.mTorRR T cells at various E:T ratios (1:1, 1:2, 1:3, or 1:6) in the presence or absence of rapa for 4–5 days. The total number of tumor cells in each culture condition at the end of each assay was determined and normalized to the number of tumor cells present with the nonspecific T cell control (set to 100%). Seven experiments using paired T cell lines generated from four different donors were analyzed individually and then compiled and summarized in the graph as the mean ± SEM of the compiled data. (b) CAR.mTorRR T cells were cocultured with SupB15 ALL cells (n = 7) at E:T ratios ranging from 1:10 to 1:30. The number of tumor cells in each culture at the end of the culture period is compared to the number of tumor cells in the control culture (without any treatment) set to 100%. Seven experiments using paired T cell lines generated from four different donors were analyzed individually and then complied and summarized in the graph as the mean ± SEM of the compiled data. GFP, green fluorescent protein.
To measure the effects of the CAR.mTorRR T cells and Rapa combination on other tumor cell lines, we cocultured our gene-modified T cells with the pre-B ALL line, SupB15. Once again, the combination of Rapa and CAR.mTorRR T cells had superior antitumor activity against the SupB15 tumor line compared with either treatment condition alone (Figure 5b).
Discussion
We have demonstrated that human T cells can be rendered resistant to rapa through the expression of a mutant of mTorS2035 (mTorRR) that has impaired binding to rapa but is otherwise functional.31 The large mTorRR transgene was successfully and stably expressed in T cells using the piggyBac transposase system after nucleofection. T cells expressing mTorRR maintained mTor signaling in the presence of rapa, which allowed them to expand and function similarly to T cells cultured in the absence of the drug. Moreover, the combination of rapa and rapa-resistant T cells, made tumor-specific through coexpression of CAR.CD19-28ζ, had superior antitumor activity against both Burkitt's lymphoma and acute lymphoblastic leukemia cell lines in vitro compared with either therapy alone, and correlated with the ability of rapa to inhibit tumor cell expansion and to downregulate their production of the antiapoptotic factors, Mcl-1 and Bcl-xL, and the inhibitory cytokines, IL-10 and VEGF. Thus, modifying T cells with mTorRR can overcome the negative effects of rapa on effector T cells and may provide for a novel combination therapy for cancer that exploits the immune enhancing properties of the drug.
Expression of mTorRR in human T cells did not appear to change the overall phenotype of the cells with respect to their lineage or memory cell markers or their expression of chemokine receptors. Moreover, while expression of mTorRR provided for maintanence of IL-15-induced mTorC1 signaling in the presence of rapa as indicated by phosphorylation of ribsomal S6 protein, its expression did not lead to elevated mTorC1 signaling in unfed cells, suggesting that even with transgenic expression of mTorRR, this complex remains subject to regulation by cytokine and nutrient availability. mTorC2 signaling was activated in both mTorRR-expressing and GFP-control T cells by IL-15 as indicated by an increase in phosphorylation of AKTS473 compared to unfed cells, but mTorC2 activity was not inhibited rapa during the timeframe of our assay, consistent with its known resistance to the drug.30 Although we found no significant difference in the percentage of cells with phosphorylated AKTS473 in mTorRR-expressing and GFP-control T cells fed with IL-15, a higher percentage of mTorRR-expressing cells had phosphorylated AKTS473 before feeding. These data suggest that expression of mTorRR may contribute to a higher basal activation of AKTS473, which could be beneficial for adoptively transferred T cells since we have previously shown that expression of a constitutively active AKT provides a survival advantage to human T cells, which nevertheless required stimulation with antigen and cytokine for growth in vitro,18 and we found that mTorRR-expressing T cells do, in fact, return to a resting state in the absence of cytokine and serum.
Overactive AKT/mTor signaling is common in many tumors and provides immunoresistance via multiple mechanisms. For example, activated AKT/mTor signaling in glioma, breast, and prostate cancer cells increases expression of the T cell inhibiting ligand, PDL-1,23,28,32 an effect that is inhibited by rapa. Furthermore, rapa downregulates expression of the immunosuppressive cytokines, VEGF27,21 and IL-10,24 as well as the expression of the antiapoptotic factor, Mcl-1,13,22 which provides resistance to granzyme B-mediated killing.13,14 Consistent with these observations, we found that Raji BL, our model lymphoma line, secreted IL-10 and VEGF and expressed Mcl-1 and Bcl-xL, all of which were reduced by treatment with the rapalog, temsirolimus. These observations suggest that targeting the AKT/mTor pathway could enhance T cell therapies by simultaneously downregulating multiple immune evasion mechanisms. However, the concept of combining rapa with cellular immunotherapies has been largely discounted because the drug is inhibitory to effector T cells.13,32
Despite the fact that rapa is inhibitory to effector T cells, the drug was shown to enhance the elimination of established transgenic fibrosarcomas and HCT116 colorectal cancer xenograft tumors by adoptively transferred naive splenocytes in tumor models.13 However, the large T cell numbers infused likely overcame the need for expansion. In our study we found that rapa improved the elimination of Raji cells by control CAR.GFP T cells, although this improvement did not reach statistical significance. These data can be explained by the observations that although rapa substantially inhibits T cell proliferation and decreases cytotoxic activity (Figures 2 and 3), the inhibition is not absolute, likely due to the expression of Pim kinases that can partially compensate for loss of mTor signaling.33 The ability of rapalogs to sensitize tumor cells to T cell-mediated killing may allow tumor cell elimination by T cells that have suboptimal function, which highlights the potential for synergy between these treatments. Nevertheless, the antitumor activity of adoptive T cell therapies is highly dependent upon the ability of the transferred T cells to proliferate and expand in vivo.6,34 Therefore, the suboptimal proliferation and function of control CAR.GFP T cells in the presence of rapa would be expected to hinder their effectiveness in vivo after transfer. However, mTorRR expression maintained the proliferative capacity and function of CAR.mTorRR T cells even in the presence of rapa, allowing combination with the drug to produce a significant increase in antitumor activity over control T cells with rapa in vitro. This combination may be even more potent in vivo where rapa may affect not only the tumor but also the tumor microenvironment. Of note, rapa inhibits the proliferation of effector T cells to a greater extent than the proliferation of T regulatory (Treg) cells, and thus favors the outgrowth of Tregs in in vitro cultures and increases the frequency of Tregs in vivo,30,35 which could be detrimental to antitumor immunity. However, by providing rapa-resistance to effector T cells, the balance between effector T cells and Tregs in the presence of rapa may be shifted back in favor of the effector T cells.
There is increasing interest in using rapalogs in combination with other cytotoxic agents,26 which based on this work, can now be extended to include cellular immunotherapies. Although we used rapa-resistant CAR.CD19-28ζ T cells in combination with rapa to target B cell lymphomas and leukemias in our study, this approach could be applied to the many other tumors that utilize mTor-dependent immune evasion mechanisms and for which we can generate tumor-specific T cells.
Materials and Methods
Cell lines and cell culture. PBMCs from healthy volunteers were obtained after informed consent on a protocol approved by the Baylor College of Medicine institutional review board. K562 cells, engineered to express CD64, CD80, CD83, CD86, and 4-1BBL,36 (aK562) were a gift from Carl June (University of Pennsylvania, Philadelphia, PA). These cells were further modified to stably express a truncated CD19 molecule (aK562.δCD19) by transfecting with pCMV-PB and pIRII-δCD1929 and selecting for CD19 expressing cells with CD19-microbeads (Miltenyi Biotec, Bisley, UK) according to the manufacturer's instructions. Raji (CD19+, Burkitt's lymphoma) and SupB15 (CD19+ preB-ALL) cell lines, were purchased from the American Type Culture Collection (Manassas, VA), and HDLM-2 (CD30+, CD19−, Hodgkin's lymphoma) was purchased from the German Collection of Microorganisms and Cell Cultures. These cell lines were cultured in RPMI 1640 (Hyclone, Logan, UT) supplemented with 10% heat-inactivated fetal bovine serum (Hyclone) and 2 mmol/l -glutamine (GlutaMAX-I; Invitrogen, Carlsbad, CA).
Plasmid construction. The piggyBac (PB)-transposase plasmid, pCMV-PB, and PB transposon plasmids, pIR-eGFP and pIRII-eGFP, have been described previously.29,37 pIR-mTorRRHA-eGFP was generated by digesting pRK5/HA-mTorRR (gift of George Thomas University of Cincinnati, Cincinnati, OH) with NruI/HindIII. Purified fragments were blunt-ended and cloned into the NheI site (blunt-ended) of the pIR-enhanced GFP (eGFP) transposon vector. pIR-mTorRR encodes the complementary DNA for rapa-resistant mTor S2035T with a hemagglutinin (HA) TAG at its N-terminus followed by an IRES element, eGFP expressed from a CMV promoter and the puromycin resistance gene cassette expressed from an SV40 promoter. pIRII-CAR.CD19-28ζ was generated by subcloning CAR.CD19-28ζ from pSL119-CD19CAR into the EcoRI and NotI sites of pIRII-IRES-eGFP. All plasmid constructs were confirmed by restriction digestion and/or DNA sequencing.
Transfection and expansion of T cells. PBMC were rested overnight in T cell media [Advanced RPMI (Invitrogen) supplemented with GlutaMAX-I (Invitrogen), 5 mmol/l N-acetyl Cysteine (Sigma-Aldrich, St Louis, MO) and 5% fetal bovine serum (Hyclone)] containing 5 ng/ml IL-15 (R&D Systems, Minneapolis, MN). The following day, 1 × 10⁷ PBMC were transfected with 5.7 µg pCMV-piggyBac and 5 µg pIR-mTorRR or 2.5 µg pIR-IRES-eGFP. For CAR.CD19-28ζ T cells, PBMC were transfected with 11.4 µg pCMV-piggyBac and 2.3 µg pIRII-CAR.CD19-28ζ and 5 µg pIR-mTorRR or 2.5 µg pIR-IRES-eGFP using the Amaxa T cell nucleofection kit (Lonza, Switzerland) and program U-014. Immediately following transfection, the cells were placed in 2 ml of prewarmed T cell media containing 5 ng/ml IL-15 in a 24-well plate and incubated overnight at 37 °C. Transfected cells were then stimulated with irradiated lymphoblastoid cells and allogeneic PBMC at a (1:1:5 ratio), 50 ng/ml OKT3 (OKT3 Hybridoma from American Type Culture Collection), and 5 ng/ml IL-15 and fed three times/week with 5 ng/ml IL-15.
Several selection methods were tested for enriching transfected T cells including (i) sorting for GFP+ cells by fluorescence-activated cell sorting after 1 week in culture (ii) CD34 microbead selection (Miltenyi Biotech, Auburn, CA) (when cells were transfected with a transposon vector in which a truncated CD34 was substituted for GFP), or (iii) selection for puromycin resistance encoded on the pIR-mTorRR and pIR-IRES-eGFP plasmids. Puromycin (500 ng/ml) was added to cultures starting the day after transfection and then three times/week for 2 weeks. All methods enriched for transfected T cells, but puromycin selection proved to be the most convenient method and was thus used for the generation of the majority of the paired T cell lines. After selection, T cells were expanded by weekly stimulation (1:1) with aK562 and OKT3 or aK562.δCD19 (for CAR.CD19 expressing T cells) in T cell media. IL-15 (5 ng/ml) was added to the media three times a week. For expansion of T cells in rapa, the rapalog, temsirolimus (LC Labs, Woburn, MA), was added to a final concentration of 25 ng/ml at the time of stimulation and then at each IL-15 feed. Temsirolimus, referred to as rapa for rapalog, was reconstituted in dimethyl sulfoxide, and dimethyl sulfoxide served as a vehicle control in experiments.
Recovery of integration sites. Genomic DNA was isolated from selected, PB transfected human T cells after 4 weeks of culture using a DNeasy kit (Qiagen, Valencia, CA). Ten micrograms of genomic DNA was digested with BglII restriction enzyme (which cuts just inside the 5′ IR) followed by self-ligation of fragments under dilute conditions (500 µl) using T4 DNA ligase (NEB, Ipswich, MA). Five microliters of ligated product was then used for two rounds of nested inverse PCR using primers;
P1 (AAGCGGCGACTGAGATGTCCTAAATG) and
P1R (GTCAATGCGGTAAGTGTCACTG) for the first round;
and P2 (GCGACGGATTCGCGCTATTTAGAAAG)
and P2R (TGAACTATAACGACCGCGTGAG) for the second round.
Amplified products were gel purified and TOPO-cloned into a TA cloning kit (Invitrogen) and sequenced to determine the site of integration. As described previously,37 we used the UC Santa Cruz BLAT genome web-browser (human, February 2009 assembly) to map PB integration sites in the human genome. We used ~80 bp of high-quality sequence starting immediately after the terminal TTAA in the IR element of the transposon segment for BLAT searches. We determined sequences to consist of true PB integration sites if (i) the genomic sequence began immediately after the terminal transposon TTAA, (ii) mapping of the genomic integration site revealed an intact immediate upstream TTAA target site where the integration occurred, and (iii) the DNA sequence was high quality and matched only one genomic location with >95% identity.
Flow cytometry. T cells were stained with phycoerythrin (PE)-, peridinin chlorophyll protein (PerCP)- or allophycocyanin-conjugated CD3, CD4, CD8, PD-1, CD45RO, CD45RA, CD62L, CD27, CD28, CD86, CCR3, CCR5, CCR7, CXCR1, CXCR2, CXCR3, and CXCR4 monoclonal antibodies (BD Bioscience, San Diego, CA). An Fc-specific Cy5 conjugated antibody that recognizes the IgG1 CH2CH3 component of the CAR (Jackson Immunoresearch, West Grove, PA) was used to detect CAR on transfected cells. For intracellular staining of phosphorylated ribosomal S6 protein and phosphorylated AKTS473, surface-stained cells were fixed in 4% paraformaldehyde, permeabilized in cold 90% methanol, and stained with an Alexa Fluor 647 conjugated monoclonal antibody specific for phosphorylated ribosomal S6 protein (Ser235/236) and PE-conjugated monoclonal antibody specific for phospho-AKT (Ser473) or isotype control antibodies (Cell Signaling Technologies, Danvers, MA). For intracellular Granzyme B, Mcl-1, Bcl-xL staining, cells were fixed in 4% paraformaldehyde, permeabilized in 1% Saponin in phosphate-buffered saline containing 1% fetal bovine serum, and stained with PE-conjugated Granzyme B antibody (BD Bioscience) or unconjugated primary Mcl-1 or Bcl-xL antibodies (Santa Cruz Biotechnology, Santa Cruz, CA). Cells were washed in 0.1% Saponin buffer and PE-conjugated anti-rabbit or anti-mouse secondary antibody (Jackson Immunoresearch) was added to the Mcl-1 and Bcl-xL stained cells, respectively. Cells were acquired on a FACSCalibur (BD Biosciences, San Jose, CA) and data analyzed using FCS Express software.
Western blots. Cells were lysed in a buffer containing 50 mmol/l Tris, pH 7.4, 150 mmol/l NaCl, 5 mmol/l EDTA, 1% Triton and complete protease inhibitor cocktail (Thermo Scientific, Rockford, IL). Cleared cell lysate (25–50 µg) was resolved on sodium dodecyl sulfate-polyacrylamide gels, transferred to PVDF membranes, blocked with 5% nonfat milk, and immunoblotted with specific antibodies for HA (Covance, Princeton, NJ) and vinculin (Sigma-Aldrich). Autoradiography of the membranes was performed using Amersham ECL western blotting detection reagents (GE Healthcare Life Sciences, Piscataway, NJ).
T cell proliferation and apoptosis. To analyze T cell proliferation, control or mTorRR-expressing T cells were labeled with PKH26 dye (Sigma-Aldrich) according to manufacturer's instructions and plated in 24-well plates coated with OKT3 in the presence of low dose IL-15 (2.5 ng/ml) with or without temsirolimus (25 ng/ml), and after 5 days, the dilution of PKH26 dye was measured by flow cytometry. To analyze apoptosis, control and mTorRR-expressing T cells were cultured in the presence or absence of 25 ng/ml temsirolimus or vehicle control without cytokine, with 5 ng/ml IL-15 or with 50 U/ml IL-2 for 5 days and then stained with PE-conjugated Annexin V and 7-AAD (BD Bioscience) according to the manufacturer's instructions followed by fluorescence-activated cell sorting analysis.
Cytotoxicity. We used a standard 4-hour 51Cr release assay to evaluate the cytotoxic activity of transfected T cells. Control CAR.CD19-28ζ or Rapa-resistant CAR.CD19-28ζ were stimulated with aK562.δCD19 cells and 5 ng/ml IL-15 in the presence or absence of 25 ng/ml temsirolimus for 1 week and then used as effector cells to target 51Cr-labeled Raji cells (CD19+) or HDLM-2 (CD19−) using an E/T ratio of 10:1. For experiments using Raji cells pretreated with temsiroliums, the Raji cells were incubated overnight in media containing 25 ng/ml temsirolimus, which was washed out before 51Cr labeling. The E:T ratio in these experiments was 5:1.
Cytokine production. Nonspecific, control CAR.CD19-28ζ or Rapa-resistant CAR.CD19-28ζ T cells were cultured with Raji cells at an E:T ratio of 1:3 in the presence or absence of 25 ng/ml temsirolimus and supernatants collected after 24 hours were measured for the level of IFNγ by enzyme-linked immunosorbent assay (R&D Systems). Raji cells were cultured on CD40L-expressing MRC5 cells in the presence or absence of 25 ng/ml temsirolimus and supernatants collected at 24 hours were analyzed by enzyme-linked immunosorbent assay for the levels of IL-10 (R&D Systems) and VEGF (Thermo Scientific).
Coculture. Raji cells (5 × 10⁵) were cultured in 24-well plates with nonspecific, control CAR.CD19-28ζ or Rapa-resistant CAR.CD19-28ζ T cells at various E:T ratios (1:1, 1:2, 1:3, and 1:6) for 4–5 days without cytokine and with or without the addition of 25 ng/ml temsirolimus. At the end of the culture period, cells in each culture were counted by Trypan blue exclusion, stained with antibodies against CD3 (to distinguish the T cells) and CD20 (to distinguish the tumor cells), and analyzed by flow cytometry to determine the number of tumor cells in each culture. To compare the antitumor activity of each treatment in the assay, the number of tumor cells present under each culture condition was normalized to the number of tumor cells present in the cultures with nonspecific T cells. For cocultures with the SupB15 acute lymphoblastic leukemia line, 5 × 10⁵ tumor cells were cultured with or without 25 ng/ml temsirolimus and with or without Rapa-resistant CAR.CD19-28ζ T cells for 4 days. The E:T ratios ranged from 1:10 up to 1:30 depending on the donor T cells. At the end of the culture period, the cells were stained with antibodies against CD3 (identifying T cells) and CD19 (identifying tumor cells) and 7-AAD and Countbright beads (Invitrogen) were added, according to manufacturer's instructions, before analysis by flow cytometry. Five thousand Countbright beads were acquired for each sample, and the number of viable tumor cells calculated using the formula: (number of CD19+ events/number of bead events) × (number of beads added/sample volume).
Statistics. Data are shown as the mean ± SEM unless otherwise indicated. The Student's t-test was used to determine the statistical significance of differences between samples, with P values <0.05 indicating a significant difference. The statistical significance of results in coculture assays was evaluated by a repeated measures ANOVA followed by a Newman–Keuls test for multiple comparisons. P values <0.05 was considered statistically significant.
SUPPLEMENTARY MATERIAL Figure S1. mTorRR-expressing T cells maintain mTor signaling in the presence of high concentrations of rapa. Figure S2. mTorRR-expressing T cells return to the resting state in the absence of cytokine and serum. Materials and Methods.
Acknowledgments
We thank Reshma Kulkarni for assistance with flow cytometry. This work was supported by the William Lawrence and Blanche Hughes Foundation, by NIH-NCI Lymphoma SPORE P50 CA126752, and by NIH-NCI P01 CA094237.
Supplementary Material
mTorRR-expressing T cells maintain mTor signaling in the presence of high concentrations of rapa.
mTorRR-expressing T cells return to the resting state in the absence of cytokine and serum.
REFERENCES
- Bollard CM, Aguilar L, Straathof KC, Gahn B, Huls MH, Rousseau A.et al. (2004Cytotoxic T lymphocyte therapy for Epstein-Barr virus+ Hodgkin's disease J Exp Med 2001623–1633. [DOI] [PMC free article] [PubMed] [Google Scholar]
- Heslop HE, Ng CY, Li C, Smith CA, Loftin SK, Krance RA.et al. (1996Long-term restoration of immunity against Epstein-Barr virus infection by adoptive transfer of gene-modified virus-specific T lymphocytes Nat Med 2551–555. [DOI] [PubMed] [Google Scholar]
- Rooney CM, Smith CA, Ng CY, Loftin S, Li C, Krance RA.et al. (1995Use of gene-modified virus-specific T lymphocytes to control Epstein-Barr-virus-related lymphoproliferation Lancet 3459–13. [DOI] [PubMed] [Google Scholar]
- Rooney CM, Smith CA, Ng CY, Loftin SK, Sixbey JW, Gan Y.et al. (1998Infusion of cytotoxic T cells for the prevention and treatment of Epstein-Barr virus-induced lymphoma in allogeneic transplant recipients Blood 921549–1555. [PubMed] [Google Scholar]
- Bollard CM, Huls MH, Buza E, Weiss H, Torrano V, Gresik MV.et al. (2006Administration of latent membrane protein 2-specific cytotoxic T lymphocytes to patients with relapsed Epstein-Barr virus-positive lymphoma Clin Lymphoma Myeloma 6342–347. [DOI] [PubMed] [Google Scholar]
- Pule MA, Savoldo B, Myers GD, Rossig C, Russell HV, Dotti G.et al. (2008Virus-specific T cells engineered to coexpress tumor-specific receptors: persistence and antitumor activity in individuals with neuroblastoma Nat Med 141264–1270. [DOI] [PMC free article] [PubMed] [Google Scholar]
- Rosenberg SA., and, Dudley ME. Adoptive cell therapy for the treatment of patients with metastatic melanoma. Curr Opin Immunol. 2009;21:233–240. doi: 10.1016/j.coi.2009.03.002. [DOI] [PMC free article] [PubMed] [Google Scholar]
- Sadelain M, Brentjens R., and, Rivière I. The promise and potential pitfalls of chimeric antigen receptors. Curr Opin Immunol. 2009;21:215–223. doi: 10.1016/j.coi.2009.02.009. [DOI] [PMC free article] [PubMed] [Google Scholar]
- Dotti G, Savoldo B., and, Brenner M. Fifteen years of gene therapy based on chimeric antigen receptors: “are we nearly there yet?”. Hum Gene Ther. 2009;20:1229–1239. doi: 10.1089/hum.2009.142. [DOI] [PMC free article] [PubMed] [Google Scholar]
- Lampen MH., and, van Hall T. Strategies to counteract MHC-I defects in tumors. Curr Opin Immunol. 2011;23:293–298. doi: 10.1016/j.coi.2010.12.005. [DOI] [PubMed] [Google Scholar]
- Whiteside TL. The tumor microenvironment and its role in promoting tumor growth. Oncogene. 2008;27:5904–5912. doi: 10.1038/onc.2008.271. [DOI] [PMC free article] [PubMed] [Google Scholar]
- Leen AM, Rooney CM., and, Foster AE. Improving T cell therapy for cancer. Annu Rev Immunol. 2007;25:243–265. doi: 10.1146/annurev.immunol.25.022106.141527. [DOI] [PubMed] [Google Scholar]
- Hähnel PS, Thaler S, Antunes E, Huber C, Theobald M., and, Schuler M. Targeting AKT signaling sensitizes cancer to cellular immunotherapy. Cancer Res. 2008;68:3899–3906. doi: 10.1158/0008-5472.CAN-07-6286. [DOI] [PubMed] [Google Scholar]
- Han J, Goldstein LA, Gastman BR, Rabinovitz A., and, Rabinowich H. Disruption of Mcl-1.Bim complex in granzyme B-mediated mitochondrial apoptosis. J Biol Chem. 2005;280:16383–16392. doi: 10.1074/jbc.M411377200. [DOI] [PubMed] [Google Scholar]
- Dotti G, Savoldo B, Pule M, Straathof KC, Biagi E, Yvon E.et al. (2005Human cytotoxic T lymphocytes with reduced sensitivity to Fas-induced apoptosis Blood 1054677–4684. [DOI] [PMC free article] [PubMed] [Google Scholar]
- Bollard CM, Rössig C, Calonge MJ, Huls MH, Wagner HJ, Massague J.et al. (2002Adapting a transforming growth factor β-related tumor protection strategy to enhance antitumor immunity Blood 993179–3187. [DOI] [PubMed] [Google Scholar]
- Vera JF, Hoyos V, Savoldo B, Quintarelli C, Giordano Attianese GM, Leen AM.et al. (2009Genetic manipulation of tumor-specific cytotoxic T lymphocytes to restore responsiveness to IL-7 Mol Ther 17880–888. [DOI] [PMC free article] [PubMed] [Google Scholar]
- Sun J, Dotti G, Huye LE, Foster AE, Savoldo B, Gramatges MM.et al. (2010T cells expressing constitutively active Akt resist multiple tumor-associated inhibitory mechanisms Mol Ther 182006–2017. [DOI] [PMC free article] [PubMed] [Google Scholar]
- Liu K., and, Rosenberg SA. Transduction of an IL-2 gene into human melanoma-reactive lymphocytes results in their continued growth in the absence of exogenous IL-2 and maintenance of specific antitumor activity. J Immunol. 2001;167:6356–6365. doi: 10.4049/jimmunol.167.11.6356. [DOI] [PMC free article] [PubMed] [Google Scholar]
- Hsu C, Hughes MS, Zheng Z, Bray RB, Rosenberg SA., and, Morgan RA. Primary human T lymphocytes engineered with a codon-optimized IL-15 gene resist cytokine withdrawal-induced apoptosis and persist long-term in the absence of exogenous cytokine. J Immunol. 2005;175:7226–7234. doi: 10.4049/jimmunol.175.11.7226. [DOI] [PMC free article] [PubMed] [Google Scholar]
- Jiang BH., and, Liu LZ. Role of mTOR in anticancer drug resistance: perspectives for improved drug treatment. Drug Resist Updat. 2008;11:63–76. doi: 10.1016/j.drup.2008.03.001. [DOI] [PMC free article] [PubMed] [Google Scholar]
- Mills JR, Hippo Y, Robert F, Chen SM, Malina A, Lin CJ.et al. (2008mTORC1 promotes survival through translational control of Mcl-1 Proc Natl Acad Sci USA 10510853–10858. [DOI] [PMC free article] [PubMed] [Google Scholar]
- Parsa AT, Waldron JS, Panner A, Crane CA, Parney IF, Barry JJ.et al. (2007Loss of tumor suppressor PTEN function increases B7-H1 expression and immunoresistance in glioma Nat Med 1384–88. [DOI] [PubMed] [Google Scholar]
- Nepomuceno RR, Balatoni CE, Natkunam Y, Snow AL, Krams SM., and, Martinez OM. Rapamycin inhibits the interleukin 10 signal transduction pathway and the growth of Epstein Barr virus B-cell lymphomas. Cancer Res. 2003;63:4472–4480. [PubMed] [Google Scholar]
- Mayerhofer M, Valent P, Sperr WR, Griffin JD., and, Sillaber C. BCR/ABL induces expression of vascular endothelial growth factor and its transcriptional activator, hypoxia inducible factor-1α, through a pathway involving phosphoinositide 3-kinase and the mammalian target of rapamycin. Blood. 2002;100:3767–3775. doi: 10.1182/blood-2002-01-0109. [DOI] [PubMed] [Google Scholar]
- Easton JB., and, Houghton PJ. mTOR and cancer therapy. Oncogene. 2006;25:6436–6446. doi: 10.1038/sj.onc.1209886. [DOI] [PubMed] [Google Scholar]
- Skinner HD, Zheng JZ, Fang J, Agani F., and, Jiang BH. Vascular endothelial growth factor transcriptional activation is mediated by hypoxia-inducible factor 1α, HDM2, and p70S6K1 in response to phosphatidylinositol 3-kinase/AKT signaling. J Biol Chem. 2004;279:45643–45651. doi: 10.1074/jbc.M404097200. [DOI] [PubMed] [Google Scholar]
- Crane CA, Panner A, Murray JC, Wilson SP, Xu H, Chen L.et al. (2009PI(3) kinase is associated with a mechanism of immunoresistance in breast and prostate cancer Oncogene 28306–312. [DOI] [PMC free article] [PubMed] [Google Scholar]
- Nakazawa Y, Huye LE, Dotti G, Foster AE, Vera JF, Manuri PR.et al. (2009Optimization of the PiggyBac transposon system for the sustained genetic modification of human T lymphocytes J Immunother 32826–836. [DOI] [PMC free article] [PubMed] [Google Scholar]
- Thomson AW, Turnquist HR., and, Raimondi G. Immunoregulatory functions of mTOR inhibition. Nat Rev Immunol. 2009;9:324–337. doi: 10.1038/nri2546. [DOI] [PMC free article] [PubMed] [Google Scholar]
- Chen J, Zheng XF, Brown EJ., and, Schreiber SL. Identification of an 11-kDa FKBP12-rapamycin-binding domain within the 289-kDa FKBP12-rapamycin-associated protein and characterization of a critical serine residue. Proc Natl Acad Sci USA. 1995;92:4947–4951. doi: 10.1073/pnas.92.11.4947. [DOI] [PMC free article] [PubMed] [Google Scholar]
- Crane C, Panner A, Pieper RO, Arbiser J., and, Parsa AT. Honokiol-mediated inhibition of PI3K/mTOR pathway: a potential strategy to overcome immunoresistance in glioma, breast, and prostate carcinoma without impacting T cell function. J Immunother. 2009;32:585–592. doi: 10.1097/CJI.0b013e3181a8efe6. [DOI] [PMC free article] [PubMed] [Google Scholar]
- Fox CJ, Hammerman PS., and, Thompson CB. The Pim kinases control rapamycin-resistant T cell survival and activation. J Exp Med. 2005;201:259–266. doi: 10.1084/jem.20042020. [DOI] [PMC free article] [PubMed] [Google Scholar]
- Dudley ME, Yang JC, Sherry R, Hughes MS, Royal R, Kammula U.et al. (2008Adoptive cell therapy for patients with metastatic melanoma: evaluation of intensive myeloablative chemoradiation preparative regimens J Clin Oncol 265233–5239. [DOI] [PMC free article] [PubMed] [Google Scholar]
- Wang Y, Camirand G, Lin Y, Froicu M, Deng S, Shlomchik WD.et al. (2011Regulatory T cells require mammalian target of rapamycin signaling to maintain both homeostasis and alloantigen-driven proliferation in lymphocyte-replete mice J Immunol 1862809–2818. [DOI] [PMC free article] [PubMed] [Google Scholar]
- Suhoski MM, Golovina TN, Aqui NA, Tai VC, Varela-Rohena A, Milone MC.et al. (2007Engineering artificial antigen-presenting cells to express a diverse array of co-stimulatory molecules Mol Ther 15981–988. [DOI] [PMC free article] [PubMed] [Google Scholar]
- Wilson MH, Coates CJ., and, George AL., Jr PiggyBac transposon-mediated gene transfer in human cells. Mol Ther. 2007;15:139–145. doi: 10.1038/sj.mt.6300028. [DOI] [PubMed] [Google Scholar]
Associated Data
This section collects any data citations, data availability statements, or supplementary materials included in this article.
Supplementary Materials
mTorRR-expressing T cells maintain mTor signaling in the presence of high concentrations of rapa.
mTorRR-expressing T cells return to the resting state in the absence of cytokine and serum.