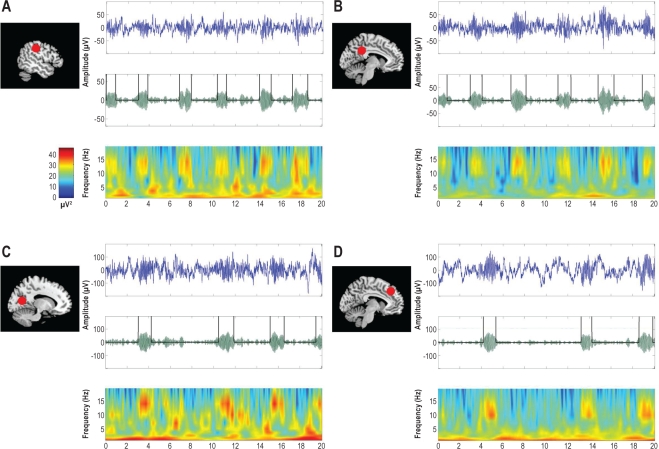
Figure 4.
Examples of spindles in selected sites. For each location from top to bottom: (1) Raw EEG trace (20 sec); (2) EEG trace filtered between 10 and 16 Hz for automatic detection; (3) Time-Frequency representation (with color scale for signal power (μV2). MRI sagittal slices on the left: red plots indicate the topography of the selected electrode. A = lateral parietal cortex (Patient 13); B = posterior cingulate gyrus (Patient 12); C = occipital cortex (Patient 4); D = middle medial frontal cortex (Patient 2).

