

Abstract
Musculoskeletal modeling requires information on muscle parameters such as cross-sectional area (CSA) and moment arms. A variety of previous studies have reported muscle parameters in the trunk based on in vivo imaging, but there remain gaps in the available data as well as limitations in the generalizability of such data. Specifically, available trunk muscle CSA data is very limited for older adults, lacking entirely in the thoracic region. In addition, previous studies have made measurements in groups of healthy volunteers or hospital patients who may not be representative of the population in general. Finally, such studies have not reported data for the major muscles connecting the upper limb to the thoracic trunk. In this study, muscle morphology measurements were made for major muscles present in the trunk between vertebral levels T6 and L5 using quantitative computed tomography scans from a community-based sample of 100 men and women aged 36–87. We present regression equations to predict trunk muscle CSA and position relative to the vertebral body in the transverse plane from sex, age, height and weight at vertebral levels T6 to L5. Regressions were also developed for predicting anatomical CSA and muscle moment arms, which were estimated using literature data on muscle line of action. This work thus provides a resource for estimating muscle parameters in the general population for musculoskeletal modeling of the thoraco-lumbar trunk.
Keywords: Trunk Musculature, Cross-sectional Area, Moment Arm Length, Biomechanical Modeling
1. Introduction
There is a need for greater study of the biomechanics of the thoracic spine. Pain in the thoracic spine is common in the general population (Briggs et al. 2009b), as well as in a wide range of occupational settings (Briggs et al. 2009a), but additional research is needed to better understand the factors underlying this pain. Moreover, vertebral fractures, which have a prevalence of 30–50% among adults over age 50 (Melton et al. 1989; Melton et al. 1993), most commonly occur in the mid-thoracic and thoraco-lumbar regions of the spine (Ismail et al. 1999; Van der Klift et al. 2002; Delmas et al. 2005; Freitas et al. 2008; Melton et al. 1993). Thus, musculoskeletal modeling of the spine may be useful for understanding thoracic spine pain and injury, but the majority of biomechanical models of the spine have focused on the lumbar spine. To address this gap, Iyer et al. (2010) have recently developed a model for estimating loads on the thoraco-lumbar vertebrae. However, the widespread use of such a model requires the availability of trunk muscle cross-sectional area (CSA) and moment arm data for various populations.
A number of prior studies report in vivo muscle morphology in the trunk based on CT (Chaffin et al. 1990; Kumar 1988; McGill et al. 1988; Moga et al. 1993; Németh and Ohlsén 1986) or MRI (Jorgensen et al. 2001; Marras et al. 2001; McGill et al. 1993; Reid et al. 1987; Seo et al. 2003; Tracy et al. 1989) scans. However, limitations in subject selection reduce their usefulness and generalizability. The subjects in prior studies of trunk muscle morphology fall into two general categories: healthy volunteers (Chaffin et al. 1990; Jorgensen et al. 2001; Marras et al. 2001; McGill et al. 1993; Reid et al. 1987; Seo et al. 2003) or patients who underwent a CT or MRI scan for diagnostic purposes (Kumar 1988; McGill et al. 1988; Moga et al. 1993; Németh and Ohlsén 1986; Tracy et al. 1989). Furthermore, many of these studies included only young or older subjects (Jorgensen et al. 2001; Marras et al. 2001; Németh and Ohlsén 1986; Reid et al. 1987; McGill et al. 1993), and/or included only men or women (Chaffin et al. 1990; McGill et al. 1988; Reid et al. 1987; Tracy et al. 1989; McGill et al. 1993). Thus, the data in previous studies may not be generalizable to wider populations. In addition, many studies focus on the lumbar musculature only (Chaffin et al. 1990; McGill et al. 1988; Németh and Ohlsén 1986; Reid et al. 1987; Seo et al. 2003; Tracy et al. 1989), and there is limited muscle morphology data available in the thoracic trunk. In particular, muscle CSA data is lacking in the thoracic region for older adults. Finally, such studies have not previously reported on the morphology of several major muscles connecting the upper limb to the thoracic trunk.
Our goal was to develop a means for estimating trunk muscle morphology for major muscles present between vertebral levels T6 and L5 that would be applicable to musculoskeletal modeling in a wide variety of individuals. To do so, we measured trunk muscle morphology in a community-based sample of men and women across a wide range of ages, and developed regression equations with trunk muscle morphology as dependent variables and age, sex, height and body mass as independent variables.
2. Methods
2.1. Subjects
We randomly selected an age- and sex stratified sample of 100 individuals (51 men, 49 women, Table 1) from 3529 individuals who underwent a quantitative computed tomography (QCT) exam as part of the Framingham Heart Study Offspring and Third Generation Multidetector CT Study (Hoffmann et al. 2008). Subjects were positioned supine with a cushion under the legs, resulting in slight flexion of the hips and knees, and with arms extended above the head, and scanning was performed using a Lightspeed Ultra scanner (General Electric, Milwaukee, WI). Scans included a chest scan which imaged approximately thoracic vertebral levels T7 – T11 and an abdominal scan which imaged approximately vertebral levels L2 – L5. Scans had a slice thickness of 2.5 cm and a nominal in-plane pixel size of 0.68×0.68 mm. This study was approved by the institutional review boards of Boston University and Beth Israel Deaconess Medical Center.
Table 1.
Demographic characteristics of subjects included in the study
| Men (n=51) | Women (n=49) | |||
|---|---|---|---|---|
| Mean (SD) | Range | Mean (SD) | Range | |
| Age (yrs) | 59.4 (14.6) | 36–82 | 58.1 (13.3) | 40–87 |
| Height (cm) | 177.6 (7.1) | 165.1–191.8 | 162.2 (5.8) | 150.5–174.0 |
| Body Mass (kg) | 86.3 (11.5) | 60.8–116.6 | 68.4 (13.6) | 48.1–117.7 |
2.2. Measurement of trunk muscle morphology
Measurements of muscle CSA and position relative to the vertebral body were made from the transverse QCT scan plane at mid-vertebral body for vertebral levels T6 through L5. Muscle morphology measurements were made for 11 muscles or muscle groups at different vertebral levels as noted in Table 2. Muscle boundaries at each vertebral level were manually traced using custom software, as was the vertebral body, and areas and centroid locations were determined. There were five trained readers who took part in muscle measurements, with a single measurement obtained for each muscle. The orientations of the anterior-posterior (AP) and medial-lateral (ML) axes in the scan plane were defined using the average angle formed in the scan plane by left and right side muscle pairs. Muscle position was calculated as the difference between muscle and vertebral body centroid locations in the ML direction (ML-d) and in the AP direction (AP-d) as shown in Fig. 1. Muscles on the lateral and anterior aspects of the trunk, that is pectoralis major, rectus abdominis, serratus anterior, latissimus dorsi, external oblique and internal oblique, would sometimes be partially or fully outside of the QCT image field of view (Fig. 1). In these cases, the muscle in question was not measured.
Table 2.
Trunk muscles measured from QCT scans at each vertebral level
| T6 | T7 | T8 | T9 | T10 | T11 | T12 | L1 | L2 | L3 | L4 | L5 | |
|---|---|---|---|---|---|---|---|---|---|---|---|---|
| Pectoralis Major | X | X | X | X | ||||||||
| Rectus Abdominis | X | X | X | X | X | X | X | X | ||||
| Serratus Anterior | X | X | X | X | X | X | ||||||
| Trapezius | X | X | X | X | X | X | ||||||
| Latissimus Dorsi | X | X | X | X | X | X | X | X | X | X | ||
| External Oblique | X | X | X | X | X | X | X | X | ||||
| Internal Oblique | X | X | X | X | ||||||||
| Psoas Major | X | X | X | X | X | |||||||
| Erector Spinae | X | X | X | X | X | X | X | X | X | X | X | X |
| Transversospinalis | X | X | X | X | X | X | X | X | X | X | X | X |
| Quadratus Lumborum | X | X | X | X |
Fig. 1.
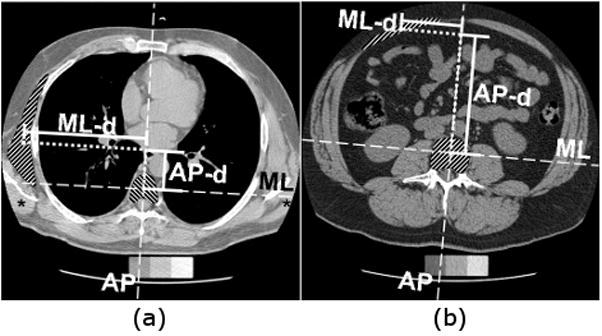
Measurement of muscle position in transverse plane scans. Position was calculated as the difference between centroid locations of muscle and vertebral body in the ML direction (ML-d) and in the AP direction (AP-d), shown here for (a) the left serratus anterior muscle at the T7 vertebral level, and (b) the left rectus abdominis muscle at the L3 vertebral level. Asterisks (*) denote examples of a muscle (latissimus dorsi) that extends outside the QCT image field of view, and thus was not measured.
Measurements of muscle CSA and position in the QCT transverse scan plane may not be directly applicable to musculoskeletal modeling, as the line of action of many muscles is not perpendicular to the transverse plane. In order to provide data that may be more directly applicable to musculoskeletal modeling, literature estimates of muscle lines of action were used to estimate anatomical cross-sectional area (ACSA) from measured muscle CSA, muscle moment arm about the AP axis (MA-X) from measured ML-d distance, and muscle moment arm about the ML axis (MA-Y) from measured AP-d distance. Lines of action for pectoralis major, serratus anterior and trapezius were estimated from the muscle paths in the upper limb model of Garner and Pandy (Garner and Pandy 1999, 2001) based on the Visible Human Project. Lines of action for all other muscles were taken from several literature sources (Dumas et al. 1991; Macintosh and Bogduk 1986; Macintosh and Bogduk 1991; Santaguida 1991) as compiled by McGill et al (1993). ACSA, MA-X and MA-Y were estimated from the scan plane measurements as:
| (Equation 1a) |
| (Equation 1b) |
| (Equation 1c) |
where θ was the angle between the normal to the scan plane and the estimated muscle line of action.
2.3. Regressions
Linear regression analysis was used to determine regression coefficients to predict muscle CSA, muscle position (ML-d and AP-d), ACSA and moment arms (MA-X and MA-Y) from age, sex, height and body mass at each vertebral level. Previous studies reporting regression equations for muscle parameters have used a wide variety of anthropometric measures as independent variables (Chaffin et al. 1990; Jorgensen et al. 2001; Marras et al. 2001; Moga et al. 1993; Reid et al. 1987; Seo et al. 2003; Tracy et al. 1989), and it is not clear which would be most generally predictive of muscle parameters. Height (Chaffin et al. 1990; Jorgensen et al. 2001; Moga et al. 1993) and body mass (Chaffin et al. 1990; Jorgensen et al. 2001; Marras et al. 2001; Moga et al. 1993; Reid et al. 1987; Seo et al. 2003; Tracy et al. 1989) have been used previously in regressions of muscle parameters, and furthermore are commonly measured even when more specific anthropometric data are not. Thus, height and body mass were chosen as relevant measures of body size that would be widely available for specific individuals. Left and right side muscle morphology measurements were averaged within each subject, giving a single measurement per subject for each muscle and level. If only one side was present, it alone was used as the measurement. All four independent variables (age, sex, height and body mass) were included in the model, regardless of statistical significance. Thus, the regression equation is:
| (Equation 2) |
where C’s are regression coefficients, Sex is sex (male = 0, female = 1), Age is age in years, Height is height in cm and Mass is body mass in kg. Muscle Parameter is CSA (cm2), ML-d (cm), AP-d (cm), ACSA (cm2), MA-X (cm) or MA-Y (cm). Values returned for ML-d and MA-X are always positive, indicating the absolute ML distance or moment arm for either a left- or right-side muscle. Values for AP-d and MA-Y may be positive or negative, with positive values indicating a muscle anterior to the vertebral body centroid and negative values indicating a muscle posterior to the vertebral body centroid. To provide a measure of the fit and error associated with the regressions, coefficient of determination (R2) and standard error of the estimate (SEE) are reported for each regression. Regressions were calculated using JMP (SAS Institute, Inc., Cary, NC).
Because of the CT scanning protocol used, the sample contained only 18, 11, and 3 individuals in whom the scans extended to levels T6, T12 and L1, respectively. Thus, because of the limited sample, data from these levels was not used to create regressions. Rather, mean muscle morphology measurements at T6, T12 and L1 were estimated from the means at other levels using piecewise cubic Hermite interpolation in Matlab (The MathWorks Inc., Natick, MA). By assuming a constant ratio between muscle parameters at adjacent levels, a regression equation for one of these levels may be created by scaling the regression equation from an adjacent level. For example, a T6 regression equation was determined from a T7 regression equation as:
| (Equation 3) |
Regression equations for T12 and L1 were determined from equations at T11 and L2, respectively, in the same way. As the regression equations are linear, each regression coefficient is individually scaled by the ratio of the means.
3. Results
Mean muscle CSA, ML-d and AP-d varied with vertebral level (Fig. 2), as did ACSA, MA-X and MA-Y (Fig. 3). Values for means and standard deviations of CSA, ML-d, AP-d, ACSA, MA-X and MA-Y may be found in the online supplemental data. In addition, the supplemental data provides means for men and women separately, and gives the number of subjects measured by muscle and level. Because not all levels were available in all subjects and muscles could sometimes not be measured in levels that were present (e.g. extending outside the image field of view), the number of subjects used for any particular regression ranged from 26 to 99. Excluding the estimates at levels T6, T12 and L1, the regressions based on the fewest subjects were those for the trapezius at T11, with 26 subjects. The regressions based on the most subjects were those for psoas major, erector spinae and transversospinalis at L4, with 99 subjects. The median number of subjects used to create regressions was 82, and so most regressions reported here were based on more than 80 subjects.
Fig. 2.

Mean values of measured (a) muscle CSAs in the transverse plane, (b) position in the medial-lateral direction (ML-d), and (c) position in the anterior-posterior direction (AP-d), for vertebral levels T6 through L5. Note that for AP-d, positive indicates anterior to, and negative indicates posterior to, the center of the vertebral body. Values for shaded levels (T6, T12, L1) were estimated by interpolation or extrapolation.
Fig. 3.

Mean values of estimated (a) muscle ACSAs, (b) moment arm in the medial-lateral direction (MA-X), and (c) moment arm in the anterior-posterior direction (MA-Y), for vertebral levels T6 through L5. Note that for MA-Y, positive indicates anterior to, and negative indicates posterior to, the center of the vertebral body. Values for shaded levels (T6, T12, L1) were estimated by interpolation or extrapolation.
Regression coefficients for estimating muscle CSA and position in the transverse plane are presented in Table 3, and coefficients for estimating muscle ACSA and moment arms are presented in Table 4. The coefficients of determination for muscle CSA varied from R2 = 0.04 to R2 = 0.73, with 20% of regressions having R2 < 0.25, 44% having an R2 between 0.25 and 0.50, and 36% having an R2 >0.50. The SEE for muscle CSA varied from 0.46 cm2 to 3.19 cm2 in absolute terms, and from 15.8% to 57.4% in terms of mean CSA values. The coefficients of determination for ML-d varied from R2 = 0.08 to R2 = 0.76, with 30% of regressions having R2 < 0.25, 33% having an R2 between 0.25 and 0.50, and 38% having an R2 >0.50. The SEE for ML-d varied from 0.14 cm to 1.49 cm in absolute terms, and from 5% to 36% in terms of mean ML-d value. The coefficients of determination for AP-d varied from R2 = 0.02 to R2 = 0.68, with 33% of regressions having R2 < 0.25, 36% having an R2 between 0.25 and 0.50, and 31% having an R2 >0.50. The SEE for AP-d varied from 0.22 cm to 1.98 cm in absolute terms, and from 5% to 51% of mean AP-d values (excluding latissimus dorsi and psoas major in which moment arm passes from anterior to posterior, resulting in small mean moment arms). As ACSA, MA-X and MA-Y are scaled values of the measured CSA, ML-d and AP-d, respectively, the R2 values of their regressions were identical to those of the corresponding measurements and their SEE values were scaled versions of the corresponding SEE values.
Table 3.
Regression coefficients for estimating muscle CSA and position in the transverse plane using Equation 2. Coefficients in bold are significant (p < 0.05), and R2 values in bold indicate significant regressions (p < 0.05). The regression coefficients for shaded levels (T6, T12, L1) were estimated by scaling the coefficients from the adjacent level. SEE = standard error of the estimate.
| CSA | ML-d | AP-d | |||||||||||||||||||
|---|---|---|---|---|---|---|---|---|---|---|---|---|---|---|---|---|---|---|---|---|---|
| CI | CS | CA | CH | CM | SEE (cm2) | R2 | CI | CS | CA | CH | CM | SEE (cm) | R2 | CI | CS | CA | CH | CM | SEE (cm) | R2 | |
| Pectoralis Major | |||||||||||||||||||||
| T6 | 18.98 | −4.97 | −7.10E-2 | −2.00E-2 | −3.66E-3 | - | - | 2.67 | 0.22 | 6.52E-3 | 1.40E-2 | 7.73E-3 | - | - | 7.31 | −1.72 | 3.56E-2 | 9.75E-3 | 5.67E-2 | - | - |
| T7 | 12.85 | −3.36 | −4.80E-2 | −1.35E-2 | −2.48E-3 | 1.94 | 0.43 | 2.75 | 0.23 | 6.74E-3 | 1.44E-2 | 7.98E-3 | 0.66 | 0.08 | 7.47 | −1.75 | 3.64E-2 | 9.95E-3 | 5.79E-2 | 1.36 | 0.62 |
| T8 | −2.65 | −1.09 | −7.52E-3 | 5.20E-2 | −1.71E-2 | 1.34 | 0.29 | 0.64 | −3.10E-2 | 1.79E-2 | 1.72E-2 | 2.50E-2 | 1.05 | 0.23 | 5.30 | −1.24 | 3.31E-2 | 2.32E-2 | 5.98E-2 | 1.52 | 0.54 |
| T9 | 7.31 | −1.29 | −6.90E-3 | −2.71E-2 | 1.72E-2 | 1.10 | 0.25 | 2.12 | −1.00 | 8.35E-3 | 2.51E-2 | 2.45E-3 | 1.34 | 0.23 | 11.05 | −1.42 | 2.64E-2 | −7.59E-3 | 6.02E-2 | 1.46 | 0.49 |
| Rectus Abdominis | |||||||||||||||||||||
| T10 | 14.23 | −2.16 | −2.23E-2 | −7.90E-2 | 6.98E-2 | 1.87 | 0.33 | −2.08 | −0.30 | 6.82E-3 | 4.17E-2 | −3.14E-4 | 1.26 | 0.14 | 14.04 | −1.55 | 1.73E-2 | −3.74E-2 | 9.81E-2 | 1.38 | 0.59 |
| T11 | 8.42 | −1.76 | −7.40E-3 | −4.14E-2 | 7.53E-2 | 2.13 | 0.28 | 6.42 | −0.71 | −6.00E-3 | −1.99E-2 | 3.24E-2 | 0.82 | 0.30 | 19.56 | −1.50 | 4.55E-3 | −8.04E-2 | 1.32E-1 | 1.42 | 0.58 |
| T12 | 8.38 | −1.75 | −7.37E-3 | −4.12E-2 | 7.49E-2 | - | - | 6.52 | −0.72 | −6.10E-3 | −2.02E-2 | 3.29E-2 | - | - | 18.49 | −1.42 | 4.30E-3 | −7.60E-2 | 1.25E-1 | - | - |
| L1 | 0.51 | −1.81 | −7.97E-3 | 2.00E-2 | 4.06E-2 | - | - | −1.68 | −0.23 | 1.47E-2 | 2.41E-2 | 2.34E-2 | - | - | 10.91 | −1.57 | −6.19E-3 | −2.27E-2 | 9.78E-2 | - | - |
| L2 | 0.50 | −1.80 | −7.94E-3 | 1.99E-2 | 4.04E-2 | 1.37 | 0.52 | −1.70 | −0.23 | 1.50E-2 | 2.45E-2 | 2.38E-2 | 0.61 | 0.51 | 9.96 | −1.43 | −5.65E-3 | −2.07E-2 | 8.92E-2 | 1.72 | 0.44 |
| L3 | 6.37 | −2.12 | −4.15E-2 | −4.52E-3 | 5.16E-2 | 1.40 | 0.58 | 1.50 | 1.02E-2 | 5.46E-3 | 2.50E-3 | 3.35E-2 | 0.62 | 0.37 | 6.41 | −1.47 | 2.40E-2 | −3.09E-2 | 1.20E-1 | 1.61 | 0.59 |
| L4 | 1.97 | −1.48 | −2.38E-2 | 1.27E-2 | 4.88E-2 | 1.34 | 0.55 | −1.15 | 0.25 | 1.33E-2 | 1.13E-2 | 4.13E-2 | 0.69 | 0.47 | 4.80 | −1.37 | 4.29E-2 | −2.92E-2 | 1.13E-1 | 1.52 | 0.64 |
| L5 | 0.05 | −1.46 | −3.70E-2 | 2.45E-2 | 6.87E-2 | 1.41 | 0.65 | −1.41 | 0.44 | 1.62E-2 | 1.13E-2 | 3.49E-2 | 0.71 | 0.36 | 6.24 | −1.45 | 4.77E-2 | −2.96E-2 | 9.34E-2 | 1.49 | 0.62 |
| Serratus Anterior | |||||||||||||||||||||
| T6 | 12.57 | −3.98 | −4.79E-2 | −5.94E-2 | 1.50E-1 | - | - | 6.42 | −0.51 | −5.52E-3 | 3.24E-2 | 2.69E-2 | - | - | 2.75 | −0.83 | 1.81E-2 | −5.35E-3 | 3.46E-2 | - | - |
| T7 | 13.67 | −4.33 | −5.21E-2 | −6.47E-2 | 1.63E-1 | 2.37 | 0.70 | 6.47 | −0.52 | −5.57E-3 | 3.26E-2 | 2.71E-2 | 0.62 | 0.67 | 3.07 | −0.92 | 2.01E-2 | −5.96E-3 | 3.85E-2 | 1.16 | 0.39 |
| T8 | 19.95 | −4.32 | −4.00E-2 | −8.86E-2 | 1.43E-1 | 2.65 | 0.58 | 8.35 | −0.88 | −8.93E-3 | 2.61E-2 | 2.53E-2 | 0.64 | 0.68 | 8.97 | −1.29 | 1.68E-2 | −4.05E-2 | 4.53E-2 | 1.26 | 0.37 |
| T9 | 16.56 | −4.51 | −5.13E-2 | −3.79E-2 | 8.71E-2 | 2.79 | 0.62 | 7.71 | −0.93 | −9.40E-3 | 3.05E-2 | 2.71E-2 | 0.64 | 0.71 | 11.33 | −1.22 | 2.80E-2 | −5.78E-2 | 3.77E-2 | 1.39 | 0.26 |
| T10 | −10.79 | −1.67 | 5.99E-3 | 1.05E-1 | 2.64E-2 | 2.92 | 0.31 | 9.28 | −0.97 | −8.52E-3 | 1.96E-2 | 3.41E-2 | 0.71 | 0.66 | 15.28 | −0.68 | 9.99E-3 | −9.28E-2 | 7.19E-2 | 1.54 | 0.25 |
| T11 | −11.29 | 0.18 | 6.01E-3 | 9.07E-2 | 8.47E-4 | 2.36 | 0.11 | 7.28 | −1.24 | 6.19E-3 | 3.11E-2 | 2.54E-2 | 0.67 | 0.75 | 20.70 | −0.62 | 6.32E-3 | −1.45E-1 | 1.32E-1 | 1.98 | 0.28 |
| Trapezius | |||||||||||||||||||||
| T6 | 13.51 | −2.48 | −5.99E-2 | −4.42E-2 | 5.84E-2 | - | - | 6.66 | −0.70 | −1.15E-2 | −1.23E-2 | 1.19E-2 | - | - | −2.71 | 0.20 | 9.86E-3 | −1.19E-2 | −1.75E-2 | - | - |
| T7 | 9.87 | −1.81 | −4.37E-2 | −3.23E-2 | 4.26E-2 | 1.55 | 0.40 | 5.45 | −0.57 | −9.44E-3 | −1.01E-2 | 9.73E-3 | 0.85 | 0.13 | −2.66 | 0.19 | 9.70E-3 | −1.17E-2 | −1.72E-2 | 0.31 | 0.68 |
| T8 | 6.63 | −1.19 | −2.72E-2 | −1.98E-2 | 2.55E-2 | 1.02 | 0.38 | 6.50 | −0.60 | −5.20E-3 | -2.03E-2 | 7.69E-3 | 0.73 | 0.10 | −3.55 | 0.30 | 8.96E-3 | −8.18E-3 | −1.53E-2 | 0.35 | 0.60 |
| T9 | 6.45 | −0.84 | −1.29E-2 | −2.89E-2 | 2.08E-2 | 0.91 | 0.22 | 4.11 | −0.42 | −1.59E-3 | −1.04E-2 | 6.49E-3 | 0.68 | 0.08 | −3.37 | 0.36 | 9.71E-3 | −1.11E-2 | −1.47E-2 | 0.36 | 0.65 |
| T10 | 3.33 | −0.49 | −6.16E-3 | −1.56E-2 | 1.54E-2 | 0.74 | 0.16 | 7.24 | −0.72 | −1.70E-3 | −3.09E-2 | 1.27E-2 | 0.92 | 0.09 | −1.81 | 0.20 | 4.50E-3 | −1.95E-2 | −1.35E-2 | 0.42 | 0.53 |
| T11 | −3.42 | 0.29 | 4.01E-3 | 1.87E-2 | 1.13E-2 | 0.49 | 0.20 | 1.83 | −0.56 | 4.27E-2 | −9.24E-3 | 2.95E-4 | 0.93 | 0.33 | 0.90 | 0.27 | −8.88E-3 | −4.44E-2 | 1.47E-2 | 0.58 | 0.34 |
| Latissimus Dorsi | |||||||||||||||||||||
| T6 | 5.17 | −1.06 | −1.67E-2 | −1.27E-2 | 5.56E-2 | - | - | 4.84 | 0.15 | −1.82E-2 | 7.31E-2 | 5.76E-3 | - | - | −9.64 | 1.76 | 4.02E-2 | 7.31E-2 | −4.84E-2 | - | - |
| T7 | 7.65 | −1.57 | −2.48E-2 | −1.88E-2 | 8.23E-2 | 2.55 | 0.34 | 4.31 | 0.13 | −1.62E-2 | 6.52E-2 | 5.14E-3 | 1.13 | 0.27 | −5.04 | 0.92 | 2.11E-2 | 3.83E-2 | −2.53E-2 | 1.48 | 0.10 |
| T8 | −1.18 | −2.88 | −4.82E-2 | 7.59E-2 | 4.41E-2 | 1.95 | 0.59 | 10.18 | −1.04 | -1.34E-2 | 1.91E-2 | 1.99E-2 | 0.85 | 0.47 | 1.92 | −0.54 | 1.22E-2 | −1.51E-2 | 7.21E-3 | 1.13 | 0.07 |
| T9 | 13.36 | −4.28 | −3.28E-2 | −2.39E-2 | 6.45E-2 | 2.00 | 0.61 | 8.11 | −0.91 | −7.94E-3 | 2.61E-2 | 1.47E-2 | 0.68 | 0.57 | 0.39 | −0.10 | 1.38E-2 | −8.04E-3 | −4.96E-3 | 0.93 | 0.05 |
| T10 | −3.34 | −2.06 | −5.66E-3 | 4.26E-2 | 8.34E-2 | 1.55 | 0.68 | 11.61 | −0.88 | −2.41E-2 | -2.39E-4 | 3.20E-2 | 0.69 | 0.56 | 3.03 | 2.25E-2 | −2.80E-3 | −2.69E-2 | 3.76E-3 | 0.91 | 0.06 |
| T11 | −4.30 | −1.60 | 3.36E-3 | 4.18E-2 | 7.50E-2 | 1.24 | 0.72 | 8.82 | −0.93 | −1.23E-2 | 1.69E-2 | 1.40E-2 | 0.68 | 0.55 | 9.67 | −0.18 | −1.20E-2 | −7.58E-2 | 2.68E-2 | 0.97 | 0.18 |
| T12 | −3.51 | −1.31 | 2.75E-3 | 3.42E-2 | 6.13E-2 | - | - | 8.42 | −0.89 | −1.17E-2 | 1.61E-2 | 1.34E-2 | - | - | 13.51 | −0.25 | −1.67E-2 | −1.06E-1 | 3.74E-2 | - | - |
| L1 | 8.95 | −1.56 | −8.04E-3 | −3.47E-2 | 3.87E-2 | - | - | −4.18 | −0.10 | 5.58E-3 | 7.63E-2 | 2.22E-2 | - | - | −3.00 | 0.39 | −1.40E-2 | −1.68E-3 | 3.24E-3 | - | - |
| L2 | 6.25 | −1.09 | −5.61E-3 | −2.42E-2 | 2.70E-2 | 1.32 | 0.19 | −4.10 | −0.10 | 5.48E-3 | 7.49E-2 | 2.18E-2 | 0.86 | 0.57 | −3.30 | 0.43 | −1.54E-2 | −1.85E-3 | 3.57E-3 | 0.94 | 0.10 |
| L3 | 3.54 | −0.52 | 1.67E-2 | −1.94E-2 | 1.47E-2 | 1.20 | 0.10 | 8.28 | −0.34 | 1.02E-2 | −6.60E-3 | 3.80E-2 | 0.90 | 0.36 | 4.67 | 7.49E-2 | −1.56E-2 | −5.05E-2 | 1.05E-2 | 0.94 | 0.18 |
| External Oblique | |||||||||||||||||||||
| T10 | 0.41 | −0.33 | −3.07E-3 | −2.27E-3 | 2.20E-2 | 0.70 | 0.26 | 2.53 | −1.12 | −1.18E-2 | 5.12E-2 | 1.31E-2 | 1.49 | 0.35 | 16.94 | −1.65 | 1.10E-2 | −6.57E-2 | 9.41E-2 | 1.71 | 0.46 |
| T11 | 10.15 | −1.03 | −1.43E-2 | −4.53E-2 | 9.55E-3 | 0.65 | 0.25 | 14.44 | −1.64 | −1.52E-2 | −2.82E-2 | 4.79E-2 | 1.39 | 0.41 | 11.45 | −0.73 | 2.78E-2 | −5.18E-2 | 1.12E-1 | 1.49 | 0.55 |
| T12 | 18.66 | −1.89 | −2.62E-2 | −8.33E-2 | 1.76E-2 | - | - | 15.26 | −1.73 | −1.60E-2 | −2.98E-2 | 5.06E-2 | - | - | 9.49 | −0.61 | 2.30E-2 | −4.30E-2 | 9.28E-2 | - | - |
| L1 | 3.06 | −1.68 | −1.05E-2 | −2.91E-3 | 6.37E-2 | - | - | 5.26 | −0.80 | 9.67E-3 | 2.17E-2 | 5.19E-2 | - | - | 4.27 | −0.34 | 1.09E-2 | 1.97E-2 | −1.63E-2 | - | - |
| L2 | 4.08 | −2.23 | −1.40E-2 | −3.88E-3 | 8.49E-2 | 1.79 | 0.53 | 5.42 | −0.82 | 9.96E-3 | 2.23E-2 | 5.35E-2 | 0.71 | 0.72 | 2.65 | −0.21 | 6.75E-3 | 1.23E-2 | −1.01E-2 | 1.56 | 0.02 |
| L3 | 1.50 | −2.47 | −2.02E-2 | 2.22E-2 | 7.50E-2 | 1.57 | 0.64 | 5.86 | −0.38 | 2.03E-2 | 5.35E-3 | 7.21E-2 | 0.70 | 0.72 | 3.72 | −0.44 | 4.87E-3 | −1.98E-2 | 3.08E-2 | 1.36 | 0.09 |
| L4 | −2.51 | −2.14 | 1.24E-3 | 3.96E-2 | 7.36E-2 | 1.80 | 0.60 | 3.71 | −0.12 | 2.65E-2 | 1.92E-2 | 6.32E-2 | 0.63 | 0.75 | 4.55 | −0.79 | −9.74E-3 | −1.17E-2 | 1.32E-2 | 0.90 | 0.20 |
| L5 | 0.97 | −0.49 | 2.18E-2 | −8.81E-3 | 5.79E-2 | 1.99 | 0.20 | 0.50 | 0.56 | 3.03E-2 | 3.88E-2 | 4.99E-2 | 0.96 | 0.47 | 5.52 | −1.21 | −2.18E-3 | 1.28E-3 | 1.44E-3 | 1.38 | 0.17 |
| Internal Oblique | |||||||||||||||||||||
| L2 | −8.02 | −2.21 | 6.92E-2 | 4.20E-2 | 4.57E-2 | 2.65 | 0.36 | 5.17 | −1.13 | 5.22E-3 | 1.97E-2 | 5.58E-2 | 0.78 | 0.76 | 10.68 | −6.82E-2 | 1.23E-2 | −4.13E-2 | 1.99E-2 | 1.84 | 0.04 |
| L3 | 30.64 | −5.41 | −5.99E-2 | −1.29E-1 | 7.88E-2 | 2.21 | 0.59 | 1.87 | −3.03E-2 | 2.00E-2 | 2.64E-2 | 6.32E-2 | 0.86 | 0.60 | −5.07 | 0.17 | 2.04E-2 | 2.33E-2 | 4.21E-2 | 1.47 | 0.18 |
| L4 | −2.80 | −2.85 | 2.30E-2 | 3.49E-2 | 7.89E-2 | 1.99 | 0.63 | 0.27 | 0.33 | 3.35E-2 | 3.10E-2 | 6.02E-2 | 0.81 | 0.64 | 2.70 | −0.76 | −8.19E-3 | −5.22E-3 | 3.60E-2 | 1.04 | 0.36 |
| L5 | 0.47 | −0.77 | 1.54E-2 | −1.26E-2 | 9.14E-2 | 2.08 | 0.36 | −0.45 | 0.78 | 3.48E-2 | 4.02E-2 | 3.77E-2 | 1.01 | 0.35 | 2.88 | −1.24 | 4.56E-3 | 1.03E-2 | 2.22E-2 | 1.21 | 0.38 |
| Psoas Major | |||||||||||||||||||||
| L1 | −1.12 | −0.79 | −1.43E-2 | 2.44E-2 | 5.91E-3 | - | - | −0.30 | −0.23 | 1.76E-3 | 1.51E-2 | 4.65E-3 | - | - | 1.87E-2 | −0.21 | −1.55E-3 | −1.34E-3 | −2.61E-3 | - | - |
| L2 | −2.96 | −2.07 | −3.75E-2 | 6.43E-2 | 1.56E-2 | 1.85 | 0.48 | −0.37 | −0.28 | 2.19E-3 | 1.88E-2 | 5.80E-3 | 0.28 | 0.61 | 2.43E-2 | −0.27 | −2.01E-3 | −1.74E-3 | −3.39E-3 | 0.28 | 0.14 |
| L3 | 12.14 | −4.02 | −7.63E-2 | −2.73E-3 | 4.90E-2 | 2.34 | 0.57 | 1.24 | −0.29 | −1.75E-4 | 1.20E-2 | 8.25E-3 | 0.24 | 0.68 | 1.60 | −0.42 | −6.04E-3 | −1.13E-2 | 2.60E-3 | 0.31 | 0.23 |
| L4 | 14.25 | −5.63 | −8.44E-2 | 1.95E-3 | 7.57E-2 | 2.32 | 0.73 | 0.82 | −0.20 | 9.13E-4 | 1.77E-2 | 7.00E-3 | 0.23 | 0.69 | 1.09 | −0.38 | −3.51E-4 | −8.97E-3 | 6.84E-3 | 0.46 | 0.16 |
| L5 | 8.97 | −4.85 | −4.76E-2 | 3.05E-2 | 4.55E-2 | 2.00 | 0.73 | 0.41 | 2.49E-2 | 6.86E-3 | 2.07E-2 | 7.66E-3 | 0.51 | 0.26 | 0.73 | −0.41 | 1.49E-3 | 1.92E-3 | 1.35E-3 | 0.66 | 0.12 |
| Erector Spinae | |||||||||||||||||||||
| T6 | 3.48 | −1.02 | −2.90E-2 | 4.94E-3 | 2.31E-2 | - | - | 2.71 | −0.59 | 5.45E-3 | 7.76E-3 | −2.08E-3 | - | - | −1.98 | 7.75E-2 | 5.80E-3 | −1.20E-2 | −1.11E-2 | - | - |
| T7 | 3.60 | −1.05 | −3.00E-2 | 5.11E-3 | 2.39E-2 | 1.16 | 0.40 | 2.74 | −0.60 | 5.52E-3 | 7.86E-3 | −2.10E-3 | 0.56 | 0.28 | −1.93 | 7.55E-2 | 5.66E-3 | −1.17E-2 | −1.09E-2 | 0.31 | 0.49 |
| T8 | 3.70 | −1.14 | −3.40E-2 | 1.02E-2 | 2.09E-2 | 1.16 | 0.42 | 0.89 | −0.41 | 2.32E-3 | 1.80E-2 | 1.22E-3 | 0.54 | 0.32 | −1.49 | 0.13 | 4.49E-3 | −1.60E-2 | −8.40E-3 | 0.35 | 0.46 |
| T9 | 6.36 | −1.46 | −4.31E-2 | 2.72E-3 | 1.83E-2 | 1.16 | 0.48 | 2.50 | −0.52 | 2.92E-3 | 6.34E-3 | 6.94E-3 | 0.49 | 0.40 | −1.58 | 0.21 | 5.67E-3 | −1.78E-2 | −7.30E-3 | 0.32 | 0.57 |
| T10 | 1.22 | −1.07 | −5.15E-2 | 3.27E-2 | 4.28E-2 | 1.50 | 0.49 | 2.47 | −0.50 | −1.17E-3 | 7.35E-3 | 8.85E-3 | 0.43 | 0.48 | −1.11 | 0.16 | 1.72E-3 | −2.03E-2 | −6.66E-3 | 0.37 | 0.46 |
| T11 | −3.10 | −0.90 | −5.88E-2 | 9.80E-2 | −1.05E-2 | 1.60 | 0.48 | 5.11 | −0.50 | −3.70E-3 | −1.22E-2 | 2.16E-2 | 0.42 | 0.51 | 1.40 | 0.17 | −3.14E-3 | −3.84E-2 | 3.45E-3 | 0.44 | 0.47 |
| T12 | −4.13 | −1.20 | −7.83E-2 | 1.31E-1 | −1.40E-2 | - | - | 5.16 | −0.50 | −3.73E-3 | −1.23E-2 | 2.18E-2 | - | - | 1.45 | 0.18 | −3.25E-3 | −3.96E-2 | 3.56E-3 | - | - |
| L1 | −0.29 | −2.28 | −3.78E-2 | 7.50E-2 | 8.15E-2 | - | - | −0.27 | −0.19 | 2.65E-4 | 2.38E-2 | 8.17E-3 | - | - | −1.59 | 0.13 | −9.95E-3 | −1.74E-2 | −4.70E-3 | - | - |
| L2 | −0.33 | −2.52 | −4.17E-2 | 8.28E-2 | 8.99E-2 | 2.53 | 0.57 | −0.27 | −0.19 | 2.68E-4 | 2.41E-2 | 8.27E-3 | 0.25 | 0.70 | −1.66 | 0.14 | −1.04E-2 | −1.82E-2 | −4.92E-3 | 0.41 | 0.37 |
| L3 | 2.52 | −3.02 | −4.39E-2 | 4.80E-2 | 1.24E-1 | 3.19 | 0.55 | 1.30 | −8.15E-2 | 2.08E-3 | 1.40E-2 | 9.03E-3 | 0.25 | 0.57 | −0.87 | 9.12E-2 | −4.78E-3 | −2.57E-2 | −4.92E-3 | 0.40 | 0.44 |
| L4 | 4.97 | −1.19 | −2.34E-2 | 1.96E-2 | 8.08E-2 | 2.82 | 0.30 | 2.38 | 0.10 | 2.83E-3 | 9.28E-3 | 6.75E-3 | 0.30 | 0.21 | −1.21 | 9.22E-2 | −2.33E-3 | −2.24E-2 | −3.32E-3 | 0.44 | 0.32 |
| L5 | 8.54 | 0.37 | 9.53E-3 | −4.37E-2 | 3.66E-2 | 2.55 | 0.04 | 2.40 | 0.47 | 6.98E-3 | 6.51E-3 | 3.96E-3 | 0.41 | 0.16 | 0.33 | −0.16 | −5.75E-3 | −2.77E-2 | −4.32E-3 | 0.47 | 0.26 |
| Transversospinalis | |||||||||||||||||||||
| T6 | 0.59 | −0.48 | −2.02E-2 | 1.74E-2 | 4.97E-3 | - | - | 6.77E-2 | −0.10 | 3.15E-3 | 6.89E-3 | −1.21E-4 | - | - | −1.46 | 0.10 | 8.56E-4 | −1.32E-2 | −5.16E-3 | - | - |
| T7 | 0.52 | −0.43 | −1.79E-2 | 1.55E-2 | 4.41E-3 | 0.55 | 0.43 | 6.04E-2 | −8.94E-2 | 2.81E-3 | 6.15E-3 | −1.08E-4 | 0.18 | 0.24 | −1.47 | 0.10 | 8.63E-4 | −1.33E-2 | −5.21E-3 | 0.23 | 0.54 |
| T8 | 1.82 | −0.52 | −2.18E-2 | 1.16E-2 | −2.21E-3 | 0.51 | 0.44 | 0.42 | −7.92E-2 | −1.33E-3 | 5.05E-3 | −7.70E-4 | 0.16 | 0.21 | −1.40 | 0.13 | 1.56E-3 | −1.52E-2 | −4.21E-3 | 0.22 | 0.58 |
| T9 | 1.19 | −0.32 | −1.42E-2 | 9.50E-3 | 4.31E-3 | 0.63 | 0.24 | 0.66 | −4.05E-2 | −6.21E-4 | 1.80E-3 | 2.27E-3 | 0.16 | 0.15 | −1.12 | 0.15 | 1.93E-3 | −1.86E-2 | −2.98E-3 | 0.23 | 0.61 |
| T10 | 1.00 | −0.46 | −1.36E-2 | 1.02E-2 | 8.07E-3 | 0.62 | 0.33 | 0.86 | −8.84E-2 | 2.26E-4 | 5.38E-4 | 1.75E-3 | 0.14 | 0.21 | −0.36 | 0.11 | −2.13E-3 | −2.27E-2 | −1.36E-3 | 0.27 | 0.51 |
| T11 | −1.01 | −0.50 | −3.36E-3 | 1.81E-2 | 1.05E-2 | 0.63 | 0.42 | 1.85 | −0.23 | 1.07E-3 | −6.21E-3 | 4.83E-3 | 0.16 | 0.40 | 0.35 | 0.11 | −1.32E-3 | −2.87E-2 | 1.46E-3 | 0.31 | 0.51 |
| T12 | −1.07 | −0.52 | −3.54E-3 | 1.91E-2 | 1.11E-2 | - | - | 1.90 | −0.24 | 1.10E-3 | −6.40E-3 | 4.97E-3 | - | - | 0.36 | 0.11 | −1.36E-3 | −2.95E-2 | 1.50E-3 | - | - |
| L1 | −4.46 | −0.73 | −9.67E-3 | 5.17E-2 | −5.02E-3 | - | - | −0.59 | −1.48E-2 | 2.90E-3 | 8.49E-3 | 2.34E-3 | - | - | 0.70 | 3.11E-3 | −1.02E-2 | −2.86E-2 | −1.88E-3 | - | - |
| L2 | −5.23 | −0.86 | −1.13E-2 | 6.06E-2 | −5.89E-3 | 1.12 | 0.39 | −0.62 | −1.56E-2 | 3.07E-3 | 8.98E-3 | 2.47E-3 | 0.14 | 0.44 | 0.75 | 3.31E-3 | −1.08E-2 | −3.04E-2 | −2.00E-3 | 0.27 | 0.60 |
| L3 | 5.70 | −1.65 | −1.43E-2 | 5.18E-3 | 7.31E-3 | 1.78 | 0.22 | −6.04E-3 | 1.31E-2 | 4.64E-3 | 7.26E-3 | −1.70E-4 | 0.21 | 0.14 | 1.03 | −0.13 | −9.48E-3 | −3.50E-2 | 1.74E-4 | 0.35 | 0.43 |
| L4 | 3.14 | −0.79 | −3.06E-2 | 2.98E-2 | 3.05E-2 | 2.01 | 0.24 | 0.59 | 5.68E-2 | 3.03E-3 | 5.42E-3 | 2.59E-3 | 0.24 | 0.09 | −1.36 | 1.88E-2 | −6.53E-3 | −2.15E-2 | −7.79E-3 | 0.43 | 0.36 |
| L5 | 2.23 | −0.61 | −2.67E-2 | 3.86E-2 | 2.09E-2 | 1.79 | 0.24 | 1.42 | 0.23 | 5.38E-3 | 1.33E-3 | 3.18E-3 | 0.35 | 0.08 | −0.73 | −2.49E-2 | −6.08E-3 | −2.57E-2 | −9.86E-3 | 0.42 | 0.45 |
| Quadratus Lumborum | |||||||||||||||||||||
| L1 | −1.32 | −0.28 | −5.96E-3 | 1.58E-2 | 9.98E-4 | - | - | −1.21 | −0.22 | −5.98E-4 | 2.99E-2 | 6.49E-4 | - | - | 0.22 | −1.47E-5 | −7.04E-3 | −1.64E-2 | 7.28E-3 | - | - |
| L2 | −4.37 | −0.93 | −1.97E-2 | 5.21E-2 | 3.30E-3 | 0.95 | 0.50 | −1.73 | −0.31 | −8.58E-4 | 4.29E-2 | 9.32E-4 | 0.54 | 0.50 | 0.31 | −2.08E-5 | −9.96E-3 | −2.32E-2 | 1.03E-2 | 0.40 | 0.23 |
| L3 | −0.29 | −1.44 | −3.89E-2 | 3.62E-2 | 1.99E-2 | 1.21 | 0.56 | 2.82 | −0.38 | −4.67E-3 | 2.22E-2 | 4.30E-3 | 0.43 | 0.52 | 0.63 | −1.52E-2 | −8.75E-3 | −2.90E-2 | 1.45E-2 | 0.46 | 0.18 |
| L4 | −4.28 | −0.10 | −3.86E-2 | 5.87E-2 | 2.75E-2 | 1.83 | 0.28 | 3.14 | 0.26 | −3.63E-3 | 2.14E-2 | 6.26E-3 | 0.71 | 0.09 | 0.41 | −6.23E-2 | −7.02E-3 | −2.19E-2 | 5.19E-3 | 0.54 | 0.09 |
Table 4.
Regression coefficients for estimating muscle ACSA and moment arms using Equation 2. Coefficients in bold are significant (p < 0.05), and R2 values in bold indicate significant regressions (p < 0.05). The regression coefficients for shaded levels (T6, T12, L1) were estimated by scaling the coefficients from the adjacent level. SEE = standard error of the estimate.
| ACSA | MA-X | MA-Y | |||||||||||||||||||
|---|---|---|---|---|---|---|---|---|---|---|---|---|---|---|---|---|---|---|---|---|---|
| CI | CS | CA | CH | CM | SEE (cm2) | R2 | CI | CS | CA | CH | CM | SEE (cm) | R2 | CI | CS | CA | CH | CM | SEE (cm) | R2 | |
| Pectoralis Major | |||||||||||||||||||||
| T6 | 12.45 | −3.26 | −4.66E-2 | −1.31E-2 | −2.41E-3 | - | - | 1.75 | 0.15 | 4.28E-3 | 9.18E-3 | 5.07E-3 | - | - | 4.80 | −1.13 | 2.34E-2 | 6.39E-3 | 3.72E-2 | - | - |
| T7 | 8.43 | −2.21 | −3.15E-2 | −8.85E-3 | −1.63E-3 | 1.27 | 0.43 | 1.81 | 0.15 | 4.42E-3 | 9.48E-3 | 5.24E-3 | 0.44 | 0.08 | 4.90 | −1.15 | 2.39E-2 | 6.53E-3 | 3.80E-2 | 0.89 | 0.62 |
| T8 | −1.74 | −0.71 | −4.93E-3 | 3.41E-2 | −1.12E-2 | 0.88 | 0.29 | 0.42 | −2.03E-2 | 1.18E-2 | 1.13E-2 | 1.64E-2 | 0.69 | 0.23 | 3.48 | −0.81 | 2.17E-2 | 1.52E-2 | 3.93E-2 | 1.00 | 0.54 |
| T9 | 4.80 | −0.85 | −4.53E-3 | −1.78E-2 | 1.13E-2 | 0.72 | 0.25 | 1.39 | −0.66 | 5.48E-3 | 1.65E-2 | 1.61E-3 | 0.88 | 0.23 | 7.25 | −0.93 | 1.73E-2 | −4.98E-3 | 3.95E-2 | 0.96 | 0.49 |
| Rectus Abdominis | |||||||||||||||||||||
| T10 | 14.15 | −2.15 | −2.21E-2 | −7.85E-2 | 6.94E-2 | 1.86 | 0.33 | −2.07 | −0.29 | 6.79E-3 | 4.15E-2 | −3.12E-4 | 1.25 | 0.14 | 13.97 | −1.54 | 1.72E-2 | −3.72E-2 | 9.76E-2 | 1.37 | 0.59 |
| T11 | 8.37 | −1.75 | −7.36E-3 | −4.11E-2 | 7.49E-2 | 2.12 | 0.28 | 6.38 | −0.71 | −5.97E-3 | −1.98E-2 | 3.22E-2 | 0.81 | 0.30 | 19.45 | −1.49 | 4.53E-3 | −8.00E-2 | 1.32E-1 | 1.41 | 0.58 |
| T12 | 8.33 | −1.74 | −7.32E-3 | −4.09E-2 | 7.45E-2 | - | - | 6.48 | −0.72 | −6.06E-3 | −2.01E-2 | 3.27E-2 | - | - | 18.38 | −1.41 | 4.28E-3 | −7.56E-2 | 1.24E-1 | - | - |
| L1 | 0.50 | −1.80 | −7.93E-3 | 1.98E-2 | 4.04E-2 | - | - | −1.67 | −0.23 | 1.46E-2 | 2.40E-2 | 2.33E-2 | - | - | 10.85 | −1.56 | −6.16E-3 | −2.25E-2 | 9.72E-2 | - | - |
| L2 | 0.50 | −1.79 | −7.89E-3 | 1.97E-2 | 4.02E-2 | 1.36 | 0.52 | −1.69 | −0.23 | 1.49E-2 | 2.43E-2 | 2.37E-2 | 0.61 | 0.51 | 9.90 | −1.43 | −5.62E-3 | −2.06E-2 | 8.87E-2 | 1.71 | 0.44 |
| L3 | 6.33 | −2.11 | −4.13E-2 | −4.50E-3 | 5.13E-2 | 1.39 | 0.58 | 1.49 | 1.02E-2 | 5.43E-3 | 2.48E-3 | 3.33E-2 | 0.62 | 0.37 | 6.38 | −1.46 | 2.39E-2 | −3.08E-2 | 1.19E-1 | 1.61 | 0.59 |
| L4 | 1.96 | −1.47 | −2.37E-2 | 1.26E-2 | 4.86E-2 | 1.33 | 0.55 | −1.15 | 0.25 | 1.32E-2 | 1.13E-2 | 4.10E-2 | 0.69 | 0.47 | 4.78 | −1.36 | 4.27E-2 | −2.91E-2 | 1.13E-1 | 1.51 | 0.64 |
| L5 | 5.25E-2 | −1.45 | −3.68E-2 | 2.44E-2 | 6.83E-2 | 1.41 | 0.65 | −1.40 | 0.44 | 1.61E-2 | 1.12E-2 | 3.47E-2 | 0.71 | 0.36 | 6.21 | −1.45 | 4.74E-2 | −2.95E-2 | 9.29E-2 | 1.48 | 0.62 |
| Serratus Anterior | |||||||||||||||||||||
| T6 | 5.89 | −1.87 | −2.25E-2 | −2.79E-2 | 7.02E-2 | - | - | 3.01 | −0.24 | −2.59E-3 | 1.52E-2 | 1.26E-2 | - | - | 1.29 | −0.39 | 8.47E-3 | −2.51E-3 | 1.62E-2 | - | - |
| T7 | 6.41 | −2.03 | −2.44E-2 | −3.03E-2 | 7.64E-2 | 1.11 | 0.70 | 3.03 | −0.24 | −2.61E-3 | 1.53E-2 | 1.27E-2 | 0.29 | 0.67 | 1.44 | −0.43 | 9.44E-3 | −2.80E-3 | 1.81E-2 | 0.55 | 0.39 |
| T8 | 9.36 | −2.03 | −1.87E-2 | −4.16E-2 | 6.73E-2 | 1.24 | 0.58 | 3.92 | −0.41 | −4.19E-3 | 1.22E-2 | 1.19E-2 | 0.30 | 0.68 | 4.21 | −0.61 | 7.86E-3 | −1.90E-2 | 2.12E-2 | 0.59 | 0.37 |
| T9 | 7.77 | −2.12 | −2.40E-2 | −1.78E-2 | 4.08E-2 | 1.07 | 0.62 | 3.62 | −0.44 | −4.41E-3 | 1.43E-2 | 1.27E-2 | 0.30 | 0.71 | 5.31 | −0.57 | 1.31E-2 | −2.71E-2 | 1.77E-2 | 0.65 | 0.26 |
| T10 | −5.06 | −0.79 | 2.81E-3 | 4.92E-2 | 1.24E-2 | 1.37 | 0.31 | 4.35 | −0.45 | −4.00E-3 | 9.20E-3 | 1.60E-2 | 0.33 | 0.66 | 7.17 | −0.32 | 4.68E-3 | −4.35E-2 | 3.37E-2 | 0.72 | 0.25 |
| T11 | −5.30 | 8.54E-2 | 2.82E-3 | 4.26E-2 | 3.91E-4 | 1.11 | 0.11 | 3.41 | −0.58 | 2.91E-3 | 1.46E-2 | 1.19E-2 | 0.31 | 0.75 | 9.71 | −0.29 | 2.97E-3 | −6.79E-2 | 6.19E-2 | 0.93 | 0.28 |
| Trapezius | |||||||||||||||||||||
| T6 | 10.44 | −1.92 | −4.62E-2 | −3.42E-2 | 4.51E-2 | - | - | 5.15 | −0.54 | −8.91E-3 | −9.52E-3 | 9.19E-3 | - | - | −2.09 | 0.15 | 7.61E-3 | −9.22E-3 | −1.35E-2 | - | - |
| T7 | 7.62 | −1.40 | −3.38E-2 | −2.49E-2 | 3.29E-2 | 1.20 | 0.40 | 4.21 | −0.44 | −7.29E-3 | −7.79E-3 | 7.52E-3 | 0.65 | 0.13 | −2.05 | 0.15 | 7.49E-3 | −9.06E-3 | −1.33E-2 | 0.24 | 0.68 |
| T8 | 5.12 | −0.92 | −2.10E-2 | −1.53E-2 | 1.97E-2 | 0.78 | 0.38 | 5.02 | −0.46 | −4.02E-3 | −1.57E-2 | 5.94E-3 | 0.57 | 0.10 | −2.74 | 0.23 | 6.92E-3 | −6.32E-3 | −1.18E-2 | 0.27 | 0.60 |
| T9 | 4.98 | −0.65 | −9.99E-3 | −2.23E-2 | 1.61E-2 | 0.69 | 0.22 | 3.18 | −0.32 | −1.23E-3 | −8.01E-3 | 5.01E-3 | 0.53 | 0.08 | −2.60 | 0.28 | 7.50E-3 | −8.56E-3 | −1.14E-2 | 0.27 | 0.65 |
| T10 | 2.57 | −0.38 | −4.76E-3 | −1.21E-2 | 1.19E-2 | 0.56 | 0.16 | 5.59 | −0.56 | −1.32E-3 | −2.38E-2 | 9.79E-3 | 0.71 | 0.09 | −1.39 | 0.16 | 3.48E-3 | −1.51E-2 | −1.04E-2 | 0.32 | 0.53 |
| T11 | −2.64 | 0.23 | 3.10E-3 | 1.44E-2 | 8.72E-3 | 0.36 | 0.20 | 1.41 | −0.43 | 3.30E-2 | −7.14E-3 | 2.28E-4 | 0.71 | 0.33 | 0.70 | 0.21 | −6.86E-3 | −3.43E-2 | 1.14E-2 | 0.45 | 0.34 |
| Latissimus Dorsi | |||||||||||||||||||||
| T6 | 4.71 | −0.97 | −1.53E-2 | −1.16E-2 | 5.07E-2 | - | - | 4.41 | 0.14 | −1.65E-2 | 6.66E-2 | 5.25E-3 | - | - | −8.78 | 1.61 | 3.67E-2 | 6.67E-2 | −4.41E-2 | - | - |
| T7 | 6.97 | −1.43 | −2.26E-2 | −1.71E-2 | 7.50E-2 | 2.06 | 0.34 | 3.93 | 0.12 | −1.48E-2 | 5.94E-2 | 4.68E-3 | 1.03 | 0.27 | −4.60 | 0.84 | 1.92E-2 | 3.49E-2 | −2.31E-2 | 1.35 | 0.10 |
| T8 | −1.08 | −2.62 | −4.39E-2 | 6.92E-2 | 4.02E-2 | 1.78 | 0.59 | 9.27 | −0.94 | −1.22E-2 | 1.74E-2 | 1.81E-2 | 0.78 | 0.47 | 1.75 | −0.49 | 1.11E-2 | −1.38E-2 | 6.57E-3 | 1.03 | 0.07 |
| T9 | 12.17 | −3.90 | −2.99E-2 | −2.18E-2 | 5.87E-2 | 1.82 | 0.61 | 7.39 | −0.83 | −7.24E-3 | 2.38E-2 | 1.34E-2 | 0.62 | 0.57 | 0.36 | −9.16E-2 | 1.26E-2 | −7.32E-3 | −4.52E-3 | 0.85 | 0.05 |
| T10 | −3.05 | −1.88 | −5.15E-3 | 3.89E-2 | 7.60E-2 | 1.41 | 0.68 | 10.58 | −0.80 | −2.20E-2 | −2.18E-4 | 2.92E-2 | 0.63 | 0.56 | 2.76 | 2.05E-2 | −2.55E-3 | −2.46E-2 | 3.43E-3 | 0.83 | 0.06 |
| T11 | −3.92 | −1.46 | 3.07E-3 | 3.82E-2 | 6.84E-2 | 1.13 | 0.72 | 8.04 | −0.84 | −1.12E-2 | 1.54E-2 | 1.28E-2 | 0.62 | 0.55 | 8.82 | −0.16 | −1.09E-2 | −6.91E-2 | 2.44E-2 | 0.88 | 0.18 |
| T12 | −3.21 | −1.19 | 2.51E-3 | 3.12E-2 | 5.59E-2 | - | - | 7.68 | −0.81 | −1.07E-2 | 1.47E-2 | 1.22E-2 | - | - | 12.31 | −0.23 | −1.52E-2 | −9.64E-2 | 3.41E-2 | - | - |
| L1 | 8.16 | −1.42 | −7.32E-3 | −3.16E-2 | 3.53E-2 | - | - | −3.81 | −9.06E-2 | 5.09E-3 | 6.96E-2 | 2.03E-2 | - | - | −2.73 | 0.36 | −1.28E-2 | −1.53E-3 | 2.95E-3 | - | - |
| L2 | 5.69 | −0.99 | −5.11E-3 | −2.21E-2 | 2.46E-2 | 1.20 | 0.19 | −3.74 | −8.90E-2 | 4.99E-3 | 6.83E-2 | 1.99E-2 | 0.78 | 0.57 | −3.01 | 0.39 | −1.41E-2 | −1.69E-3 | 3.25E-3 | 0.86 | 0.10 |
| L3 | 3.23 | −0.47 | 1.52E-2 | −1.77E-2 | 1.34E-2 | 1.09 | 0.10 | 7.55 | −0.31 | 9.34E-3 | −6.02E-3 | 3.47E-2 | 0.82 | 0.36 | 4.25 | 6.82E-2 | −1.42E-2 | −4.60E-2 | 9.54E-3 | 0.86 | 0.18 |
| External Oblique | |||||||||||||||||||||
| T10 | 0.37 | −0.29 | −2.77E-3 | −2.05E-3 | 1.99E-2 | 0.63 | 0.26 | 2.29 | −1.02 | −1.07E-2 | 4.63E-2 | 1.19E-2 | 1.35 | 0.35 | 15.33 | −1.49 | 9.99E-3 | −5.94E-2 | 8.52E-2 | 1.54 | 0.46 |
| T11 | 9.18 | −0.93 | −1.29E-2 | −4.10E-2 | 8.65E-3 | 0.58 | 0.25 | 13.07 | −1.48 | −1.37E-2 | −2.55E-2 | 4.33E-2 | 1.26 | 0.41 | 10.36 | −0.66 | 2.51E-2 | −4.69E-2 | 1.01E-1 | 1.35 | 0.55 |
| T12 | 16.88 | −1.71 | −2.37E-2 | −7.54E-2 | 1.59E-2 | - | - | 13.81 | −1.57 | −1.45E-2 | −2.70E-2 | 4.58E-2 | - | - | 8.58 | −0.55 | 2.08E-2 | −3.89E-2 | 8.39E-2 | - | - |
| L1 | 2.77 | −1.52 | −9.50E-3 | −2.63E-3 | 5.77E-2 | - | - | 4.76 | −0.72 | 8.75E-3 | 1.96E-2 | 4.70E-2 | - | - | 3.87 | −0.31 | 9.83E-3 | 1.79E-2 | −1.48E-2 | - | - |
| L2 | 3.69 | −2.02 | −1.26E-2 | −3.51E-3 | 7.68E-2 | 1.61 | 0.53 | 4.90 | −0.75 | 9.01E-3 | 2.02E-2 | 4.84E-2 | 0.64 | 0.72 | 2.40 | −0.19 | 6.11E-3 | 1.11E-2 | −9.17E-3 | 1.41 | 0.02 |
| L3 | 1.36 | −2.24 | −1.82E-2 | 2.01E-2 | 6.79E-2 | 1.43 | 0.64 | 5.30 | −0.35 | 1.84E-2 | 4.84E-3 | 6.52E-2 | 0.64 | 0.72 | 3.37 | −0.40 | 4.41E-3 | −1.79E-2 | 2.79E-2 | 1.23 | 0.09 |
| L4 | −2.16 | −1.84 | 1.07E-3 | 3.41E-2 | 6.33E-2 | 1.54 | 0.60 | 3.19 | −0.10 | 2.28E-2 | 1.65E-2 | 5.44E-2 | 0.54 | 0.75 | 3.91 | −0.68 | −8.38E-3 | −1.01E-2 | 1.13E-2 | 0.77 | 0.20 |
| L5 | 0.84 | −0.42 | 1.87E-2 | −7.58E-3 | 4.97E-2 | 1.71 | 0.20 | 0.43 | 0.48 | 2.61E-2 | 3.34E-2 | 4.29E-2 | 0.82 | 0.47 | 4.74 | −1.04 | −1.88E-3 | 1.10E-3 | 1.24E-3 | 1.18 | 0.17 |
| Internal Oblique | |||||||||||||||||||||
| L2 | −6.98 | −1.93 | 6.02E-2 | 3.66E-2 | 3.98E-2 | 2.30 | 0.36 | 4.50 | −0.99 | 4.55E-3 | 1.71E-2 | 4.86E-2 | 0.68 | 0.76 | 9.30 | −5.93E-2 | 1.07E-2 | −3.60E-2 | 1.73E-2 | 1.60 | 0.04 |
| L3 | 26.66 | −4.71 | −5.22E-2 | −1.12E-1 | 6.86E-2 | 1.92 | 0.59 | 1.63 | −2.64E-2 | 1.74E-2 | 2.30E-2 | 5.50E-2 | 0.75 | 0.60 | −4.41 | 0.15 | 1.77E-2 | 2.03E-2 | 3.67E-2 | 1.28 | 0.18 |
| L4 | −2.67 | −2.71 | 2.20E-2 | 3.33E-2 | 7.53E-2 | 1.89 | 0.63 | 0.26 | 0.32 | 3.20E-2 | 2.96E-2 | 5.74E-2 | 0.77 | 0.64 | 2.58 | −0.73 | −7.81E-3 | −4.98E-3 | 3.44E-2 | 1.00 | 0.36 |
| L5 | 0.45 | −0.73 | 1.47E-2 | −1.20E-2 | 8.72E-2 | 1.98 | 0.36 | −0.43 | 0.74 | 3.32E-2 | 3.84E-2 | 3.60E-2 | 0.96 | 0.35 | 2.74 | −1.18 | 4.36E-3 | 9.83E-3 | 2.12E-2 | 1.15 | 0.38 |
| Psoas Major | |||||||||||||||||||||
| L1 | −0.90 | −0.63 | −1.14E-2 | 1.96E-2 | 4.73E-3 | - | - | −0.27 | −0.20 | 1.59E-3 | 1.36E-2 | 4.20E-3 | - | - | 1.92E-2 | −0.21 | −1.59E-3 | −1.37E-3 | −2.67E-3 | - | - |
| L2 | −2.86 | −2.00 | −3.62E-2 | 6.21E-2 | 1.50E-2 | 1.74 | 0.48 | −0.36 | −0.27 | 2.11E-3 | 1.82E-2 | 5.60E-3 | 0.27 | 0.61 | 2.35E-2 | −0.26 | −1.94E-3 | −1.68E-3 | −3.27E-3 | 0.27 | 0.14 |
| L3 | 12.01 | −3.98 | −7.55E-2 | −2.71E-3 | 4.85E-2 | 2.28 | 0.57 | 1.22 | −0.29 | −1.73E-4 | 1.19E-2 | 8.16E-3 | 0.24 | 0.68 | 1.58 | −0.42 | −5.97E-3 | −1.11E-2 | 2.58E-3 | 0.31 | 0.23 |
| L4 | 14.11 | −5.57 | −8.36E-2 | 1.92E-3 | 7.49E-2 | 2.26 | 0.73 | 0.81 | −0.19 | 9.03E-4 | 1.76E-2 | 6.92E-3 | 0.23 | 0.69 | 1.08 | −0.38 | −3.47E-4 | −8.87E-3 | 6.77E-3 | 0.45 | 0.16 |
| L5 | 8.90 | −4.81 | −4.72E-2 | 3.02E-2 | 4.51E-2 | 1.95 | 0.73 | 0.41 | 2.47E-2 | 6.80E-3 | 2.05E-2 | 7.60E-3 | 0.50 | 0.26 | 0.73 | −0.41 | 1.48E-3 | 1.91E-3 | 1.34E-3 | 0.65 | 0.12 |
| Erector Spinae | |||||||||||||||||||||
| T6 | 3.47 | −1.02 | −2.90E-2 | 4.93E-3 | 2.30E-2 | - | - | 2.70 | −0.59 | 5.44E-3 | 7.74E-3 | −2.07E-3 | - | - | −1.98 | 7.73E-2 | 5.79E-3 | −1.20E-2 | −1.11E-2 | - | - |
| T7 | 3.59 | −1.05 | −3.00E-2 | 5.10E-3 | 2.38E-2 | 1.16 | 0.40 | 2.74 | −0.60 | 5.51E-3 | 7.84E-3 | −2.10E-3 | 0.56 | 0.28 | −1.93 | 7.54E-2 | 5.65E-3 | −1.17E-2 | −1.08E-2 | 0.31 | 0.49 |
| T8 | 3.70 | −1.14 | −3.40E-2 | 1.02E-2 | 2.09E-2 | 1.15 | 0.42 | 0.89 | −0.41 | 2.32E-3 | 1.80E-2 | 1.22E-3 | 0.54 | 0.32 | −1.49 | 0.13 | 4.48E-3 | −1.59E-2 | −8.38E-3 | 0.35 | 0.46 |
| T9 | 6.35 | −1.46 | −4.30E-2 | 2.71E-3 | 1.82E-2 | 1.15 | 0.48 | 2.49 | −0.52 | 2.91E-3 | 6.32E-3 | 6.92E-3 | 0.49 | 0.40 | −1.58 | 0.21 | 5.66E-3 | −1.77E-2 | −7.28E-3 | 0.32 | 0.57 |
| T10 | 1.22 | −1.07 | −5.14E-2 | 3.26E-2 | 4.27E-2 | 1.50 | 0.49 | 2.47 | −0.50 | −1.17E-3 | 7.33E-3 | 8.83E-3 | 0.43 | 0.48 | −1.10 | 0.16 | 1.72E-3 | −2.02E-2 | −6.65E-3 | 0.37 | 0.46 |
| T11 | −3.09 | −0.90 | −5.87E-2 | 9.78E-2 | −1.05E-2 | 1.59 | 0.48 | 5.10 | −0.50 | −3.69E-3 | −1.22E-2 | 2.16E-2 | 0.42 | 0.51 | 1.40 | 0.17 | −3.14E-3 | −3.83E-2 | 3.44E-3 | 0.44 | 0.47 |
| T12 | −4.10 | −1.19 | −7.79E-2 | 1.30E-1 | −1.39E-2 | - | - | 5.12 | −0.50 | −3.70E-3 | −1.22E-2 | 2.16E-2 | - | - | 1.44 | 0.18 | −3.23E-3 | −3.95E-2 | 3.54E-3 | - | - |
| L1 | −0.30 | −2.26 | −3.74E-2 | 7.42E-2 | 8.06E-2 | - | - | −0.26 | −0.18 | 2.61E-4 | 2.35E-2 | 8.07E-3 | - | - | −1.57 | 0.13 | −9.85E-3 | −1.72E-2 | −4.65E-3 | - | - |
| L2 | −0.32 | −2.47 | −4.09E-2 | 8.11E-2 | 8.80E-2 | 2.48 | 0.57 | −0.26 | −0.18 | 2.62E-4 | 2.36E-2 | 8.09E-3 | 0.25 | 0.70 | −1.63 | 0.14 | −1.02E-2 | −1.78E-2 | −4.81E-3 | 0.41 | 0.37 |
| L3 | 2.42 | −2.90 | −4.22E-2 | 4.61E-2 | 1.19E-1 | 3.06 | 0.55 | 1.25 | −7.83E-2 | 2.00E-3 | 1.34E-2 | 8.67E-3 | 0.24 | 0.57 | −0.83 | 8.75E-2 | −4.59E-3 | −2.47E-2 | −4.72E-3 | 0.38 | 0.44 |
| L4 | 4.20 | −1.00 | −1.97E-2 | 1.65E-2 | 6.81E-2 | 2.38 | 0.30 | 2.01 | 8.20E-2 | 2.38E-3 | 7.82E-3 | 5.69E-3 | 0.25 | 0.21 | −1.02 | 7.77E-2 | −1.96E-3 | −1.89E-2 | −2.79E-3 | 0.37 | 0.32 |
| L5 | 5.97 | 0.26 | 6.66E-3 | −3.05E-2 | 2.56E-2 | 1.78 | 0.04 | 1.68 | 0.33 | 4.88E-3 | 4.55E-3 | 2.77E-3 | 0.28 | 0.16 | 0.23 | −0.11 | −4.02E-3 | −1.93E-2 | −3.02E-3 | 0.33 | 0.26 |
| Transversospinalis | |||||||||||||||||||||
| T6 | 0.55 | −0.46 | −1.91E-2 | 1.65E-2 | 4.70E-3 | - | - | 6.39E-2 | −9.46E-2 | 2.97E-3 | 6.51E-3 | −1.14E-4 | - | - | −1.38 | 0.10 | 8.08E-4 | −1.25E-2 | −4.88E-3 | - | - |
| T7 | 0.49 | −0.41 | −1.69E-2 | 1.46E-2 | 4.17E-3 | 0.52 | 0.43 | 5.70E-2 | −8.45E-2 | 2.65E-3 | 5.81E-3 | −1.02E-4 | 0.17 | 0.24 | −1.39 | 0.10 | 8.15E-4 | −1.26E-2 | −4.92E-3 | 0.21 | 0.54 |
| T8 | 1.72 | −0.49 | −2.06E-2 | 1.09E-2 | −2.08E-3 | 0.48 | 0.44 | 0.39 | −7.48E-2 | −1.26E-3 | 4.77E-3 | −7.27E-4 | 0.15 | 0.21 | −1.32 | 0.13 | 1.47E-3 | −1.44E-2 | −3.98E-3 | 0.21 | 0.58 |
| T9 | 1.12 | −0.30 | −1.35E-2 | 8.96E-3 | 4.07E-3 | 0.59 | 0.24 | 0.62 | −3.82E-2 | −5.87E-4 | 1.70E-3 | 2.14E-3 | 0.15 | 0.15 | −1.06 | 0.14 | 1.82E-3 | −1.76E-2 | −2.81E-3 | 0.22 | 0.61 |
| T10 | 0.95 | −0.44 | −1.28E-2 | 9.66E-3 | 7.62E-3 | 0.59 | 0.33 | 0.82 | −8.35E-2 | 2.13E-4 | 5.08E-4 | 1.65E-3 | 0.13 | 0.21 | −0.34 | 0.10 | −2.01E-3 | −2.14E-2 | −1.29E-3 | 0.26 | 0.51 |
| T11 | −0.96 | −0.47 | −3.17E-3 | 1.71E-2 | 9.92E-3 | 0.60 | 0.42 | 1.74 | −0.22 | 1.01E-3 | −5.87E-3 | 4.56E-3 | 0.15 | 0.40 | 0.33 | 0.11 | −1.25E-3 | −2.71E-2 | 1.38E-3 | 0.30 | 0.51 |
| T12 | −1.01 | −0.49 | −3.34E-3 | 1.80E-2 | 1.05E-2 | - | - | 1.80 | −0.23 | 1.04E-3 | −6.05E-3 | 4.70E-3 | - | - | 0.34 | 0.11 | −1.29E-3 | −2.80E-2 | 1.42E-3 | - | - |
| L1 | −4.22 | −0.69 | −9.14E-3 | 4.88E-2 | −4.75E-3 | - | - | −0.56 | −1.40E-2 | 2.74E-3 | 8.03E-3 | 2.21E-3 | - | - | 0.67 | 2.96E-3 | −9.66E-3 | −2.71E-2 | −1.79E-3 | - | - |
| L2 | −4.94 | −0.81 | −1.07E-2 | 5.72E-2 | −5.57E-3 | 1.06 | 0.39 | −0.59 | −1.48E-2 | 2.90E-3 | 8.48E-3 | 2.33E-3 | 0.13 | 0.44 | 0.71 | 3.12E-3 | −1.02E-2 | −2.87E-2 | −1.89E-3 | 0.26 | 0.60 |
| L3 | 5.24 | −1.52 | −1.31E-2 | 4.75E-3 | 6.72E-3 | 1.63 | 0.22 | −5.55E-3 | 1.20E-2 | 4.26E-3 | 6.67E-3 | −1.56E-4 | 0.20 | 0.14 | 0.95 | −0.12 | −8.71E-3 | −3.21E-2 | 1.60E-4 | 0.32 | 0.43 |
| L4 | 2.93 | −0.74 | −2.86E-2 | 2.78E-2 | 2.84E-2 | 1.88 | 0.24 | 0.55 | 5.30E-2 | 2.83E-3 | 5.06E-3 | 2.41E-3 | 0.22 | 0.09 | −1.26 | 1.76E-2 | −6.09E-3 | −2.00E-2 | −7.27E-3 | 0.40 | 0.36 |
| L5 | 2.10 | −0.58 | −2.52E-2 | 3.64E-2 | 1.97E-2 | 1.68 | 0.24 | 1.34 | 0.22 | 5.07E-3 | 1.25E-3 | 2.99E-3 | 0.33 | 0.08 | −0.69 | −2.34E-2 | −5.73E-3 | −2.42E-2 | −9.29E-3 | 0.39 | 0.45 |
| Quadratus Lumborum | |||||||||||||||||||||
| L1 | −1.20 | −0.26 | −5.43E-3 | 1.44E-2 | 9.10E-4 | - | - | −1.18 | −0.21 | −5.86E-4 | 2.93E-2 | 6.36E-4 | - | - | 0.17 | −1.16E-5 | −5.55E-3 | −1.29E-2 | 5.74E-3 | - | - |
| L2 | −3.95 | −0.84 | −1.78E-2 | 4.71E-2 | 2.98E-3 | 0.86 | 0.50 | −1.57 | −0.28 | −7.76E-4 | 3.87E-2 | 8.42E-4 | 0.49 | 0.50 | 0.28 | −1.88E-5 | −9.00E-3 | −2.10E-2 | 9.32E-3 | 0.36 | 0.23 |
| L3 | −0.25 | −1.27 | −3.42E-2 | 3.18E-2 | 1.75E-2 | 1.06 | 0.56 | 2.48 | −0.34 | −4.10E-3 | 1.95E-2 | 3.78E-3 | 0.38 | 0.52 | 0.55 | −1.34E-2 | −7.70E-3 | −2.55E-2 | 1.28E-2 | 0.41 | 0.18 |
| L4 | −3.48 | −7.88E-2 | −3.14E-2 | 4.78E-2 | 2.24E-2 | 1.49 | 0.28 | 2.55 | 0.21 | −2.95E-3 | 1.74E-2 | 5.09E-3 | 0.58 | 0.09 | 0.34 | −5.07E-2 | −5.71E-3 | −1.78E-2 | 4.22E-3 | 0.44 | 0.09 |
4. Discussion
The purpose of this study was to use muscle morphology measurements from a community-based sample of men and women to develop a set of regression equations based on age, sex, height and body mass to estimate trunk muscle morphology from T6 – L5. In general, the measured values for muscle CSA and position found here are similar to those reported in previous studies, with some differences likely arising from differences in measurement technique, subject sample characteristics, and muscle classification schemes. For example, this study used a community-based sample of men and women across a wide range of ages, whereas a comparable study by Marras et al. (2001), which reported ACSAs from T8 to S1, was based on a convenience sample of young healthy subjects. Our results were similar to Marras et al., with our ACSAs tending to be smaller, which is reasonable based on the age difference between our subject samples. An important exception to this was the erector spinae, in which Marras et al. reported ACSAs that were much larger than the ACSAs found in this study. This was because the transversospinalis and erector spinae were measured as a single muscle group, whereas in our study they were measured as two separate muscle groups. In fact, grouping of the erector spinae with the transversospinalis may be found in several other reports of muscle parameters as well (Chaffin et al. 1990; Jorgensen et al. 2001; Tracy et al. 1989). Given that these two muscles have different functional roles, it may be important to clearly differentiate the two in future studies. Another study (Kumar 1988) which used men and women over a wide age range reported muscle positions relative to the vertebral body (T7, T12, L3, and L5) that were comparable with those reported in the current study.
A number of previous studies have created regression equations to provide a way of accounting for differences in muscle parameters due to body size (Chaffin et al. 1990; Jorgensen et al. 2001; Marras et al. 2001; Moga et al. 1993; Reid et al. 1987; Seo et al. 2003; Tracy et al. 1989). Compared to previously reported regressions, the regressions reported here for CSA and ML-d are not generally different in terms of the R2 or SEE. In fact, R2 values tend to be higher for the current regressions of CSA than regressions reported previously. However, the AP-d regressions reported here tend to have somewhat lower R2 and higher SEE than regressions reported previously. There are several possible reasons for these differences, including the fact that this study includes a larger and more varied group of subjects than most previous studies. With the differences in subject sample and methodology, direct comparisons of regression fits and error estimates must be approached with caution. Nonetheless, overall the regressions reported here appear to be similar to previously reported regressions in terms of ability to accurately predict muscle parameters.
A substantial number of the regressions reported here have low R2 values. This is in keeping with previous studies providing regressions to predict muscle parameters, but it does raise the question of whether there may be better ways to predict muscle parameters. For example, other anthropometric measurements, particularly trunk width and depth, have been used in previous regressions for prediction of muscle parameters (Chaffin et al. 1990; Jorgensen et al. 2001; Marras et al. 2001; Moga et al. 1993; Reid et al. 1987; Tracy et al. 1989). In exploring this question, we found that including other independent variables, such as trunk width and depth, as well as higher order (quadratic) terms, could produce higher R2 values in many cases. However, the use of more predictor terms or attempting to select the “best” terms raises the risk of overfitting the data (Babyak 2004), that is fitting noise in the sample rather than legitimate trends in the data. Overfitting would negatively affect the ability of the regressions to predict muscle parameters for the general population, which is a primary goal of this study. Thus, in spite of low R2 values in some cases, the use of four simple independent variables chosen a priori improves the generalizability of the regressions presented here.
Adjustments to the muscle data presented here may be desired when applying it to musculoskeletal modeling. Scans were taken with subjects lying in a supine position, and muscle parameters may vary in other positions. For example, rectus abdominis moment arm in the lumbar spine increases by an average of about 30% in upright standing as compared to supine (Jorgensen et al. 2005; McGill et al. 1996), while erector spinae moment arm increases by about 3% in men and 12% in women (McGill et al. 1996). Jorgensen et al. found that both CSA and moment arm of lumbar extensor muscles decreases with increasing forward flexion from a neutral posture as measured with MRI in individuals lying on their sides (Jorgensen et al. 2003a; Jorgensen et al. 2003b). Thus, adjustment for body positions may be warranted when using this data in musculoskeletal models. In addition, estimates of ACSA and moment arms were provided to allow for more direct application of this data to musculoskeletal models. However, it should be recognized that ACSAs and moment arms were calculated using literature information on muscle lines of action. Line of action information is limited for some muscles, and because it is based on limited data it may not be representative of the general population. Thus, there is a need for further studies of muscle lines of action in the trunk, and how they may vary with age, sex and anthropometric variables. By providing regressions for muscle CSA and location in the transverse plane, this study allows users to select other sources for muscle line of action information as available and appropriate.
There are several limitations of this study that should be noted. While the QCT data included both sexes and a range of ages from a community-based sample, the subjects in this population were largely of Caucasian descent, and further studies are needed to determine whether these regressions would apply to individuals of different racial or ethnic backgrounds. In addition, the muscle parameters measured may have been skewed in some way toward smaller individuals, as instances of muscles extending outside the QCT image field of view were more common in larger individuals, and taller individuals were more likely to be missing vertebral levels in the images. In addition, because of the scanning protocol used, there was not sufficient data for regressions at levels T6, T12 and L1, so regressions at these levels were approximated from adjacent levels. While this paper provides new information on musculature in the mid-thoracic, thoraco-lumbar and lumbar spine, it does not address the upper thoracic spine (i.e., T1–T5). The regressions created used age, sex, height and body mass as independent variables, but it should be noted that these variables are not fully independent of each other. For example, height was higher in men than women, decreased with age, and increased with body mass. Therefore, effects of multicolinearity are likely present in the reported regression equations. This does not reduce the predictive value of the equations, but does limit the ability to deduce the specific contribution of each particular variable to muscle morphology. For this work that was considered acceptable, as the primary purpose of this work was to provide a method to estimate muscle parameters, rather than an analysis of the relationships between muscle morphology and anthropometric measurements.
In conclusion, we present a method for estimating the size and position of trunk muscles from vertebral levels T6 through L5. This represents the first such data reported for a community-based sample including a wide range of vertebral levels (T6-L5) and ages (36 – 87 years), as well as both males and females. The independent variables used, age, sex, height and body mass, are simply obtained and commonly obtained clinically. Thus, this data provides a useful resource for musculoskeletal modeling of the thoraco-lumbar trunk in a wide range of individuals.
Supplementary Material
Acknowledgments
We acknowledge Dr. Thomas Lang (UCSF Department of Radiology) for development of the software used for muscle analysis. This work was supported by grants from the National Institutes of Health (R01AR053986, R01AR/AG041398, T32AG023480), and by the National Heart, Lung, and Blood Institute (NHLBI) Framingham Heart Study (NIH/NHLBI Contract N01-HC-25195). The contents are solely the responsibility of the authors, and do not necessarily represent the views of the NIH.
Footnotes
Conflict of Interest Statement
The authors have no conflict of interest to report.
Publisher's Disclaimer: This is a PDF file of an unedited manuscript that has been accepted for publication. As a service to our customers we are providing this early version of the manuscript. The manuscript will undergo copyediting, typesetting, and review of the resulting proof before it is published in its final citable form. Please note that during the production process errors may be discovered which could affect the content, and all legal disclaimers that apply to the journal pertain.
References
- Babyak MA. What you see may not be what you get: a brief, nontechnical introduction to overfitting in regression-type models. Psychosom Med. 2004;66:411–421. doi: 10.1097/01.psy.0000127692.23278.a9. [DOI] [PubMed] [Google Scholar]
- Briggs AM, Bragge P, Smith AJ, Govil D, Straker LM. Prevalence and associated factors for thoracic spine pain in the adult working population: a literature review. Journal of Occupational Health. 2009a;51:177–192. doi: 10.1539/joh.k8007. [DOI] [PubMed] [Google Scholar]
- Briggs AM, Smith AJ, Straker LM, Bragge P. Thoracic spine pain in the general population: prevalence, incidence and associated factors in children, adolescents and adults. A systematic review. BMC Musculoskelet Disord. 2009b;10:77. doi: 10.1186/1471-2474-10-77. [DOI] [PMC free article] [PubMed] [Google Scholar]
- Chaffin DB, Redfern MS, Erig M, Goldstein SA. Lumbar muscle size and locations from CT scans of 96 women of age 40–63 years. Clinical Biomechanics. 1990;5:9–16. doi: 10.1016/0268-0033(90)90026-3. [DOI] [PubMed] [Google Scholar]
- Delmas PD, van de Langerijt L, Watts NB, Eastell R, Genant H, Grauer A, Cahall DL. Underdiagnosis of vertebral fractures is a worldwide problem: the IMPACT study. Journal of Bone and Mineral Research. 2005;20:557–563. doi: 10.1359/JBMR.041214. [DOI] [PubMed] [Google Scholar]
- Dumas GA, Poulin MJ, Roy B, Gagnon M, Jovanovic M. Orientation and moment arms of some trunk muscles. Spine. 1991;16:293–303. doi: 10.1097/00007632-199103000-00007. [DOI] [PubMed] [Google Scholar]
- Freitas SS, Barrett-Connor E, Ensrud KE, Fink HA, Bauer DC, Cawthon PM, Lambert LC, Orwoll ES. Rate and circumstances of clinical vertebral fractures in older men. Osteoporosis International. 2008;19:615–623. doi: 10.1007/s00198-007-0510-1. [DOI] [PMC free article] [PubMed] [Google Scholar]
- Garner BA, Pandy MG. A Kinematic Model of the Upper Limb Based on the Visible Human Project (VHP) Image Dataset. Comput Methods Biomech Biomed Engin. 1999;2:107–124. doi: 10.1080/10255849908907981. [DOI] [PubMed] [Google Scholar]
- Garner BA, Pandy MG. Musculoskeletal model of the upper limb based on the visible human male dataset. Comput Methods Biomech Biomed Engin. 2001;4:93–126. doi: 10.1080/10255840008908000. [DOI] [PubMed] [Google Scholar]
- Hoffmann U, Massaro JM, Fox CS, Manders E, O’Donnell CJ. Defining normal distributions of coronary artery calcium in women and men (from the Framingham Heart Study) American Journal of Cardiology. 2008;102:1136–1141. doi: 10.1016/j.amjcard.2008.06.038. [DOI] [PMC free article] [PubMed] [Google Scholar]
- Ismail AA, Cooper C, Felsenberg D, Varlow J, Kanis JA, Silman AJ, O’Neill TW. Number and type of vertebral deformities: epidemiological characteristics and relation to back pain and height loss. European Vertebral Osteoporosis Study Group. Osteoporosis International. 1999;9:206–213. doi: 10.1007/s001980050138. [DOI] [PubMed] [Google Scholar]
- Iyer S, Christiansen BA, Roberts BJ, Valentine MJ, Manoharan RK, Bouxsein ML. A biomechanical model for estimating loads on thoracic and lumbar vertebrae. Clinical Biomechanics. 2010;25:853–858. doi: 10.1016/j.clinbiomech.2010.06.010. [DOI] [PMC free article] [PubMed] [Google Scholar]
- Jorgensen MJ, Marras WS, Granata KP, Wiand JW. MRI-derived moment-arms of the female and male spine loading muscles. Clinical Biomechanics. 2001;16:182–193. doi: 10.1016/s0268-0033(00)00087-5. [DOI] [PubMed] [Google Scholar]
- Jorgensen MJ, Marras WS, Gupta P. Cross-sectional area of the lumbar back muscles as a function of torso flexion. Clinical Biomechanics. 2003a;18:280–286. doi: 10.1016/s0268-0033(03)00027-5. [DOI] [PubMed] [Google Scholar]
- Jorgensen MJ, Marras WS, Gupta P, Waters TR. Effect of torso flexion on the lumbar torso extensor muscle sagittal plane moment arms. The Spine Journal. 2003b;3:363–369. doi: 10.1016/s1529-9430(03)00140-2. [DOI] [PubMed] [Google Scholar]
- Jorgensen MJ, Marras WS, Smith FW, Pope MH. Sagittal plane moment arms of the female lumbar region rectus abdominis in an upright neutral torso posture. Clinical Biomechanics. 2005;20:242–246. doi: 10.1016/j.clinbiomech.2004.10.009. [DOI] [PubMed] [Google Scholar]
- Kumar S. Moment arms of spinal musculature determined from CT scans. Clinical Biomechanics. 1988;3:137–144. doi: 10.1016/0268-0033(88)90059-9. [DOI] [PubMed] [Google Scholar]
- Macintosh JE, Bogduk N. The biomechanics of the lumbar multifidus. Clinical Biomechanics. 1986;1:205–213. doi: 10.1016/0268-0033(86)90147-6. [DOI] [PubMed] [Google Scholar]
- Macintosh JE, Bogduk N. The attachments of the lumbar erector spinae. Spine. 1991;16:783–792. doi: 10.1097/00007632-199107000-00017. [DOI] [PubMed] [Google Scholar]
- Marras WS, Jorgensen MJ, Granata KP, Wiand B. Female and male trunk geometry: size and prediction of the spine loading trunk muscles derived from MRI. Clinical Biomechanics. 2001;16:38–46. doi: 10.1016/s0268-0033(00)00046-2. [DOI] [PubMed] [Google Scholar]
- McGill SM, Juker D, Axler C. Correcting trunk muscle geometry obtained from MRI and CT scans of supine postures for use in standing postures. Journal of Biomechanics. 1996;29:643–646. doi: 10.1016/0021-9290(95)00119-0. [DOI] [PubMed] [Google Scholar]
- McGill SM, Patt N, Norman RW. Measurement of the trunk musculature of active males using CT scan radiography: Implications for force and moment generating capacity about the L4/L5 joint. Journal of Biomechanics. 1988;21:329–341. doi: 10.1016/0021-9290(88)90262-x. [DOI] [PubMed] [Google Scholar]
- McGill SM, Santaguida L, Stevens J. Measurement of the trunk musculature from T5 to L5 using MRI scans of 15 young males corrected for muscle fibre orientation. Clinical Biomechanics. 1993;8:171–178. doi: 10.1016/0268-0033(93)90011-6. [DOI] [PubMed] [Google Scholar]
- Melton LJ, 3rd, Kan SH, Frye MA, Wahner HW, O’Fallon WM, Riggs BL. Epidemiology of vertebral fractures in women. Am J Epidemiol. 1989;129:1000–1011. doi: 10.1093/oxfordjournals.aje.a115204. [DOI] [PubMed] [Google Scholar]
- Melton LJ, 3rd, Lane AW, Cooper C, Eastell R, O’Fallon WM, Riggs BL. Prevalence and incidence of vertebral deformities. Osteoporosis International. 1993;3:113–119. doi: 10.1007/BF01623271. [DOI] [PubMed] [Google Scholar]
- Moga PJ, Erig M, Chaffin DB, Nussbaum MA. Torso muscle moment arms at intervertebral levels T10 through L5 from CT scans on eleven male and eight female subjects. Spine. 1993;18:2305–2309. doi: 10.1097/00007632-199311000-00028. [DOI] [PubMed] [Google Scholar]
- Németh G, Ohlsén H. Moment arm lengths of trunk muscles to the lumbosacral joint obtained in vivo with computed tomography. Spine. 1986;11:158–160. doi: 10.1097/00007632-198603000-00011. [DOI] [PubMed] [Google Scholar]
- Reid JG, Costigan PA, Comrie W. Prediction of trunk muscle areas and moment arms by use of anthropometric measures. Spine. 1987;12:273–275. doi: 10.1097/00007632-198704000-00015. [DOI] [PubMed] [Google Scholar]
- Santaguida P. MSc Thesis. University of Waterloo; Waterloo: 1991. The Psoas Major Muscle: A three-dimensional anatomical and mechanical study with respect to the spine. [Google Scholar]
- Seo A, Lee JH, Kusaka Y. Estimation of trunk muscle parameters for a biomechanical model by age, height and weight. Journal of Occupational Health. 2003;45:197–201. doi: 10.1539/joh.45.197. [DOI] [PubMed] [Google Scholar]
- Tracy MF, Gibson MJ, Szypryt EP, Rutherford A, Corlett EN. The geometry of the muscles of the lumbar spine determined by magnetic resonance imaging. Spine. 1989;14:186–193. doi: 10.1097/00007632-198902000-00007. [DOI] [PubMed] [Google Scholar]
- Van der Klift M, De Laet CE, McCloskey EV, Hofman A, Pols HA. The incidence of vertebral fractures in men and women: the Rotterdam Study. Journal of Bone and Mineral Research. 2002;17:1051–1056. doi: 10.1359/jbmr.2002.17.6.1051. [DOI] [PubMed] [Google Scholar]
Associated Data
This section collects any data citations, data availability statements, or supplementary materials included in this article.