Abstract
The base 5-hydroxymethylcytosine (5hmC) was recently identified as an oxidation product of 5-methylcytosine (5mC) in mammalian DNA. Here, using sensitive and quantitative methods to assess levels of 5-hydroxymethyl-2′-deoxycytidine (5hmdC) and 5-methyl-2′-deoxycytidine (5mdC) in genomic DNA, we investigated whether levels of 5hmC can distinguish normal tissue from tumor tissue. In squamous cell lung cancers, levels of 5hmdC were depleted substantially with up to 5-fold reduction compared to normal lung tissue. In brain tumors, 5hmdC showed an even more drastic reduction with levels up to >30-fold lower than in normal brain, but 5hmdC levels were independent of mutations in isocitrate dehydrogenase-1 (IDH1). Furthermore, immunohistochemical analysis indicated that 5hmC is remarkably depleted in many types of human cancer. Importantly, an inverse relationship between 5hmC levels and cell proliferation was observed with lack of 5hmC in proliferating cells. The data therefore suggest that 5hmdC is strongly depleted in human malignant tumors, a finding that adds another layer of complexity to the aberrant epigenome found in cancer tissue. In addition, a lack of 5hmC may become a useful biomarker for cancer diagnosis.
Introduction
Recently, 5hmC has been identified as an oxidation product of 5mC in mammalian DNA (1, 2) generated by the alpha-ketoglutarate-dependent Tet dioxygenases (2, 3). Levels of 5hmC are tissue-dependent and the highest levels have been found in the central nervous system (4, 5). The biological function of 5hmC is currently unknown. 5hmC may be an intermediate in DNA demethylation processes that accomplishes the conversion of 5mC to cytosine (6). The distribution of 5hmC in embryonic stem cells (7–12), mouse cerebellum (13), and human prefrontal cortex (14) has been mapped by array- or sequencing-based assays. 5hmC was enriched at promoters and within gene bodies.
Several hematological malignancies carry mutations in one of the TET genes, TET2 (15). TET2 mutations were linked to aberrant levels of 5hmC and 5mC in these cancer genomes (16, 17). Also, mutations in IDH1 have been linked to abnormal DNA methylation patterns (18). One attractive proposal is that mutated IDH1 produces a new metabolite, 2-hydroxyglutarate (2HG) (19), which can inhibit TET proteins potentially leading to altered levels of 5hmC and 5mC in tumors(20).
Systematic studies on levels of 5hmC in human cancers are lacking. Here, we have used liquid chromatography tandem mass spectrometry (LC-MS/MS), to assess the levels of 5hmdC and 5mdC in human lung carcinomas and in brain tumor DNA. We also used immunofluorescence staining to assess 5hmC in a series of normal and malignant tissue sections.
Materials and Methods
DNA samples
Stage-I lung squamous cell carcinoma (SCC) and adenocarcinoma samples and matched normal tissues were obtained from the frozen tumor bank of the City of Hope Medical Center under an Institutional Review Board approved protocol. Samples were obtained from tumors without laser-capture microdissection. DNA from primary small cell lung cancers and matched normal lung was obtained from Asterand (Detroit, MI), BioChain (Hayward, CA), and Cureline (South San Francisco, CA). Normal human brain tissue DNAs of the prefrontal cortex were obtained from Capital Biosciences (Gaithersburg, MD) and BioChain (Hayward, CA). DNA from neurons and astrocytes of fetal (24 weeks of gestation) human brain was obtained from ScienCell (Carlsbad, CA). Twenty-seven astrocytomas (World Health Organization grade II–III) were obtained on Institutional Review Board approved protocols at the Department of Neurosurgery at the University Hospital in Dresden. DNA was isolated by standard procedures using phenol-chloroform extraction and ethanol precipitation. Eight additional brain tumor DNAs were obtained from Asterand (Detroit, MI). Genomic DNAs from tissues and cell lines were isolated using the DNeasy Tissue Kit (Qiagen; Valencia, CA).
IDH mutations
For sequencing of IDH1 and IDH2 exon 4, 40 ng of genomic DNA was used for PCR amplification using the following primers: for IDH1, the forward primer 5′-TGCCACCAACGACCAAGTCA and the reverse primer 5 ′-CATGCAAAATCACATATTTGCC; for IDH2, the forward primer 5′-TGAAAGATGGCGGCTGCAGT and the reverse primer 5′-GGGGTGAAGACCATTTTGAA.
Simultaneous quantification of 5mdC and 5hmdC by LC-MS/MS
Genomic DNA (1 to 2 μg) was incubated with 5 units of DNA Degradase Plus (Zymo Research; Irvine, CA) at 37°C for at least 2 hours. The stable isotope labeled 5hmdC (21, 22), and labeled 2′-deoxyguanosine (Cambridge Isotope Laboratories; Cambridge, MA) were added as internal standards. Aliquots of the mixture were subjected directly to LC-MS/MS analysis. LC-MS/MS was performed using a Thermo Accela 600 HPLC pump interfaced with a TSQ Vantage triple stage quadruple mass spectrometer (Thermo Fisher Scientific). A 2.1 × 50 mm Kinetex XB-C18 column (2.6 μm in particle size and 100 Å in pore size; Phenomenex; Torrance, CA) was used for separation at a flow rate of 400 μl/min. The TSQ mass spectrometer was optimized and set up in SRM scan mode for monitoring the [M + H]+ ions of 5hmdC (m/z 258.1 → 142.1), 5mdC (m/z 242.1 → 126.1), dG (m/z 268.1 → 152.1), labeled 5hmdC (m/z 261.1 → 144.1) and labeled dG (m/z 273.1 → 157.1). Thermo Xcalibur software version 2.1 was used to perform data analysis.
Immuno dot blot analysis for 5hmC was performed as described previously (14).
Immunohistochemistry
Frozen tissue arrays were from Biochain (catalog No. T6235700-5; lot No. B403109). They contain normal brain tissue and cranionpharyngioma, normal breast and invasive ductal carcinoma, normal colon and adenocarcinoma, normal skeletal muscle and rhabdomyosarcoma, normal kidney and renal cell carcinoma, normal liver and hepatocellular carcinoma, normal lung and SCC, normal pancreas and adenocarcinoma, normal prostate and adenocarcinoma, normal skin and malignant melanoma, normal small intestine and malignant mesenchymoma, normal stomach and adenocarcinoma, normal uterus and adenocarcinoma, and normal ovary and cystadenocarcinoma. The tissue sections were boiled in 10 mM sodium citrate for antigen retrieval followed by blocking with 10% goat serum, 0.1% Triton X-100 in PBS for 1 hour at room temperature (RT). Sections were incubated with primary anti-5hmC polyclonal antibody (dilution 1:1000; Active Motif; Carlsbad, CA) in5% goat serum, 0.01% Triton X-100 in PBS at 4°C, overnight. After washing with PBS at RT, sections were incubated with Rhod Red-X-AffiniPure conjugated goat anti-rabbit secondary antibody (dilution 1:200; Jackson ImmnunoResearch; West Grove, PA) for 1 hour at RT, then washed with PBS and water, and mounted with Fluoromount-G solution (SouthernBiotech; Birmingham, AL). Ki67 staining was performed with Ki67 antibody (BD Pharmingen; San Diego, CA; catalog number 550609; dilution 1:20). The anti-5mC antibody was from Eurogentec (catalog number BI-MECY-0100; dilution 1:200). Slides were counterstained with Hoechst 33258 dye. All florescent images were taken using an inverted Olympus IX 81 fluorescence microscope.
RT-PCR
Quantitative reverse transcriptase PCR was performed as described(23).
Results and Discussion
To determine the levels of 5hmdC and 5mdC in normal and tumor tissues, we developed a sensitive LC-MS/MS assay with isotope-labeled internal standards (Supplementary Fig. 1A). 5mdC was quantitated with reference to the dG standard. Supplementary Fig. 1B shows examples of LC separation and how mass spectrometric analysis of 5hmdC and 5mdC was achieved. The method is strictly quantitative as shown by standard curves (Supplementary Fig. S2). We initially tested its performance by measuring 5hmdC and 5mdC in several cell and tissue DNA samples (Supplementary Fig. S3). The data obtained were consistent with values reported in the literature (2, 4)and were also generally in agreement with a less quantitative immuno dot blot assay (Supplementary Fig. S4).
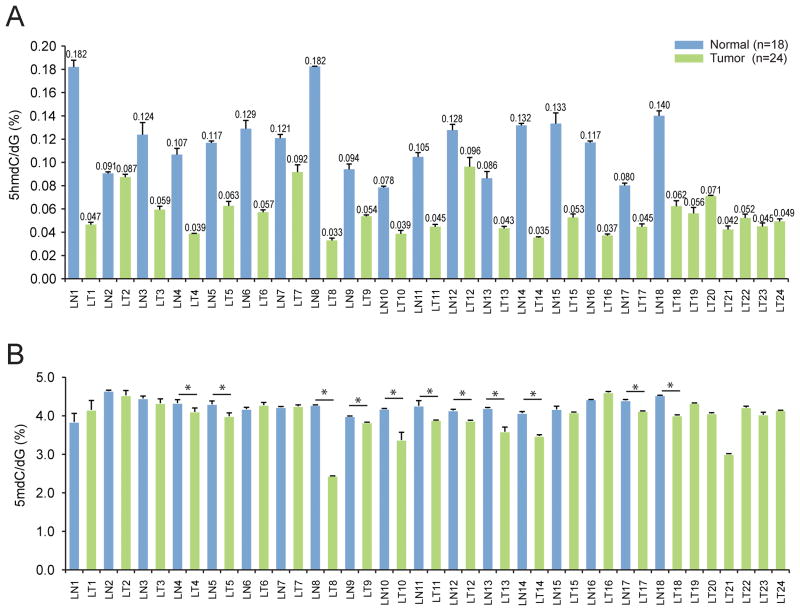
Using the LC-MS/MS assay, we measured 5hmdC in 24 stage-I lung SCC DNAs and in matched normal lung DNA (Fig. 1A). The levels of 5hmdC, expressed as percent of dG, were between 0.078% and 0.182% in normal lung. In every SCC tumor except one (LT2), we saw a significant reduction of 5hmdC level compared to the paired normal lung sample (P < 0.05 for each sample pair; t-test) (Fig. 1A). 5hmdC levels were generally 2–5-fold lower in the tumors compared to normal lung (P = 8.88 × 10⁻⁷; paired t-test). We also quantitated 5mdC (Fig. 1B). 5mdC was depleted in most tumor samples with a few exceptions (tumors 1, 2, 6, 7, 15 and 16). In many cases, 5mdC levels were lower by only ~5–20%(P = 0.023; paired t-test). IDH1 or IDH2 mutations were not found in these lung tumors. We also analyzed 5hmdC in lung adenocarcinomas and primary small cell lung cancers (Supplementary Fig. S5). As with SCC, 5hmdC was depleted in most of these tumors relative to matched normal tissue.
Figure 1. Quantitation of 5hmdC and 5mdC in normal lung and lung squamous cell carcinoma DNA.
A. 5hmdC. The first 18 samples are matched normal lung (LN, blue) and lung tumors (LT, green). The last six samples are lung tumors without available normal tissue. B. 5mdC. The asterisks indicate that the levels of 5mdC were significantly reduced in the tumor compared to normal lung (P < 0.05).
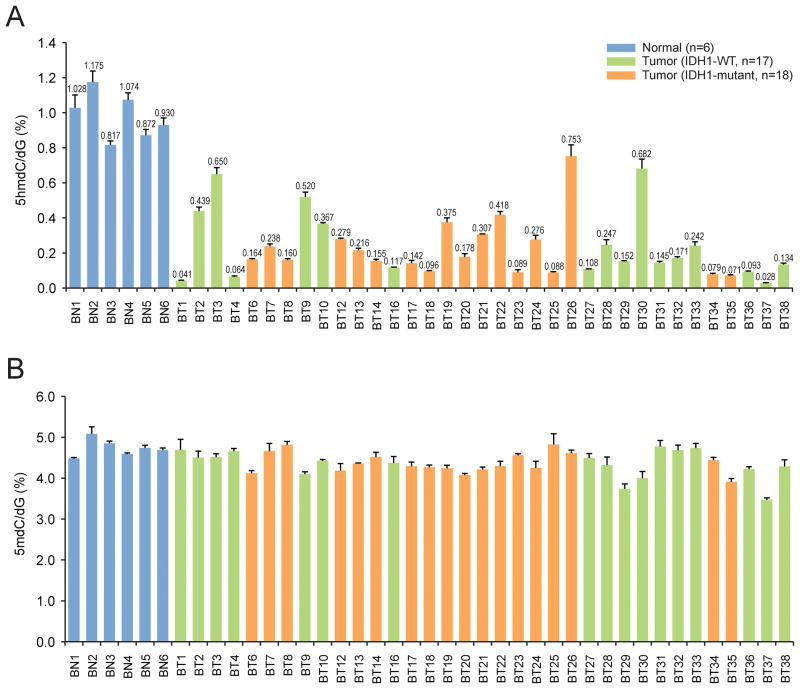
Next, we analyzed the two modified 2′-deoxynucleosides in six normal brain DNA samples and in 33 stage II and III astrocytomas (astrocytic gliomas) and in two glioblastomas. We found high levels of 5hmdC in normal human brain prefrontal cortex DNA (Fig. 2A), in which 5hmdC was between 0.82 and 1.18 percent of dG. We also measured levels of 5hmdC and 5mdC in astrocytes and in neurons from human fetal brain. Levels of 5hmdC were higher (1.45% 5hmdC/dG) in neurons than in astrocytes (0.23% 5hmdC/dG) (Supplementary Fig. S6). In brain tumors, 5hmdC was strongly depleted relative to normal brain (Fig. 2A). Some astrocytomas contained only 0.03–0.04% of 5hmdC, a reduction of >30-fold (P = 1.55 × 10⁻¹¹; unpaired t-test). Since astrocytomas initiate in neural stem cells or glial progenitor cells, their decreased level of 5hmdC may be due to either the malignant state or to the cell of origin of these tumors. The varying levels of 5hmdC in tumors did not correlate with patient age or whether the tumor was stage II or stage III or with patient survival (data not shown). Levels of 5mdC showed only a small reduction in some brain tumors (Fig. 2B) (P = 0.3; unpaired t-test). There was no correlation between levels of 5hmdC and levels of 5mdC. A substantial fraction of stage II and III gliomas contain mutations in IDH1 and much more rarely, in IDH2 (24). We determined the mutation status of IDH1 at codon 132 (Supplementary Fig. S7). We identified 16 stage II/III tumors with the typical codon R132H mutation, and 17 stage II/III tumors without any IDH1 mutation. The R132H IDH1 mutation produces a neomorphic enzyme with the capacity to generate 2-hydroxyglutarate (19). We expected that IDH1 mutant tumors would have lower levels of 5hmdC according to the presumed role of 2-hydroxyglutarate as an inhibitor of TET oxidases (see Supplementary Fig. S8). Surprisingly, however, the levels of 5hmdC were evenly distributed between the low and high ranges, both in IDH1 wildtype and in IDH1 mutant tumors (Fig. 2A; P = 0.53; t-test, non-paired). This finding is in contrast to a previous report, which observed a significant reduction of 5hmC in IDH1-mutant gliomas by immunohistochemistry (20). Similarly, IDH1 mutant and wildtype cases did not show differences in levels of 5mdC (Fig. 2B).
Figure 2. Quantitation of 5hmdC and 5mdC in normal brain DNA and in stage II/III astrocytomas.
A. 5hmdC quantitation in normal brain (NB, blue) and in brain tumors (BT, green or orange). Samples BT1–16, BT25, BT27–29 and BT32–36 were stage III astrocytomas; BT17–24, BT26, BT30 and BT31 were stage II astrocytomas, and BT37 and BT38 were glioblastomas. B. 5mdC in normal brain (NB) and in brain tumors (BT). Tumors with no IDH1 mutation are shown in green; tumors withIDH1 R132H are shown in orange. The sample BT26 had a minor allele frequency of IDH1 R132H. Sample BT25 had the rare mutation R132G.
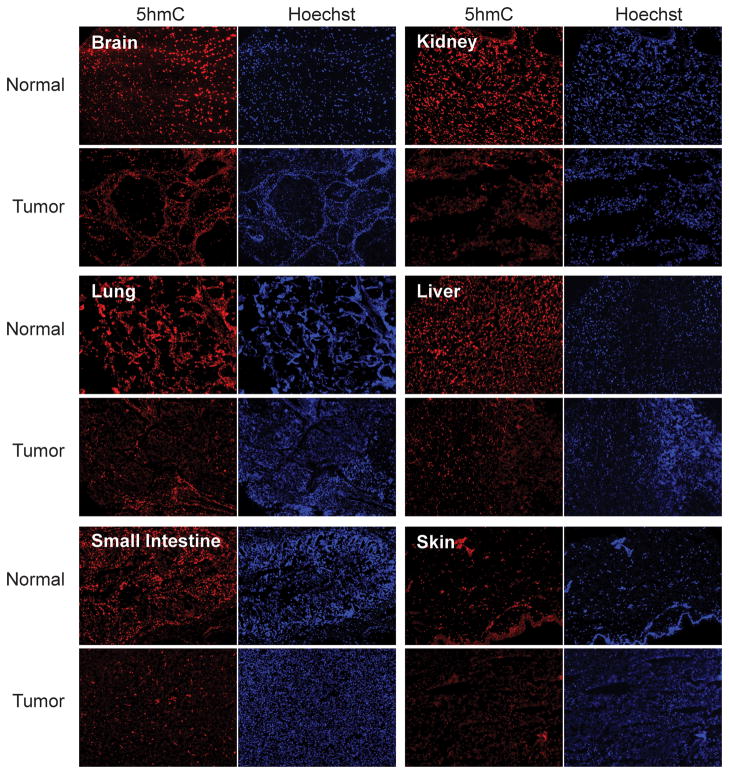
To investigate if loss of 5hmdC is a feature of human cancers in general, we conducted immunohistochemical staining with an anti-5hmC antibody (Fig. 3 and Supplementary Fig. 9). This antibody was verified previously by us and used for detecting 5hmC in early embryos (14, 23). Normal tissue sections and corresponding tumor were stained with this antibody. We observed substantial 5hmdC staining of almost all cells in most normal tissues. However, staining in corresponding tumors was universally decreased with only a few cells (less than 10%) staining positive for 5hmC. The only exception was a tumor originating in the colon (Supplementary Fig. S9). Additional lung tumor slides were also analyzed (Supplementary Fig. S10) including tumor and adjacent normal lung (Supplementary Fig. S10A).
Figure 3. Immunohistochemical analysis of 5hmC on human tissue arrays.
Human tissue arrays containing samples of malignant tumor and corresponding normal tissue were stained with anti-5hmC antibody. Staining with Hoechst 33258 is shown as a control. The magnification of all panels is 10-fold.
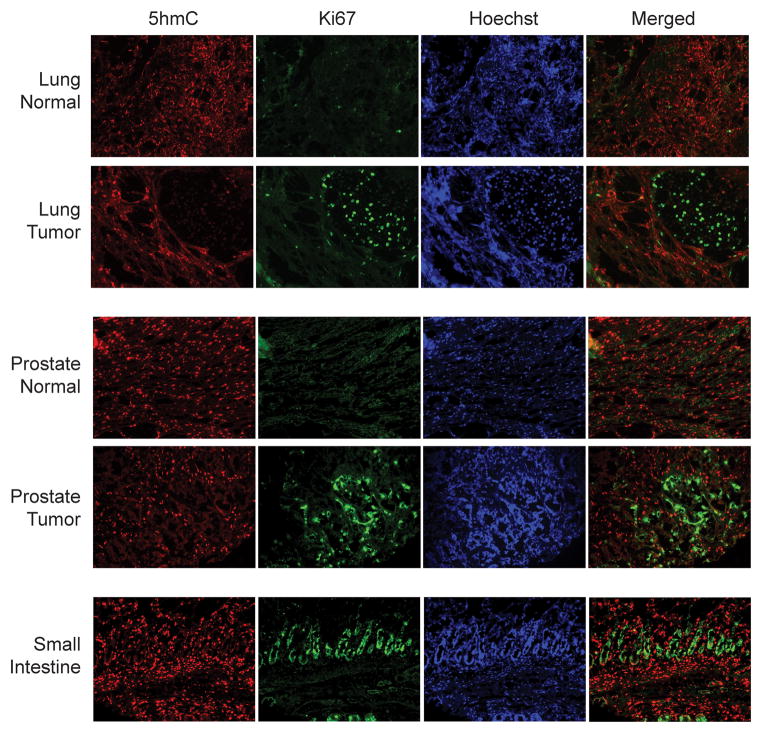
We also did parallel staining of several normal and tumor sections for 5mC using an anti-5mC antibody (Supplementary Fig. S11) and did not observe a substantial decrease of 5mC staining in the tumors. This means that the loss of 5hmdC is not simply due to loss of 5mdC in tumors. We then determined if reduced staining of 5hmdC in tumors is due to increased cell proliferation. We used an anti-Ki67 antibody to stain proliferating cells. Sections of normal brain were almost completely devoid of Ki67 antigen but brain tumors contained many Ki67-positive cells that lacked 5hmC staining (Supplementary Fig. S12). Similarly, there was little Ki67 staining in normal lung, but in adjacent carcinoma tissue, we saw mutually exclusive staining of Ki67 and 5hmC (Fig. 4; Supplementary Fig. S10). The same was found for sections of breast, pancreatic and uterus tumors (Supplementary Fig. S13). Tissue sections of normal small intestine showed strong Ki67 staining for proliferating cells at the bottom of crypts with lack of 5hmC staining, whereas the more differentiated cells contained high levels of 5hmC and lacked Ki67 staining (Fig. 4). Thus, one straightforward explanation for the loss of 5hmdC in tumors is the enhanced rate of cell proliferation in tumors that could lead to a passive loss of 5hmdC, which is not a substrate for DNMT1 (25). We noticed that not all cells that lack 5hmC staining in the tumors are Ki67-positive perhaps due to past history of proliferation leading to permanent loss of 5hmC.
Figure 4. Inverse relationship between 5hmC and Ki67 staining.
Sections of normal lung and lung tumor, normal prostate and prostate tumor and normal small intestine were stained with anti-5hmC (red) and anti-Ki67 antibodies (green) to mark proliferating cells. Note the mutually exclusive staining of 5hmC and Ki67 in the tissue sections. For example, proliferating cells in intestinal crypts are positive for Ki67 but negative for 5hmC.
The inverse link between 5hmC levels and cell proliferation may also reflect intrinsic differences in cell type, as we are comparing differentiated cells with undifferentiated cancer cells that carry stem cell-like properties or originate from somatic stem cells. One other alternative is the possible existence of aberrations in 5hmC production or elimination pathways in tumors. Mutations in TET genes have not been reported in solid tumors. There was no substantial reduction of TET gene expression in lung and brain tumors relative to normal tissue as confirmed by RT-PCR (Supplementary Fig. S14).
The loss of 5hmdC in tumors may have profound effects on DNA methylation patterns. For example, if 5hmC is an intermediate in DNA demethylation, its loss at specific genomic locations may make these sequences more prone to acquire methylation. It will be essential to understand the mechanisms of how 5hmC is lost in tumors. Finally, loss of 5-hydroxymethylcytosine could become a useful molecular biomarker for cancer detection and diagnosis, perhaps in conjunction with Ki67 staining.
Supplementary Material
Acknowledgments
This work was supported by NIH grants CA084469 and AG036041 to G.P.P, NS075393 to Q.L., and CA101864 to Y.W.
References
- 1.Kriaucionis S, Heintz N. The nuclear DNA base 5-hydroxymethylcytosine is present in Purkinje neurons and the brain. Science. 2009;324:929–930. doi: 10.1126/science.1169786. [DOI] [PMC free article] [PubMed] [Google Scholar]
- 2.Tahiliani M, Koh KP, Shen Y, Pastor WA, Bandukwala H, Brudno Y, et al. Conversion of 5-methylcytosine to 5-hydroxymethylcytosine in mammalian DNA by MLL partner TET1. Science. 2009;324:930–935. doi: 10.1126/science.1170116. [DOI] [PMC free article] [PubMed] [Google Scholar]
- 3.Ito S, D’Alessio AC, Taranova OV, Hong K, Sowers LC, Zhang Y. Role of Tet proteins in 5mC to 5hmC conversion, ES-cell self-renewal and inner cell mass specification. Nature. 2010 doi: 10.1038/nature09303. in press. [DOI] [PMC free article] [PubMed] [Google Scholar]
- 4.Globisch D, Munzel M, Muller M, Michalakis S, Wagner M, Koch S, et al. Tissue distribution of 5-hydroxymethylcytosine and search for active demethylation intermediates. PLoS One. 2010;5:e15367. doi: 10.1371/journal.pone.0015367. [DOI] [PMC free article] [PubMed] [Google Scholar]
- 5.Szwagierczak A, Bultmann S, Schmidt CS, Spada F, Leonhardt H. Sensitive enzymatic quantification of 5-hydroxymethylcytosine in genomic DNA. Nucleic Acids Res. 2010;38:e181. doi: 10.1093/nar/gkq684. [DOI] [PMC free article] [PubMed] [Google Scholar]
- 6.Wu SC, Zhang Y. Active DNA demethylation: many roads lead to Rome. Nat Rev Mol Cell Biol. 2010;11:607–620. doi: 10.1038/nrm2950. [DOI] [PMC free article] [PubMed] [Google Scholar]
- 7.Ficz G, Branco MR, Seisenberger S, Santos F, Krueger F, Hore TA, et al. Dynamic regulation of 5-hydroxymethylcytosine in mouse ES cells and during differentiation. Nature. 2011;473:398–402. doi: 10.1038/nature10008. [DOI] [PubMed] [Google Scholar]
- 8.Koh KP, Yabuuchi A, Rao S, Huang Y, Cunniff K, Nardone J, et al. Tet1 and Tet2 regulate 5-hydroxymethylcytosine production and cell lineage specification in mouse embryonic stem cells. Cell Stem Cell. 2011;8:200–213. doi: 10.1016/j.stem.2011.01.008. [DOI] [PMC free article] [PubMed] [Google Scholar]
- 9.Pastor WA, Pape UJ, Huang Y, Henderson HR, Lister R, Ko M, et al. Genome-wide mapping of 5-hydroxymethylcytosine in embryonic stem cells. Nature. 2011;473:394–397. doi: 10.1038/nature10102. [DOI] [PMC free article] [PubMed] [Google Scholar]
- 10.Wu H, D’Alessio AC, Ito S, Wang Z, Cui K, Zhao K, et al. Genome-wide analysis of 5-hydroxymethylcytosine distribution reveals its dual function in transcriptional regulation in mouse embryonic stem cells. Genes Dev. 2011;25:679–684. doi: 10.1101/gad.2036011. [DOI] [PMC free article] [PubMed] [Google Scholar]
- 11.Williams K, Christensen J, Pedersen MT, Johansen JV, Cloos PA, Rappsilber J, et al. TET1 and hydroxymethylcytosine in transcription and DNA methylation fidelity. Nature. 2011;473:343–348. doi: 10.1038/nature10066. [DOI] [PMC free article] [PubMed] [Google Scholar]
- 12.Xu Y, Wu F, Tan L, Kong L, Xiong L, Deng J, et al. Genome-wide regulation of 5hmC, 5mC, and gene expression by Tet1 hydroxylase in mouse embryonic stem cells. Mol Cell. 2011;42:451–464. doi: 10.1016/j.molcel.2011.04.005. [DOI] [PMC free article] [PubMed] [Google Scholar]
- 13.Song CX, Szulwach KE, Fu Y, Dai Q, Yi C, Li X, et al. Selective chemical labeling reveals the genome-wide distribution of 5-hydroxymethylcytosine. Nat Biotechnol. 2011;29:68–72. doi: 10.1038/nbt.1732. [DOI] [PMC free article] [PubMed] [Google Scholar]
- 14.Jin SG, Wu X, Li AX, Pfeifer GP. Genomic mapping of 5-hydroxymethylcytosine in the human brain. Nucleic Acids Res. 2011;39:5015–5024. doi: 10.1093/nar/gkr120. [DOI] [PMC free article] [PubMed] [Google Scholar]
- 15.Delhommeau F, Dupont S, Della Valle V, James C, Trannoy S, Masse A, et al. Mutation in TET2 in myeloid cancers. N Engl J Med. 2009;360:2289–2301. doi: 10.1056/NEJMoa0810069. [DOI] [PubMed] [Google Scholar]
- 16.Ko M, Huang Y, Jankowska AM, Pape UJ, Tahiliani M, Bandukwala HS, et al. Impaired hydroxylation of 5-methylcytosine in myeloid cancers with mutant TET2. Nature. 2010;468:839–843. doi: 10.1038/nature09586. [DOI] [PMC free article] [PubMed] [Google Scholar]
- 17.Figueroa ME, Abdel-Wahab O, Lu C, Ward PS, Patel J, Shih A, et al. Leukemic IDH1 and IDH2 mutations result in a hypermethylation phenotype, disrupt TET2 function, and impair hematopoietic differentiation. Cancer Cell. 2010;18:553–567. doi: 10.1016/j.ccr.2010.11.015. [DOI] [PMC free article] [PubMed] [Google Scholar]
- 18.Noushmehr H, Weisenberger DJ, Diefes K, Phillips HS, Pujara K, Berman BP, et al. Identification of a CpG island methylator phenotype that defines a distinct subgroup of glioma. Cancer Cell. 2010;17:510–522. doi: 10.1016/j.ccr.2010.03.017. [DOI] [PMC free article] [PubMed] [Google Scholar]
- 19.Dang L, White DW, Gross S, Bennett BD, Bittinger MA, Driggers EM, et al. Cancer-associated IDH1 mutations produce 2-hydroxyglutarate. Nature. 2009;462:739–744. doi: 10.1038/nature08617. [DOI] [PMC free article] [PubMed] [Google Scholar]
- 20.Xu W, Yang H, Liu Y, Yang Y, Wang P, Kim SH, et al. Oncometabolite 2-hydroxyglutarate is a competitive inhibitor of alpha-ketoglutarate-dependent dioxygenases. Cancer Cell. 2011;19:17–30. doi: 10.1016/j.ccr.2010.12.014. [DOI] [PMC free article] [PubMed] [Google Scholar]
- 21.Cao H, Wang Y. Collisionally activated dissociation of protonated 2′-deoxycytidine, 2′-deoxyuridine, and their oxidatively damaged derivatives. J Am Soc Mass Spectrom. 2006;17:1335–1341. doi: 10.1016/j.jasms.2006.05.019. [DOI] [PubMed] [Google Scholar]
- 22.LaFrancois CJ, Fujimoto J, Sowers LC. Synthesis and characterization of isotopically enriched pyrimidine deoxynucleoside oxidation damage products. Chem Res Toxicol. 1998;11:75–83. doi: 10.1021/tx970186o. [DOI] [PubMed] [Google Scholar]
- 23.Iqbal K, Jin SG, Pfeifer GP, Szabo PE. Reprogramming of the paternal genome upon fertilization involves genome-wide oxidation of 5-methylcytosine. Proc Natl Acad Sci U S A. 2011;108:3642–3647. doi: 10.1073/pnas.1014033108. [DOI] [PMC free article] [PubMed] [Google Scholar]
- 24.Yan H, Parsons DW, Jin G, McLendon R, Rasheed BA, Yuan W, et al. IDH1 and IDH2 mutations in gliomas. N Engl J Med. 2009;360:765–773. doi: 10.1056/NEJMoa0808710. [DOI] [PMC free article] [PubMed] [Google Scholar]
- 25.Valinluck V, Sowers LC. Endogenous cytosine damage products alter the site selectivity of human DNA maintenance methyltransferase DNMT1. Cancer Res. 2007;67:946–950. doi: 10.1158/0008-5472.CAN-06-3123. [DOI] [PubMed] [Google Scholar]
Associated Data
This section collects any data citations, data availability statements, or supplementary materials included in this article.


