Abstract
Experimental studies have shown that the reactions to external stimuli may appear only few hundreds of milliseconds after the physical interaction of the stimulus with the proper receptor. This behavior suggests that neurons transmit the largest meaningful part of their signal in the first spikes, and than that the spike latency is a good descriptor of the information content in biological neural networks. In this paper this property has been investigated in an artificial sensorial system where a single layer of spiking neurons is trained with the data generated by an artificial olfactory platform based on a large array of chemical sensors. The capability to discriminate between distinct chemicals and mixtures of them was studied with spiking neural networks endowed with and without lateral inhibitions and considering as output feature of the network both the spikes latency and the average firing rate. Results show that the average firing rate of the output spikes sequences shows the best separation among the experienced vapors, however the latency code is able in a shorter time to correctly discriminate all the tested volatile compounds. This behavior is qualitatively similar to those recently found in natural olfaction, and noteworthy it provides practical suggestions to tail the measurement conditions of artificial olfactory systems defining for each specific case a proper measurement time.
Keywords: spike latency, spiking neural networks, artificial olfactory systems, color indicators
Introduction
The processing of signals from sensorial inputs is an important function in all living beings. In most multicellular animals this process is carried out by the nervous system that is formed by a dense network of specialized cells called neurons. Experimentally gained evidences about the functionalities of the nervous system led to the design of mathematical models with the twofold purpose to elucidate the physiological processes and also to artificially reproduce the natural functions. During the years, these models, broadly called artificial neural networks, have progressively extended the similarity with Nature including functions and structures as those became known by physiological investigations. To this regard, neural networks involving spiking neuron units raise the level of biological similarity (Maass, 1997, 1999), incorporating the spatio-temporal computation (Ferster and Spruston, 1995). Although the behavior of individual neurons is well characterized by phenomenological models (Gerstner and Kistler, 2002), it is not yet completely clear how the information is distributed in the spike patterns and which code neurons use to transmit this information. To this end, behavioral studies show that the reaction times of several animals to external stimuli can be surprisingly short (Rieke et al., 1996). Moreover, recent findings evidences that neurons in the cortex can perform very fast analog computations. For example, humans can analyze and identify visual inputs in less than 100 ms. Then, considering that this process involves at least 10–15 synaptic steps from the retina to the temporal hemisphere, less than 10 ms is the remaining time for the neuron processing (Thorpe et al., 1996). These evidences are not compatible with the analysis performed with standard descriptors like firing rate (Michael and Johnson, 2003) but they are compatible with alternative descriptors, such as spike latencies. This does not mean that the rate coding is not used, instead that when fast processing is needed, latency coding schemes are preferred (Maass, 1999). Spike latency is defined as the time interval between the application of the stimulus and the first spike.
The importance of the processing of this feature is found in more brains zones like the visual or auditory area (Heil, 2004; Gollisch and Meister, 2008). The very fast discrimination and recognition of odors shown by several animals to particular stimuli suggests that this feature can play a significant role also in olfaction (Galizia and Menzel, 2000; Uchida and Mainen, 2003). This conjecture is supported by the recent observation that raise the level of biological similarity latency patterns of olfactory glomeruli contain a quantity of information that is sufficient for higher brain centers to identify odors and their concentrations (Junek et al., 2010).
The features of spike encoding attracts also researchers investigating artificial senses as a step toward the implementation of biological computational paradigms.
The studies on artificial senses are rather advanced for “physical” senses such as sight and hearing, while the artificial analog of those senses involving chemistry, such as olfaction and taste, are still rather primitive.
Artificial olfaction stemmed at the end of the eighties from the observation that solid-state gas sensors and olfactory receptors (in amphibians, insects, and mammals) are characterized by a wide receptive field (Sicard and Holley, 1984; Malnic et al., 1999; Hallem et al., 2004). This conjecture evolved in the electronic nose concept that is defined as an ensemble of partially specific chemical sensors complemented by some pattern recognition algorithm (Persaud and Dodds, 1982; Gardner and Bartlett, 1994).
Besides the combinatorial sensitivity of receptors olfaction reveals a complex structure that is supposed to play a relevant part in odor recognition (Firestein, 2001). Olfaction is based on few hundreds of different receptor classes expressed by millions of olfactory neurons organized in the olfactory epithelium at the interface with the external environment. The large redundancy of the epithelium, namely many olfactory neurons carrying the same receptors, is used by the convergence of olfactory neurons signals into structures called glomeruli that are organized in the olfactory bulb. Many experimental evidences support the common opinion that each olfactory neuron expresses only one type of receptor and that each glomerulus receives signals from olfactory neurons carrying the same type of receptor (Imai et al., 2006).
The features of spike encoding attracts also researchers investigating artificial olfaction as a step toward the implementation of biological computational paradigms (Martinelli et al., 2006; Chen et al., 2011). In these works integrate and fire models were optimized with the purpose of increasing odor recognition. A more complex approach was made by Koickal et al. (2007) who implemented in a chip a bio-inspired signal processing of the sensor signals and indicated with simulated data the potential impact of spike latency in odor identification. Noteworthy, all these studies were concerned with arrays of few sensor units (where each sensor actually plays the role of an artificial glomerulus). The discrimination content of the latency coding in natural olfaction is then a very interesting aspect that could also produce remarkable advantages in artificial olfaction. Eventually, the application of this concept could indeed allow reducing the measurement time with a consequent minor exposure of the sensors to the samples and probably a reduced rate of poisoning of the sensor surface. On the other hand, the exploitation of latency requires the use of a sensor system incorporating the main features of the natural olfaction. These are the very large number of individual sensors, the glomeruli layer and the spike encoding and processing of the sensor signals. The difficulties to design and assemble large sensor arrays are brilliantly solved by optical sensors. Several years ago it was demonstrated that an image sensor (such as a CCD camera) could conveniently measure, at once, the optical changes occurring in a large number of fluorescent indicators deposited on the tips in a bundle of optical fibers (Dickinson et al., 1999).
The basic property of an image sensor is the segmentation of a whole scene into a number of elementary units, called pixels. Each pixel corresponds to one photo detector measuring the light intensity shining from a section of the whole scene. Eventually, when an image sensor captures a sensitive surface coated by a continuous layer of chemical indicators, the sensing layer is segmented into a number of elementary units corresponding to the pixels of the image. Then, since it is possible to evaluate the optical properties of single pixels, each pixel of the image may correspond to an individual sensor. To this end, even low-resolution images may result in thousands of independent sensing units, then under the hypotheses that different types of indicators are optically different (this trivially means that each indicator has a different color) it is possible to cluster the camera evaluation of the color of individual pixels in abstract classes each containing pixels carrying the same chemical indicator (Di Natale et al., 2008).
In this paper, a spiking neural network, mimicking the first signal elaboration of the glomerular layer spikes sequences, has been studied with data generated by an artificial olfactory platform based on the principle described above.
The platform is formed by an artificial epithelium composed of a layer of chemical indicators. The concept is illustrated in Figures 1 and 2. The sensing layer is illuminated by a programmable computer screen and imaged by a digital camera (Filippini et al., 2006). Each single pixel composing the image is then considered as an independent sensor characterized by a proper optical set of features given by the chemical reporters spotted on its area (Di Natale et al., 2008). Then, by exploiting their optical signature, the pixels can be unsupervisedly grouped in classes giving rise to an analog of the Olfactory Receptors Neurons–Glomerulus relationship (Korsching, 2002). This platform can then efficiently mimic the dynamics between signals of single receptors and how these are transformed by the convergence into the glomeruli. Hardware development is limited to the receptor units (the color indicators) while glomeruli are a software implementation. Post-glomeruli processing can be easily accomplished via software and results can be strongly connected to the physical and chemical properties of the interaction of volatile compounds with the receptor layer.
Figure 1.
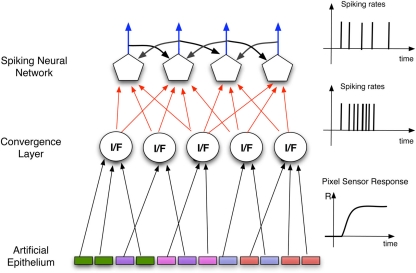
Schematics of the architecture of the Artificial olfactory system. The pixels defining the indicator spots, forming the artificial epithelium, converge, according to their optical signatures to the units of a convergence layer mimicking the role of the olfactory bulb. According to this analogy the units in this layer can be considered as artificial glomeruli. In this layer the average of the signals of the afferent pixels is calculated and then encoded as a spike sequence that is utilized as the input to the processing spiking neural network.
Figure 2.
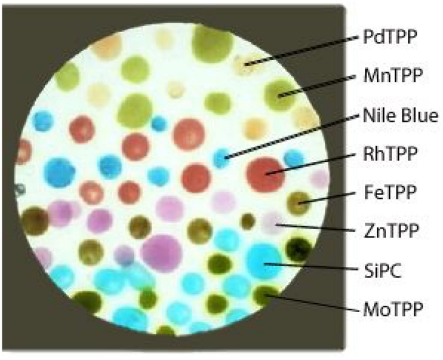
Picture of the artificial epithelium, differently colored spots are the indicators characterized by different hues. The colorless background is coated by the supporting polymer.
In this way, it is possible to define a processing architecture that describes the pixels as artificial olfactory receptor neurons and the convergence classes as a unit, where the mean signals of the afferent artificial olfactory receptor neurons are the output signals of artificial glomeruli. This architecture that preserves many features of its biological counterpart offers also interesting practical advantages such as the largest signal to noise ratio of glomeruli with respect to the signals of individual sensors and a very large tolerance to single sensors fault events.
Glomeruli output signals are encoded into spike sequences and then utilized as input to a spiking neural network. The latency of the first two spikes of the neurons of the spiking neural network has been considered as the network output, and the application of the principal component analysis (PCA) to these quantities revealed the capability of latencies to discriminate between different volatile compounds.
Materials and Methods
A spiking neural network has been applied to process the data produced by the artificial olfactory platform described above. The scheme of the whole system is shown in Figure 3. In order to feed the spiking neural network in a way similar to natural systems, the glomerular units besides to average all the signals from their afferent artificial olfactory neurons (corresponding to the individual pixels of the image sensor) have to encode the analog signals into spikes. The spiking network is formed by a single layer. Each neuron of the network receives the excitatory inputs from the glomeruli and it is contemporaneously inhibited by the two adjacent neurons.
Figure 3.
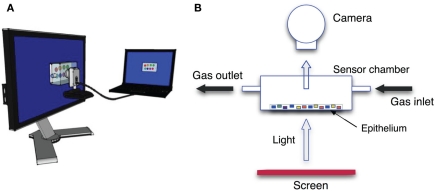
Conceptual scheme of the CSPT setup. (A) Both the screen and the camera are connected to the same computer where all the measurements are controlled and data are recorded. (B) The sensing layer is enclosed in a gas-tight and transparent cell where vapors can be passed. The cell is leaned over the surface of a LCD screen.
Artificial epithelium
The sensing layer was formed by eight molecular indicators. Six of them were metal complexes of the (5,10,15,20-tetraphenylporphyrin), namely (5,10,15,20-tetraphenylporphyrin)palladium [PdTPP], (5,10,15,20-tetraphenylporphyrin)rhodium [RhTPP], (5,10,15,20-tetraphenylporphyrin)zinc [ZnTPP], (5,10,15,20-tetraphenylporphyrin)molybdenum [MoTPP], (5,10,15,20-tetraphenylporphyrin)iron [FeTPP], (5,10,15,20-tetraphenylporphyrin)manganese [MnTPP], a Silicon (phthalocyanine) [SiPC], and finally a pH indicator known as Nile Blue (NB). The sensing molecules were dispersed in a membrane based on plasticized poly(vinyl chloride) (PVC; membrane composition in weight: 33% PVC, 66% bisethylhexyl sebacate and 1% indicator). The sensing layer was prepared onto a 25-mm diameter transparent substrate, a Thermanox plastic coverslip provided by Nunc. The polymer membrane was at first casted onto the coverslip to fully coat the surface. Then each indicator-polymer membrane was randomly spotted in several replicas, in a number variable from 6 to 11, above the polymeric coating, to obtain the appearance shown in Figure 2. The polymer layer has the main function to support the sensing molecules avoiding the formation of indicator aggregations, maintaining the molecules in a semi-solvent condition.
Measurement setup
Absorbance properties of the sensing spots were measured according to the computer screen photo-assisted technique (CSPT) where a computer screen is used as light source and a digital camera is used as a detector (Filippini et al., 2003). It was shown that such an arrangement, even if based on low-cost components, has enough sensitivity to capture the changes of the optical properties occurring in layers of metalloporphyrins when these are exposed to volatile compounds (Filippini et al., 2006) with a sensitivity comparable with that exhibited by solid-state sensors such as quartz microbalances (Di Natale et al., 2010). Experiments were carried out with a computer screen (Philips 170S4) and a webcam (Philips SPC650NC/97). The camera was operated at a resolution of 160 × 120 pixels, the signal intensities were given in camera units according to the 8-bit analog to digital conversion of the light intensity embedded in the camera driver. The arrangement of the experimental setup is shown in Figure 3. The plastic substrate was placed in a sealed cell with transparent windows in order to be probed by light. Organic vapors diluted in a nitrogen flow were passed through the cell. The tested volatile organic compounds (VOCs) were two alcohols (ethanol and butanol) and three amines (trimethylamine, triethylamine, and butylamine). Mixtures of ethanol and butanol, trimethylamine and triethylamine, and trimethylamine and ethanol have also been tested. Besides trimethylamine, all compounds are liquid at standard pressure and temperature, then the gas samples were obtained diluting the saturated pressure at room temperature in a pure nitrogen gas flow. Mass flow controllers regulated the dilution factor and the total flow during the measurements. The same dilution factor (5%) was applied for all the compounds, due to the different phase change parameters, the concentration of the different compounds covered an interval from 1100 ppm for butylamine to 9000 ppm for ethanol. Trimethylamine was measured from a certified bottle where it was diluted in pure nitrogen gas at the concentration of 500 ppm. Each vapor was measured in triplicate. For each vapor the sensing layer was exposed for 400 s and then kept 1100 s under pure nitrogen gas flow to purge the indicators and to restore the initial conditions.
These compounds are moderate Lewis acids and bases that are known to elicit color change in porphyrins and acid-base indicators. The opposite behavior of amines and alcohols provides a significant test where the straightforward discrimination of amines from alcohols is complemented by the recognition of the subtle differences between compounds inside each family. Binary mixtures were also tested to study the interference of compounds belonging to the same family or to different families. In order to evaluate also the reproducibility of the sensor system each vapor and mixture was measured in triplicate.
The reaction to gas was probed with a pure green light illumination. As known from previous investigations, the wavelengths contained in this color are suitable to appreciate the spectral changes occurring in all the indicators. Hence the sensing layer was illuminated with a pure green light, obtained with the RGB code: [0 255 0]. As a consequence, the intensity of the camera green channel of each pixel was the sensors output signal. During the exposure to gas, the camera took a still image each 5 s.
Glomeruli layer definition and analog-to-spiking conversion
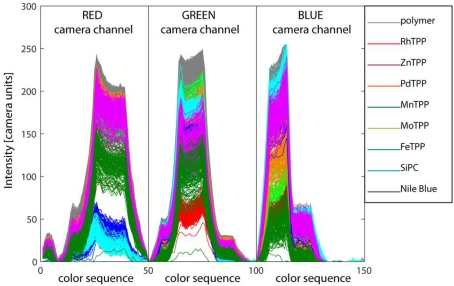
As previously mentioned, CSPT gives the opportunity to introduce an elegant and simple methodology to reproduce the connection between the olfactory receptors and the glomeruli. Under the hypothesis that the indicators are characterized by different colors, it is possible comparing the color measured in each pixel to assign pixels to classes whose elements are pixels carrying similar indicators. In this way, the physical pixels are the artificial olfactory neurons and the abstract classes are the olfactory glomeruli. CSPT offers a powerful method for color measuring, it is based on the formation of a fingerprint obtained exposing the sample to a set of colors achieved blending the RGB values regulating the LCD screen color, and measuring the resulting appearance of the sample in the three channels (red, green, and blue) of the digital camera. This method was demonstrated to be able to discriminate between subtle color changes in colorimetric tests (Filippini and Lundström, 2006). For the scope of glomeruli definition the sensing layer was illuminated by the computer screen programmed to display a rainbow of 50 colors from purple to red. The layer was imaged by the webcam encoding the color in an 8-bit scale separated in the red, green, and blue channels. The signals from the red, green, and blue channels were concatenated, in this order, to form a fingerprint vector. As a result, the color of pixels was encoded in a fingerprint vector composed by 50 illumination colors × 3 camera color channels. Figure 4 shows the collected fingerprints. In the ideal case of a perfectly homogeneous distribution of the indicators and a uniform screen illumination, only nine different fingerprints (corresponding to the eight indicators and the polymer substrate) should be visible in Figure 4. Actually, the fingerprints are almost continuously distributed evidencing a high level of non-homogeneity in sensing spot formation. The clustering of the fingerprints of Figure 4 is in principle a straightforward supervised operation. Indeed, the position of each spot is known and indicators can be easily identified by their color. However, it is interesting to incorporate in the artificial platform architecture an automatic procedure clustering together pixels imaging the same kind of indicators. This gives rise to an elegant mimic of natural olfactory neurons where pixels are the olfactory neurons, and the indicators are the olfactory receptor. The receptor itself provides both the chemical sensitivity and the criteria to the convergence to the relevant glomeruli. The efficiency of CSPT to capture colors allows using automatic clustering with a negligible amount of misclassifications. From a biomimetic point of view, clustering of similar pixels provides the same class membership disregarding the arrangement of spots, i.e., the distribution of a given type of olfactory receptor neurons in the epithelium. From a practical point of view this allows for instance a prompt replacement of the artificial epithelium and even a simple communication of signals between different sensing units (Polese et al., 2011).
Figure 4.
Computer screen photo-assisted technique fingerprints of all the pixels imaged in Figure 2. The fingerprints are formed concatenating the red, green, and blue channels levels read by the camera under the exposure to a rainbow of 50 colors from purple to pure red. The fingerprints are differently colored according to the indicator imaged in the corresponding pixel. Straightforwardly, the largest signals are obtained for the pixels were the pure supporting polymer is imaged.
The fingerprints of Figure 4 can be conveniently clustered into an arbitrary number of classes by means of any unsupervised classification algorithm. Here a simple K-nearest neighbor (KNN) algorithm has been chosen (Duda et al., 2000). According to the practical implementation of the artificial epithelium, shown in Figure 2, the indicators cover only a portion of the sensing layer. The rest of the area is coated with the supporting polymer and its color is clearly different from the color of the indicators, this is quite visible in Figure 2 where the polymer-coated pixels are clearly separated from the dyed pixels. In order to limit the analysis to the pixels carrying information about the indicators, the polymer-coated pixels were segregated applying a two classes KNN classifier. Here the obvious choice of two classes was made possible by the straightforward difference between the fingerprints of dyed and non-dyed pixels. However, the number of classes is a free parameter of unsupervised classifiers, and the number of classes has to be chosen according to the specific conditions of each application. In this case, the number of classes can be chosen in order to abide the biological paradigm according to which in a single glomerulus only olfactory neurons expressing the same receptor converge. This means that in the artificial system the classes defined by KNN have to contain only pixels carrying the same (or very similar) indicators. In order to fulfill this requirement, a number of classes greater than the actual number of indicators is necessary and here, 13 classes have been considered. This number, empirically chosen, is large enough to avoid misclassifications, and at the same time, it is sufficiently small to guarantee that each class collects a sufficient number of artificial olfactory neurons adequate to provide, through the signal averaging, a significant increase of the signal to noise ratio. Besides averaging the incoming pixel signals, glomeruli are requested to encode the signal into spikes in order to be processed by the spiking neural network. Here, an “integrate and fire” (I/F) algorithm was used (Gerstner and Kistler, 2002). The algorithm is conveniently described by the equivalent electronic circuit shown in Figure 5. The inter-spike time is determined by the magnitude of the analog input signal and the circuit time constant, that is given by the product of the two algorithm parameters: R and C, according to the following equation:
Figure 5.
The I/F algorithm implemented in the glomeruli units is represented through its electronic equivalent circuit. The average signal of the pixels pertaining to the glomerulus is represented by the input current i(t) and the output voltage is the encoded spiking sequence. Circuit elements, including the operational amplifier, are ideal and their values are internal parameters of the algorithm.
| (1) |
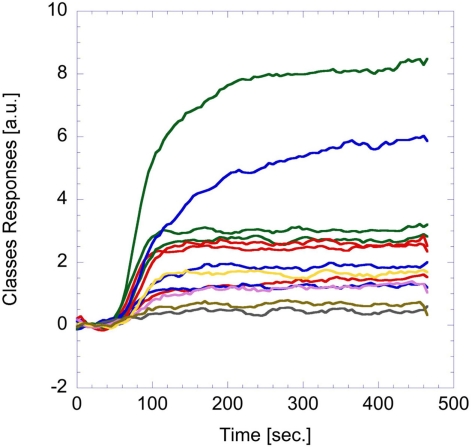
I(t) is the input signal and u(t), the voltage across the capacitance. The circuit generates a spike anytime the voltage u(t) reaches the threshold value (Vthreshold in Figure 5). The critical parameter of the algorithm is the time constant that is defined as the product of R and C in the analog equivalent circuit. This value has been empirically fixed to 21.3 s to obtain a sufficiently large number of spikes from the glomeruli signals. The same parameters were applied for all the glomeruli. Figure 6 shows a typical analog glomeruli signal emerging as a consequence of the exposure of the artificial epithelium to a vapor. To obtain only to the contribution of the effect of the gas, the glomeruli signals value recorded immediately before the exposure to gas was subtracted from the recorded signal. The difference signals were then converted into spike sequences and processed by the spiking neural network, according to the procedure outlined in Figure 1.
Figure 6.
Example of analog glomeruli signals. These signals were caused by the exposure to trimethylamine vapors (about 500 ppm in nitrogen).
It is important to note that the signals can be either positive or negative indicating that the interaction of the indicator with the volatile compound elicits different changes in the optical spectrum of the indicator including a change of magnitude and a shift of the optical features. A combination of these changes with the spectral response of the camera green channel and the green light spectra of the LCD screen may then result in positive or negative changes of the camera signal. In a few cases a negative change of the intensities in the green camera channel was observed and only for one of the glomeruli. According to Eq. 1, a negative analog signal does not cause a spike train. The glomerulus exhibiting negative signals was therefore not a part of the further processing in the spiking network. Actually also other sensors can present signals that can be either positive or negative, this is the case, for instance, of the metal-oxide semiconductor gas sensors used in a previous study (Chen et al., 2011).
The spiking neural network
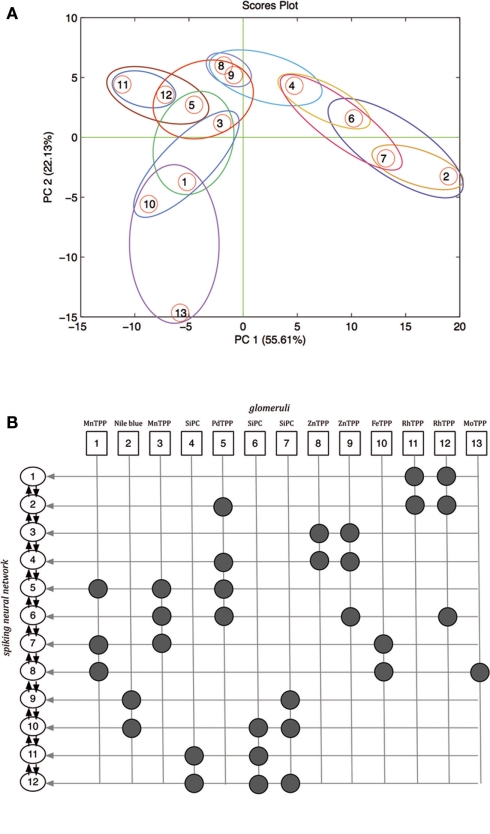
The spiking neural network used to process the artificial olfaction data was composed by neurons arranged in a single layer as shown in Figure 1. The neurons were defined according to a phenomenological neuron model (Gerstner and Kistler, 2002) and they were endowed of both excitatory (from the glomeruli) and inhibitory (from the other network neurons) inputs. As a consequence the relative position of the neurons in the network architecture and the inputs distribution into the various neuron units are important. Since, the glomeruli have been defined above as structure-less abstract entities it is necessary to introduce an ordering criteria. As illustrated in Section “Glomeruli layer definition and analog-to-spiking conversion” the color of the indicators is an optimal quantity to identify the indicators in the array, and the glomeruli have been simply defined applying the KNN algorithm to the CSPT fingerprints. Here, the same quantity is further used to define the interface between the glomeruli units and the spiking neural network. Each glomerulus is defined by its KNN centroid vector, roughly corresponding to the average of the CSPT fingerprints. The connection between glomeruli and neural network neurons has been based on a hierarchical clustering of the centroid fingerprint vectors. The outcome of the process is illustrated in Figure 7A where the 13 centroid fingerprints are shown in the plane of the first two principal components of the PCA calculated on the centroid fingerprints matrix. In figure the mapping between the glomeruli and the neural network neurons is also visible. All the glomeruli signals contribute to their relevant neuron with an excitatory input. The number of network neurons has been fixed to 12. With this number of neurons the excitatory inputs are between 2 and 4 for each neuron. In Figure 7B the relationship between the chemical indicators, the glomeruli, and the neural network neurons is shown. In this figure the neurons are ordered according to a hierarchical clustering criteria visible in Figure 7A. This order is important because each neuron receives inhibitory inputs from the first neighbors in the list shown in Figure 7B. Finally it is worth the remark that since the chemical sensitivity of the indicator and its color are not correlated, no chemotopic feature is expected to be found in the neural network structure. According to the phenomenological neuron model, the neuron state is controlled by the action potential (AP):
Figure 7.
(A) Scores plot of the first two principal components of the PCA of the matrix of the centroid fingerprints as defined by the application of the KNN to the fingerprints matrix. Closed regions show the membership of glomeruli to the network neurons. (B) Relationship between chemical indicators, glomeruli, and neural network neurons excitatory inputs. Glomeruli signals contribute as excitatory inputs to the spiking neural network neurons. The arrows between the network neurons indicate the inhibitory signals.
where H(t–tm) is the Heaviside function. When a pre-synaptic spike occurs at the time t = tn, it produces an AP variation proportional to the kernel function through the pre-synaptic weight (wij). Once the AP reaches the threshold (θ) at the time t = tm the neuron fires and the AP is reset to zero by the refractory function. The expression of the learning, the kernel and the refractory functions are shown in Table 1. The excitatory weights are trained with a Hebbian learning rule where the change, δw in the upgrade coefficient, w, observes the following equation:
Table 1.
List of the functions describing the phenomenological neuron model used in the spiking neural network.
| Learning function | if Δ t ≤ 0 | |
| f Δ t>0 | ||
| Kernel function | ||
| Refractory function | −ϑ exp(−tr/τ) |
The different τ’s appearing in the definitions are time constants, A± are constant parameters and θ is the neuron threshold.
| (3) |
where win is the discrete increment of the input weight corresponding to one input spike, wout is the discrete decrement of the input weight corresponding to one output spike, and w(t0–ti) is the learning function, ti and t0 are the input and output firing time and η is the learning rate.
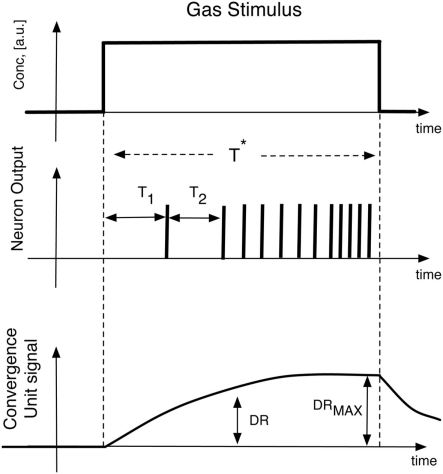
The initial values of the synaptic weights of the excitatory input are randomly generated in the range (0, 1) and the APs were initially set to zero. For the inhibitory connections, two configurations of synaptic coefficients have been considered in the analysis. In the first configuration, the coefficients have been randomly generated in the range (−3, −0.5) and in the second case the contribution of the inhibition has been removed setting all the inhibitory synaptic weights to zero. In both cases these coefficients have been maintained constant during the following network training. The neural network was unsupervisedly trained presenting 100 times, in a randomized order, the spiking sequences encoding the artificial glomerular responses to the tested vapors. In order to evaluate the performance of the complete artificial olfactory system (composed by the physical layer of receptors, the abstract glomeruli layer, and the spiking neural network) to discriminate the tested volatile compounds, the output of the network have been described by two features describing the short time response and the long time response of to the applied stimulus, respectively. The short time response is considered by the latencies of the first two spikes of each neuron, while the long time response is explained by the neurons firing rate averaged in the time window corresponding to the application of the stimulus. To study the contribution of the spiking neural network to the overall discrimination capabilities of the whole olfactory system, two additional features describing the glomeruli signals have also been considered. Also in this case a short time and a long time response have been examined. The first feature was calculated as the analog glomeruli signals at the time when the slowest neuron of the spiking network fires its second spike, while the long time response is simply the maximum signal showed by glomeruli during the stimuli application. Figure 8 illustrates the definition of these features. In correspondence to the exposure to each volatile compound and for each feature, a vector composed by the ordered sequence of features was arranged. The whole set of experiment resulted then in matrices whose elements were the above illustrated features. The matrices were then analyzed with (PCA; Joliiffee, 2002). The main advantage of PCA, in this case, is the possibility to plot in the principal components plane the multidimensional datasets, in this way a simple and effective evaluation of the discrimination capability of each feature can immediately be obtained by a simple visual inspection of the plots.
Figure 8.
Illustration of the features used to describe both the spiking neural network and the glomeruli layer response to vapors. The time at which DR is calculated corresponds to the time when the slowest neuron fires its second spike. The average firing rate is calculated in the time interval T*.
Results and Discussion
It is important to remark that this paper does not intend to provide a faithful replica of the olfactory circuits but rather it is centered on the study of the information content of the spiking sequence and in particular of the spikes latency coding. Then the complexity of the network was kept as low as possible adopting an architecture with a single layer of spiking neurons. Two different topologies characterized by the presence and the absence of lateral inhibitions were taken into consideration. The object of the paper was the investigation of the vapor recognition properties of the spike latency. The latency time of the first spike indicated a limited gas discrimination while a significant improvement was obtained considering as the measurement descriptor the latency times of the first two spikes fired by each neuron of the network (i.e., T1 and T2 in Figure 8). All glomeruli generates their first two spikes in less than 120 s providing about 65% of reduction of measuring time with respect to the standard measurement protocol where the end of measure occurs when the analog signals reach their steady-state values.
The ensemble of the latency times were joined to form a vector and the matrix collecting the whole experiment was processed by PCA.
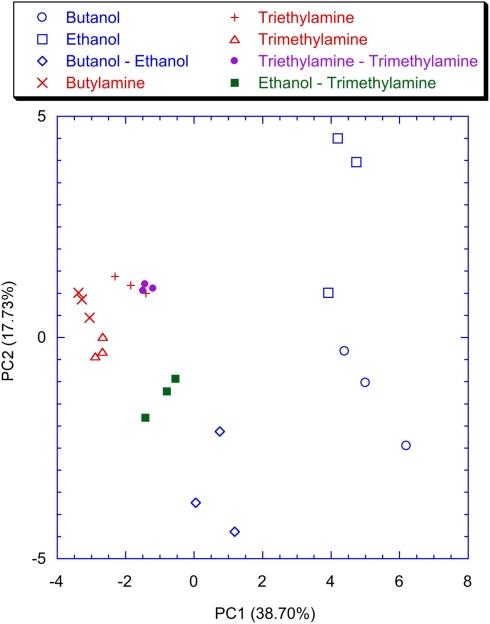
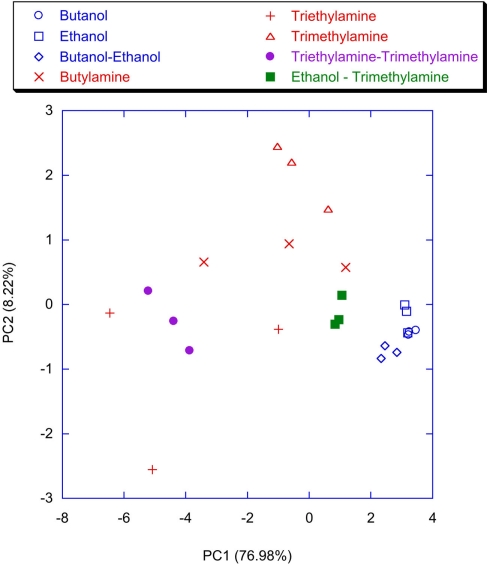
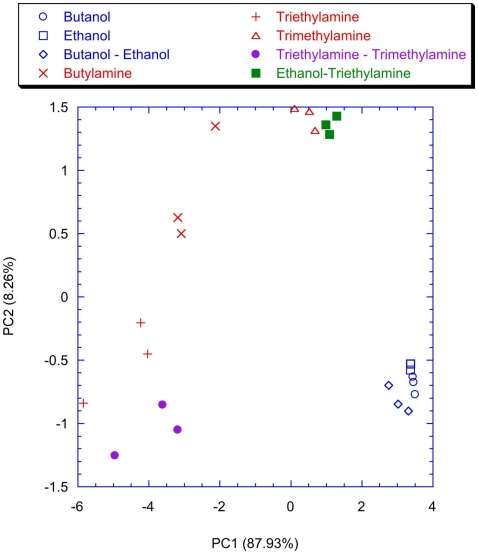
Figure 9 shows the plot of the first two principal components of the latency feature of the spiking neural network trained with the lateral inhibition. All the VOCs are discriminated and only a little overlap between Triethylamine and Triethylamine–Trimethylamine mixture is present. This is expected because of the chemical similarity between these compounds. The presence of the lateral inhibition increasing the differences among the neurons distributes the information carried by the glomeruli into the network neurons. As a partial proof, it was observed that without inhibition (Figure 10) the discrimination performance was reduced to the basic, and somewhat chemically straightforward, separation between alcohols and amines. Furthermore, if a certain separation among alcohols can actually be observed the amines are completely overlapped in Figure 10. This result is somewhat unexpected because the response of the individual receptors to amines is much larger with than to alcohols. This suggests that the absence of inhibition makes the network unable to capture the differences among different gases when a large response is obtained for the chemical indicators. It is interesting to note that a larger analog signal corresponds to an increase of the spike rate from the convergence layer. The saturation effect could only be related to the frequency response of the network and the I/F algorithm. It could probably be avoided by a careful choice of the parameters. Nonetheless it is interesting to observe that inhibition prevents the occurrence of the saturation effects maintaining unaltered the olfactory system properties in the whole range of signals even for a non-optimized choice of parameters.
Figure 9.
Scores plot of the first two principal components of the PCA of the matrix of latencies of the first two spikes of each neuron of the network trained with the lateral inhibition. Labels indicate the measured vapors.
Figure 10.
Scores plot of the first two principal components of the PCA of the matrix of latencies of the first two spikes of the neurons of the network trained without the lateral inhibition. Labels indicate the measured vapors.
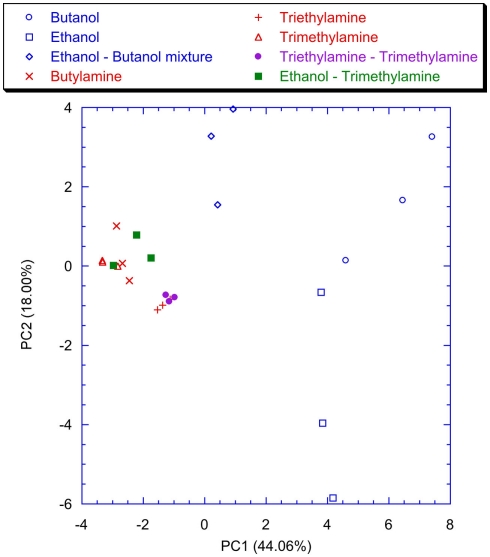
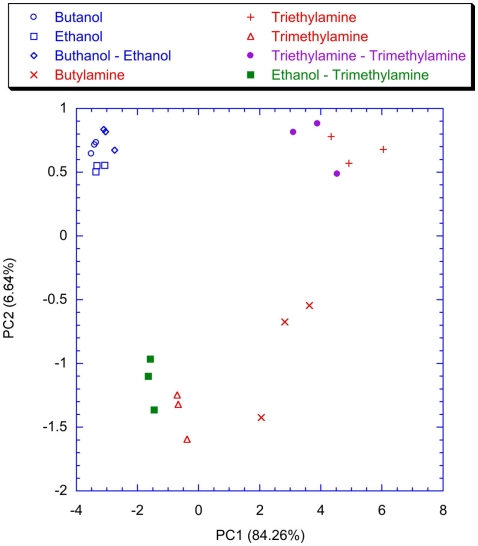
To point out the contribution of the spiking neural network, the classification properties of the analog glomeruli signals was considered. In Figure 11 the plot of the first two principal components of the PCA of the matrix of the glomeruli analog signals is shown. To consider the short time response, the glomeruli signal was considered at the time when the slowest neuron of the spiking neural network, trained with lateral inhibition, fires its second spike. According to Figure 11 the discrimination of volatile compounds appears worse with respect to that obtained with the spike latencies of the network with inhibition. Another interesting detail to note is that the explained variance of the first two principal components of the PCA of the latencies matrices (Figures 9 and 10) are significantly less with respect to the first two principal components of the PCA of the matrix collecting the analog glomeruli signals (Figure 11). This result indicates that the spiking network performs a faster separation of the different sources of information; furthermore, in presence of lateral inhibition the differences among neurons responses are more prominent and then the signal decorrelation becomes more evident. However, in the experiment described here the contribution to the classification of the principal components of order higher than two is negligible. It is also important to note that for the network with inhibition, the odor recognition property does not change significantly considering further latencies related to spikes beyond the second spike (data not shown). The classification improves but not dramatically when the average firing rate is considered (see Figure 12). These results are qualitatively similar to that obtained using the maximum glomerular signal (see Figure 13) suggesting that when the sensors reach the dynamic equilibrium with the gas, the classification is completely explained in the input data and the contribution of the network processing becomes negligible. It is interesting to note that for the average firing rate the variance explained by the first two principal components is more than 95% confirming the large correlation of the neurons firing rates. This result also suggests that the lateral inhibition mainly influences the distribution of the information content carried by the neuron in the initial part of the signal while in the last part its contribution is related to a sort of a scale factor of the glomeruli signals. As further confirmation of this hypothesis, no decrease of performance is observed removing the inhibition using the firing rate as the input (data not shown). This result leads to believe that the lateral inhibition, in this network structure, affects significantly only the information contained in the initial part of the spike sequences. In order to show the importance of the initial part of the response, the network was also trained stopping the learning procedure immediately after the second spike of the slowest neuron is fired. Surprisingly, the results of the PCA calculated with the latencies of the first two spikes and the firing rate are qualitatively similar. This result indicates that the very initial part of the response is of outmost importance and then only this portion of the response could be used in reducing dramatically the computational and the experimental time. Noteworthy, the length of the initial part is dynamically determined by the network as the time necessary to get two spikes from all the neurons and then this time can be variable according to the magnitude and the dynamics of the receptor responses. Ultimately, for a given set of receptors this time depends on the kind of vapor. The reduction of measurement time using only the first portion of sensor response was attempted in the past as by using the dynamic properties of sensors (Davide et al., 1995; Di Natale et al., 1995; Eklöv et al., 1997; Nakamoto et al., 1997; Gutierrez-Osuna et al., 1999; Muezzinoglu et al., 2009). In these studies the measurement time was generally determined according to a previous knowledge about the dynamics of the sensors. In the present case the duration of the measurement is determined by the network processing the global set of receptors hierarchically arranged in glomeruli-like structures and the length of time necessary for a single measurement is variable for each sample but always less than 35% of the time necessary for the analog signal to reach the steady-state. It is important to remark that the dynamic responses of the chemical reporters in the sensing layer are also affected by their spatial arrangement with respect to the inlet and the outlet of the cell where the sensor layer is accommodated. As a consequence, also the latency pattern of the network is dependent by the position of the chemical indicators giving a further degree of freedom for the system design and optimization. Furthermore, considering that the indicators are immersed in a supporting polymer layer, the latency pattern depends also on the diffusion of volatile compounds through the polymer. This feature was demonstrated to lead to a sort of artificial olfactory mucosa (Dini et al., 2009) mimicking the separation of volatile compounds characterized by different alkyl chain lengths and steric effects (Kent et al., 1996). The possibility to use the latency as features for discrimination tasks can open a different approach to chemical sensing. Actually exploiting these descriptors it would be possible to define the gas exposure as the time necessary to obtain the occurrence of the first spikes at the network output. This strategy would offer some interesting aspects. The first is related to the measurement time that it should be not fixed but it should adapt itself on the gas under measure. Moreover this approach should guarantee a short measurement time with respect to the standard protocol counteracting the aging and poisoning of the devices that is probably the main cause of the chemical sensor drift (Martinelli et al., 2011). It is important to remark, that these results have been derived from an experiment aimed at measuring a limited set of volatile compounds. However, since the test compounds (amines and alcohols) are good representative of donor and acceptor molecules, they elicit a sufficiently range of responses. The findings here outlined may substantially be corroborated by more extensive measurements with a larger number of repetitions to study the relationship between the network property and the sensors reproducibility.
Figure 11.
Scores plot of the first two principal components of the PCA of the matrix of the analog signals of the glomeruli evaluated at the time when the slowest neuron fires the second spike. The network was trained with the lateral inhibition and for each measure presentation, the coefficient updating procedure was stopped when the slowest neuron fires the second spike. Labels indicate the measured vapors.
Figure 12.
Scores plot of the first two principal components of the PCA of the matrix of the average firing rate of the neurons of the network trained with the lateral inhibition. Labels indicate the measured vapors.
Figure 13.
Scores plot of the first two principal components of the PCA calculated on the matrix of the maximum analog signals of the glomeruli. Labels indicate the measured vapors.
Conclusion
An artificial olfactory system based on a large array of opto-chemical sensors coupled with a bio-inspired signal processing architecture is shown. The processing strategy took into consideration a convergence layer that mimics the role of glomeruli and encodes the signals of the sensors into sequences of spikes to be processed by a spiking neural network. The aim of this work was to investigate the possibility to use the spike latency of the network outputs as a useful descriptor for the odor recognition. The results show that the first two spikes of neural network neurons contain enough information to discriminate the different vapors confirming the experimental evidences obtained on animals. It has also been put in evidence the fundamental role of the lateral inhibition in the information processing of the very initial part of sensor signals and how it is possible to exploit the characteristics of the latency coding to define an adaptive gas exposure strategy.
Conflict of Interest Statement
The authors declare that the research was conducted in the absence of any commercial or financial relationships that could be construed as a potential conflict of interest.
References
- Chen H. T., Ng K. T., Bermak A., Law M. K., Martinez D. (2011). Spike latency coding in biologically inspired microelectronic nose. IEEE Trans. Biomed. Circuits Syst. 5, 160–168 10.1109/TBCAS.2010.2075928 [DOI] [PubMed] [Google Scholar]
- Davide F., Di Natale C., D’Amico A., Hierlemann A., Mitrovics J., Schweizer M., Weimar U., Göpel W., Marco S., Pardo A. (1995). Dynamic calibration of QMB polymer-coated sensors by Wiener kernel estimation. Sens. Actuators B Chem. 27, 275–285 10.1016/0925-4005(94)01601-D [DOI] [Google Scholar]
- Di Natale C., Marco S., Davide F., D’Amico A. (1995). Sensor array calibration time reduction by dynamic modeling. Sens. Actuators B Chem. 24, 578–583 10.1016/0925-4005(95)85126-7 [DOI] [Google Scholar]
- Di Natale C., Martinelli E., Paolesse R., D’Amico A., Filippini D., Lundström I. (2008). An experimental biomimetic platform for artificial olfaction. PLoS ONE 3, e3139. 10.1371/journal.pone.0003139 [DOI] [PMC free article] [PubMed] [Google Scholar]
- Di Natale C., Santonico M., Paolesse R., Filippini D., D’Amico A., Lundstrom I. (2010). Evaluation of the performance of sensors based on optical imaging of a chemically sensitive layer. Anal. Bioanal. Chem. 397, 613–621 10.1007/s00216-010-3607-x [DOI] [PubMed] [Google Scholar]
- Dickinson T., Michael K., Kauer J., Walt D. (1999). Convergent self encoded bead sensor arrays in the design of an artificial nose. Anal. Chem. 71, 2192–2198 10.1021/ac981457i [DOI] [PubMed] [Google Scholar]
- Dini F., Martinelli E., Pomarico G., Paolesse R., Monti D., Filippini D., D’Amico A., Lundstrom I., Di Natale C. (2009). Chemical sensitivity of self-assembled porphyrin nano-aggregates. Nanotechnology 20, 055502. 10.1088/0957-4484/20/5/055502 [DOI] [PubMed] [Google Scholar]
- Duda R., Hart P., Stork D. (2000). Pattern Classification. New York: John Wiley and Sons [Google Scholar]
- Eklöv T., Mårtensson P., Lundström I. (1997). Enhanced selectivity of MOSFET gas sensors by systematical analysis of transient parameters. Anal. Chim. Acta 353, 291–300 10.1016/S0003-2670(97)87788-4 [DOI] [Google Scholar]
- Ferster D., Spruston N. (1995). Cracking the neuronal code. Science 270, 756–757 10.1126/science.270.5237.756 [DOI] [PubMed] [Google Scholar]
- Filippini D., Alimelli A., Di Natale C., Paolesse R., D’Amico A., Lundstrom I. (2006). Chemical sensing with familiar devices. Angew. Chem. Int. Ed. Engl. 45, 3800–3803 10.1002/anie.200600050 [DOI] [PubMed] [Google Scholar]
- Filippini D., Lundström I. (2006). Preferential color substances and optimized illuminations for computer screen photo-assisted classification. Anal. Chim. Acta 557, 240–241 10.1016/j.aca.2005.10.028 [DOI] [Google Scholar]
- Filippini D., Svensson X., Lundstrom I. (2003). Computer screen as a programmable light source for visible absorption characterization of (bio)chemical assays. Chem. Commun. 9, 240–241 10.1039/b210677a [DOI] [PubMed] [Google Scholar]
- Firestein S. (2001). How the olfactory system makes sense of scents. Nature 413, 211–218 10.1038/35093026 [DOI] [PubMed] [Google Scholar]
- Galizia G., Menzel R. (2000). Odour perception in honeybees: coding information in glomerular patterns. Curr. Opin. Neurobiol. 10, 504–510 10.1016/S0959-4388(00)00109-4 [DOI] [PubMed] [Google Scholar]
- Gardner J., Bartlett P. (1994). A brief history of electronic noses. Sens. Actuators B Chem. 18, 211–220 10.1016/0925-4005(94)87085-3 [DOI] [Google Scholar]
- Gerstner W., Kistler W. M. (2002). Spiking Neuron Models: Single Neurons, Populations, Plasticity. Cambridge: Cambridge University Press [Google Scholar]
- Gollisch T., Meister M. (2008). Rapid neural coding in the retina with relative spike latencies. Science 319, 1108–1111 10.1126/science.1149639 [DOI] [PubMed] [Google Scholar]
- Gutierrez-Osuna R., Nagle H. T., Schiffman S. S. (1999). Transient response analysis of an electronic nose using multi-exponential models. Sens. Actuators B Chem. 61, 170–182 10.1016/S0925-4005(99)00290-7 [DOI] [Google Scholar]
- Hallem E., Ho M., Carlson J. (2004). The molecular basis of odor coding in the Drosophila antenna. Cell 117, 965–979 10.1016/j.cell.2004.05.012 [DOI] [PubMed] [Google Scholar]
- Heil P. (2004). First-spike latency of auditory neurons revisited. Curr. Opin. Neurobiol. 14, 461–467 10.1016/j.conb.2004.07.002 [DOI] [PubMed] [Google Scholar]
- Imai T., Suzuki M., Sakano H. (2006). Odorant receptor derived cAMP dignals direct axonal targeting. Science 314, 657–661 10.1126/science.1131794 [DOI] [PubMed] [Google Scholar]
- Joliiffee I. (2002). Principal Component Analysis, 2nd Edn Berlin: Springer [Google Scholar]
- Junek S., Kludt E., Wolf F., Schild D. (2010). Olfactory coding with patterns of response latencies. Neuron 67, 872–884 10.1016/j.neuron.2010.08.005 [DOI] [PubMed] [Google Scholar]
- Kent P. F., Mozell M. M., Murphy S. J., Hornung D. E. (1996). J. Neurosci. 16, 345–353 [DOI] [PMC free article] [PubMed] [Google Scholar]
- Koickal T. J., Hamilton A., Tan S. L., Covington J. A., Gardner J. W., Pearce T. C. (2007). Analog VLSI circuit implementation of an adaptive neuromorphic olfaction chip. IEEE Trans. Circuits Syst. 54, 60–73 10.1109/TCSI.2006.888677 [DOI] [Google Scholar]
- Korsching S. (2002). Olfactory maps and odor images. Curr. Opin. Neurobiol. 12, 387–392 10.1016/S0959-4388(02)00348-3 [DOI] [PubMed] [Google Scholar]
- Maass W. (1997). The Third Generation of Neural Network Models. Graz: Technische Universität [Google Scholar]
- Maass W. (1999). “Computing with spiking neurons,” in Pulsed Neural Networks, eds Maass W., Bishop C. M. (Cambridge: MIT press; ), 55–85 [Google Scholar]
- Malnic B., Hirono J., Sato T., Buck L. (1999). Combinatorial receptor codes for odors. Cell 96, 713–723 10.1016/S0092-8674(00)80581-4 [DOI] [PubMed] [Google Scholar]
- Martinelli E., D’Amico A., Di Natale C. (2006). Spike Encoding of artificial olfactory sensor signals. Sens. Actuators B Chem. 119, 234–238 10.1016/j.snb.2005.12.029 [DOI] [Google Scholar]
- Martinelli E., Santonico M., Pennazza G., Paolesse R., D’Amico A., Di Natale C. (2011). Short time gas delivery pattern improves long-term sensor reproducibility. Sens. Actuators B Chem. 156, 753–759 10.1016/j.snb.2011.02.034 [DOI] [Google Scholar]
- Michael L., Johnson B. (2003). Olfactory coding in the mammalian olfactory bulb. Brain Res. Rev. 42, 23–32 10.1016/S0165-0173(03)00142-5 [DOI] [PubMed] [Google Scholar]
- Muezzinoglu M., Vergara A., Huerta R., Rulkov N., Rabinovich M., Selverston A., Abarbanel H. (2009). Acceleration of chemo-sensory information processing using transient features. Sens. Actuators B Chem. 134, 507–512 10.1016/j.snb.2008.10.065 [DOI] [Google Scholar]
- Nakamoto T., Okazaki N., Moriizumi T. (1997). High speed active gas/odor sensing system using adaptive control theory. Sens. Actuators B Chem. 41, 183–188 10.1016/S0925-4005(97)80293-6 [DOI] [Google Scholar]
- Persaud K., Dodds G. (1982). Analysis of discrimination mechanisms in the mammalian olfactory system using a model nose. Nature 299, 352–355 10.1038/299352a0 [DOI] [PubMed] [Google Scholar]
- Polese D., Magna G., Dini F., Martinelli E., Paolesse R., D’Amico A., Filippini D., Lundström I., Di Natale C. (2011). Facile sensors replacement in optical gas sensors array, Proc. of Eurosensors XXV, Athens (4–6/9/2011) to appear in Procedia Engineering. [Google Scholar]
- Rieke F., Warland D., de Ruyter R., van Steveninck R., Bialek W. (1996). Spike-Exploring the Neural Code, Cambridge: MIT press [Google Scholar]
- Sicard G., Holley A. (1984). Receptor cell responses to odorants: similarities and differences among odorants. Brain Res. 292, 283–296 10.1016/0006-8993(84)90764-9 [DOI] [PubMed] [Google Scholar]
- Thorpe S., Fize D., Marlot C. (1996). Speed of processing in the human visual system. Nature 381, 520–522 10.1038/381520a0 [DOI] [PubMed] [Google Scholar]
- Uchida N., Mainen Z. (2003). Speed and accuracy of olfactory discrimination in the rat. Nat. Neurosci. 6, 1224–1229 10.1038/nn1142 [DOI] [PubMed] [Google Scholar]


