

Abstract
Grocery sales are a data source of potential value to dietary assessment programs in public health informatics. However, the lack of a computable method for mapping between nutrient and food item information represents a major obstacle. We studied the feasibility of linking point-of-sale data to USDA-SR nutrient database information in a sustainable way. We analyzed 2,009,533 de-identified sales items purchased by 32,785 customers over a two-week period. We developed a method using the item category hierarchy in the supermarket’s database to link purchased items to records from the USDA-SR. We describe our methodology and its rationale and limitations. Approximately 70% of all items were mapped and linked to the SR; approximately 90% of all items could be mapped with an equivalent expenditure of additional effort. 100% of all items were mapped to USDA standard food groups. We conclude that mapping grocery sales data to nutritional information is feasible.
Introduction
The prevalence of overweight or obese individuals has increased dramatically in the United States during the past several decades. In 2003–2004, nearly one third of U.S. adults were obese and 17.1% of children were overweight. In addition, it is estimated that there are over one billion overweight adults worldwide, with 300 million classified as obese.1 These numbers are alarming; obesity is associated with increased risk for many diseases, including heart disease, diabetes, and osteoarthritis.2
Individual- and population-level dietary monitoring sees wide use among clinicians, dietitians, epidemiologists, and other health care professionals as they study the incidence, prevalence, and trends of obesity. Common methods of dietary monitoring and assessment include dietary recall, food diaries, food frequency questionnaires, household inventories, and national surveys (e.g., The National Health and Nutrition Examination Survey [NHANES]). However, these approaches are costly, time-intensive, and subject to self-reporting biases.3, 4 If dietary monitoring and data collection tools could be automated, that would represent a major innovation in the domain of public health informatics.
The work described here follows the principle set forth by Yasnoff et al. that public health informatics is more than just automation, rather it “…enables the redesign of systems using approaches that were previously impractical or not even contemplated.”5 This pilot study lays the groundwork that takes a step toward unlocking the full potential of supermarket sales data as a nutrition and public health informatics tool. By linking nutritional data to sales data, new projects, analyses, and systems that potentially could improve conventional public health practices are now practical.
Background
Supermarket sales data show potential as a timely, indirect, and cost-effective method for longitudinal nutritional monitoring of individuals, households, and populations. In the U.S., a majority of grocery stores use electronic product labels or product codes to identify and track sales items. Traditionally, these commercial sales data are used by supermarkets to refine product placement within a store or to realign pricing strategies, based on business intelligence and data analytics.6–11 Viewed from another perspective, in their day-to-day business operations supermarkets are continuously gathering and recording vast amounts of data about household food choices that very likely reflect overall household eating patterns. Several recent studies have shown that grocery sales data hold promise as an indirect nutritional assessment measure for long-term public health surveillance and for the evaluation of nutritional interventions.12–18
While sales data are a potential treasure trove of information about dietary habits and behaviors at the population level, there is a major barrier to utilizing supermarket records in public health informatics: there is no direct (automatic) way to link the sales item codes to the nutritional content of the foods that they represent. The majority of food products manufactured and sold in the United States have both a Nutrition Facts Label and a Universal Product Code (UPC) printed on their packaging; however, there is no comprehensive, publicly available database that links these key pieces of information together. To use sales data effectively for nutritional assessment, the UPC must be linked to some form of computable nutritional information. That could take the form of a detailed listing of macro- and micro-nutrients for each scanned food item, or a configuration of sales data grouped by similar nutritional attributes, such as in the standard set of food groups established by the United States Department of Agriculture (USDA). Early efforts to link sales data to nutritional content did not attempt to cover every food item within a supermarket database. Instead, those analyses have tended to focus on specific, limited subgroups of purchases such as dairy products or a supermarket’s top-selling items.15, 18
One resource with potential for providing detailed nutrient information as a target for linkage to supermarket sales data is the USDA National Nutrient Database for Standard Reference (SR).19 This database contains over 7,500 coded food items, complete with nutritional information such as the counts and percentages-per-serving of calories, carbohydrates, protein, fats, fiber, sugars, minerals, and vitamins. While this database is a rich source of food-specific nutrient data, it is surprising to learn that there is, as yet, no way to link the nutritional information automatically to supermarket sales records through the UPC, which is the standard food product identifier in the retail market.
The objective of our study was to use the USDA-SR to assess the feasibility of mapping its nutritional content to the supermarket sales data from a large, local supermarket chain’s sales database. If successful, such a linkage would permit a detailed or a population-level nutritional assessment of purchases made anywhere within the supermarket chain, locally, regionally, or nationally. If the sales records were further attributable to individual shoppers or families -- via a frequent shopper card program, for example -- such a linkage could conceivably facilitate the development of highly specific, personalized health and nutritional studies, e.g., by using market basket analysis techniques that could be readily correlated with nutritional information.
Methods
A de-identified data set was acquired from a supermarket chain with stores throughout the Intermountain West. These data consisted of 2,009,533 purchased items from 32,785 random customer visits made over a two-week period in August 2007. The records were chosen to provide a large variety of items purchased. The data set likely reflects a representative sample from the supermarket chain’s customer base in summer.
The grocery transaction data elements comprising our sample data set included: UPC, text description of item, date and time of purchase, indicators of quantity and pricing, and three hierarchical categories used to organize items in the supermarket database. The top tier in this hierarchy was a code and descriptor set for “department,” the next level with a code-descriptor pair was for “commodity,” and the most granular category was entitled “sub-commodity” (Figure 1). While each supermarket chain or operating company has its own sales transaction database, it is surmised that the structure of each database is similar. Our supermarket data-sharing partner, for example, belongs to one of the nation’s largest retail grocery chains. We describe the structure in more detail in the paragraphs below.
Figure 1.
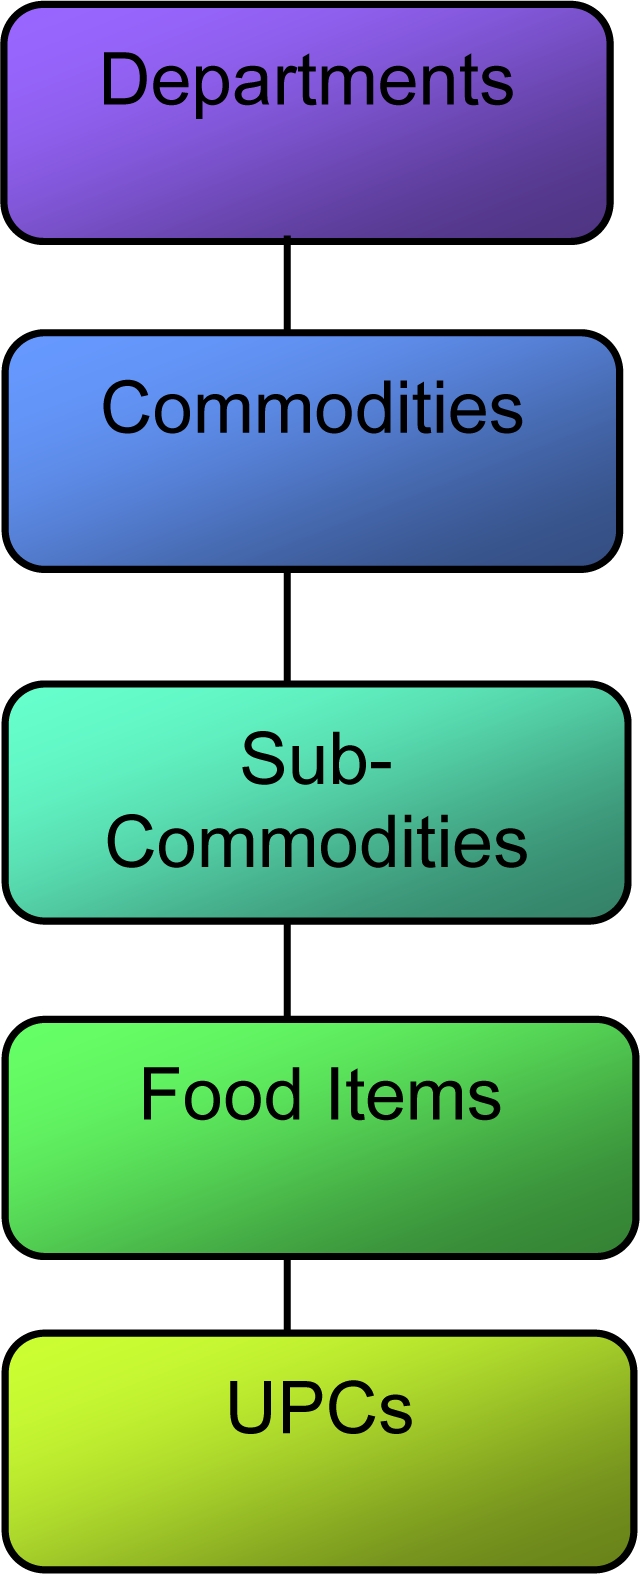
Structure of the supermarket database hierarchy.
Departments:
At the highest level, there were nearly 70 departments in the supermarket database, each one containing strictly food items, strictly non-food items, or a mixture of item types. In some cases (“Fruit”, “Vegetables”, etc.), the department name might be used as a filter to reduce the dimensionality of the grocery data for further analysis. Since there were a number of departments that included foods as well as non-food items, however, it would be difficult to infer nutritional content consistently from the department category alone.
Commodities:
The second tier in the hierarchy was the commodity category, which was also a very high-level set of codes and descriptors, similar to the department category in this respect. As in the departments, the majority of the commodities were only food or non-food products, but there were occasionally commodities that combined food and non-food items. The approximately 400 unique commodities allowed for more descriptive granularity than the departments. Each commodity belonged to only one department.
Sub-Commodities:
The sub-commodity level of the hierarchy was the most specific and informative grouping within the supermarket database. All of the over 2,100 sub-commodity codes and descriptors were classified as either belonging to food or non-food categories. Each item in the database had been assigned to a sub-commodity class with other similar items, which together often constitute a generic product or food item type for analysis, without any vendor-specific information.
Food items-UPCs:
Each UPC is tied to one food item, but the inverse was not true. For example, if a cereal came in two portions, such as a 24 oz. and a 36 oz. box, that same food item would have two distinct UPCs to distinguish the packaging size.
Mapping:
Our goal was to obtain detailed nutritional information -- calories, carbohydrates, fats, proteins, etc. -- for items or item categories in the supermarket data set. After studying the grocery data, we concluded that UPCs themselves were too volatile and dynamic to use as a linkage reference point. New UPCs are added to retail databases continuously, e.g., the same food item might be sold in multiple forms, brands, and labels. Therefore, unique values at the sub-commodity level of the supermarket’s classification system were ascertained and manually mapped to a corresponding food item from the SR. The sub-commodity category was chosen because it represented the finest level of granularity among the three higher-level supermarket data categories and showed the closest affinities to the item and food groupings in the SR. Sub-commodities proved suitable for linking because they were a relatively stable element in the store data hierarchy.
Initially, we attempted to automatically map the linkages between these data sources by using a string-matching technique: comparing the text descriptors in the sub-commodity categories and in the food item table of the SR database. We then tried using a commercial matching tool (FuzzyDupes, www.kroll-software.de/products/fuzzydupes_e.asp). The result was that only four successful matches out of the 1,252 food related sub-commodities from the supermarket data set. The small number of matches was due to differences in how the two data sets were curated and to the different naming conventions and strategies employed in each case. The supermarket’s text descriptions were frequently short (50 characters or less) with many abbreviations, suited for printing on a customer receipt, whereas the SR food item descriptions were more detailed (100–200 characters) and used complete noun phrases, to assist researchers in uniquely identifying food items. Since the number of sub-commodities was of tractable size, we opted to manually map them to the SR because we felt the overhead of exploring further automated methods would take longer than manual methods. The mapping process involved picking a sub-commodity category and then searching for the equivalent food item in the SR (Figure 2). Despite this reliance on manual methods, there is still important informatics potential in the study, which we describe in the Discussion section.
Figure 2.

Diagram of a mapping between a supermarket sub-commodity and an entry in SR.
In addition to mapping detailed nutrient information to the supermarket sales data, food groups defined by the USDA (Table 1) were also mapped to each sub-commodity category. For sub-commodities successfully mapped to a SR food item, the food group was directly imputed from the SR food item code. The sub-commodities that were not successfully mapped to a food item could still be matched manually to a SR food group. This study was deemed exempt by the University of Utah Institutional Review Board.
Table 1:
List of food groups used in the USDA National Nutrient Database SR.
| Baby Foods | Lamb, Veal, and Game Products |
| Baked Products | Legumes and Legume Products |
| Beef Products | Meals, Entrees, and Side dishes |
| Beverages | Nut and Seed Products |
| Breakfast Cereals | Pork Products |
| Cereal Grains and Pasta | Poultry Products |
| Dairy and Egg Products | Sausages and Luncheon Meats |
| Ethnic Foods | Snacks |
| Fast Foods | Soups, Sauces, and Gravies |
| Fats and Oils | Spices and Herbs |
| Finfish and Shellfish Products | Sweets |
| Fruits and Fruit Juices | Vegetables and Vegetable Products |
Results
The 2,009,533 purchased food items in the data set clustered into 29,981 unique UPCs and 26,483 unique items. The distribution skew was substantial (Figure 3); some items were purchased often and others very rarely.
Figure 3.

Distribution of items purchased in total data set, item frequency versus its rank (note that the x-axis is in log10 scale).
The supermarket sales database was organized as follows for food specific items (distinct counts in parentheses; counts exclude non-food items):
| Store Departments (N = 36) |
| Commodities (N = 210) |
| Sub-commodities (N = 1,252) |
| Items (N = 26,854) |
| UPCs (N = 29,981) |
| Purchases (N = 2,009,533 total / 26,854 unique) |
The results of mapping food items from the SR database to the supermarket sub-commodity categories are shown in Table 2. Since the distribution of food items purchased from each sub-commodity category varies, the results are reported at the sub-commodity level, the unique food item level, and for the entire data set. Approximately 70% of the sub-commodities were successfully mapped to a SR food item and therefore have complete nutritional data linked to them via the 5-digit NDB_No. This accounted for 69.1% of the purchased items in the entire data set.
Table 2:
Results of mapping sales data to the USDA-SR databse.
| Sub-Commodity Level Results | Unique Food Item Results | Entire Data Set Results | |
|---|---|---|---|
| Total number of food-related items | 1,252 food-related sub-commodities | 26,854 unique food items | 2,009,533 total food items |
| Number (percent) successfully mapped | 884 (70.6%) | 15,385 (57.3%) | 1,387,864 (69.1%) |
| Number (percent) not mapped | 368 (29.4%) | 11,469 (42.7%) | 621,669 (30.9%) |
| Not mapped due to nutritionally diverse sub-commodity | 263 (21%) | 10,233 (38.1%) | 580,768 (28.9%) |
| Not mapped due to sub-commodity not being in USDA Database | 103 (8.2%) | 1,232 (4.6%) | 40,892 (2%) |
| Not mapped due to inadequate text description | 2 (0.2%) | 4 (< 0.1%) | 9 (< 0.1%) |
In the process of linking SR nutrient information to the sub-commodities, we encountered three barriers to successfully mapping the complete data set. The most common barrier, accounting for the unsuccessful mapping of 21% of the sub-commodities, was the existence of heterogeneous sub-commodities containing nutritionally diverse food items that could not be mapped to a single SR item entry. The next most common barrier, account for 8.2% of unmapped sub-commodities, was comprised of foods simply not covered the USDA-SR database. Typically, these were locally prepared foods, where ingredients can be expected to vary depending on the method of preparation used. The remaining 0.2% of unmapped sub-commodities did not map because we were unable to decipher the sub-commodity descriptor. For example, the text string “GIVE 2 BT PTRTC BRWN TRY” could not be matched to an SR entry since the meaning is unclear.
A sub-analysis of heterogeneous sub-commodities, the 21% of the unmapped sub-commodities group (∼30% of the entire data set), was conducted to improve our strategy for nutritional linking. The distribution of unique food items in this unmapped subset showed a rapidly decaying distribution similar to Figure 3, suggesting that a small number of items constituted a large portion of the heterogeneous sub-commodity data. For example, the 10 most frequently purchased items in the distribution accounted for 9.6% of the unmapped group. The 100 and 1,000 most frequently purchased items accounted for 25% and 63% of purchases, respectively.
As an interim measure for the purposes of preliminary analysis, the mapping of standard SR food groups to the sales data was completed for 100% of the sub-commodities in the supermarket data set. The food group identifier could be directly imputed from the SR food item code for the 70% of sub-commodities that were successfully mapped to a SR food item. The remaining 30% of the sub-commodities were manually assigned to a corresponding SR food group.
Discussion
We found that by using a retail supermarket’s hierarchy of item categories, a significant proportion of sales data items could be mapped to nutrient and food group values. USDA standard food groups were mapped to 100% of the sales data, and nearly 70% of the entire grocery data set was linked to detailed nutritional content. To completely utilize sales data as a dietary assessment tool, an analysis of the barriers encountered in mapping nutritional content and development of a future strategy for improved total data linkage are needed.
The largest barrier to mapping the supermarket sales data to SR nutrient information was the presence of heterogeneous sub-commodities containing nutritionally diverse food items. For example, “SOFT DRINKS” is a sub-commodity that contains both diet and sugar-sweetened beverages. Clearly the nutritional profile of items in this sub-commodity are not even roughly similar. Another example would be “FROZEN MEALS” and it includes “hearty man sized” TV dinners and modest Lean Cusine®. A potential solution is matching each food item (more granular than a sub-commodity) in the unmapped data individually to a SR entry. Manually mapping individual items in the heterogeneous categories would be straightforward, as it would be a similar process to the mapping of the sub-commodities. Due to the frequency distribution of the large unmapped subset, e.g., it is exponentially decreasing, the most commonly purchased items account for a significant proportion of the total unmapped items. With roughly the same effort expended in the original sub-commodity manual mapping, the next 1,200 sub-commodities to SR links would extend total data set coverage to 90% of all grocery food items. The USDA Food and Nutrient Database for Dietary Studies (FNDDS)19 contains more composite items and food ‘recipes’, with links back to the SR (NDB_No), which might allow for a broader set of search criteria to identify some of these heterogeneous sub-commodity items in future studies.
The supermarket’s database structure at the sub-commodity level was found to be adequate for mapping food groups to the sales data. The sales data could be mapped to food groups much more readily than nutrient information because the USDA food groups are very broad categories that fit the supermarket’s definition of sub-commodities more closely. For example, sub-commodities such as “AUTHENTIC INDIAN FOOD,” “FROZEN MEAL DINNERS,” and “SOFT DRINKS” contain foods too varied nutritionally to assign one nutritional profile to the entire category. However, the USDA food groups are broad enough that these sub-commodities can fit into “Ethnic Foods,” “Meals, Entrees, and Side dishes,” and “Beverages,” respectively.
The second most common barrier, accounting for only 2% of the total purchases, was due to the lack of a representative item in the SR database. While some foods might not be present in the SR database, there are many other sources of nutritional information, such as food composition tables and online databases (e.g., the FNDDS databases), where the information for a representative food item for the sub-commodities might be found. By using an alternate data source for these items, it is possible to increase the linkage by an additional 2%.
One limitation of this study is that the SR is only a proxy for nutritional content in the sales item data, not the exact values for each product, such as might be obtained from the Nutrition Facts Label panel. However, as we noted earlier, there is no non-proprietary method for mapping from UPCs to the data on Nutrition Fact labels. Another limitation is that the mapping strategy we present is specific to the structure of the supermarket database that was used (but this market chain is part of the largest national retail grocery chain in the US). Each supermarket chain will have a somewhat different structure, and the process might need to be replicated for application to another database, if there were no suitable surrogate for the sub-commodity categories. There are promising indicators in the field of informatics pointing to the goal of developing a standard ontology for describing food and nutrition data. As Lemay et al. suggest, the SR is a suitable starting point for this process of standardization: “Preexisting standards such as the US Department of Agriculture’s National Nutrient Database for Standard Reference can be converted to ontologies.”20 The most mature project of this kind is the LanguaL Food DescriptionThesaurus,21 which, in its most current releases, links to the NDB_No field in the SR where possible. HL7 is currently balloting on proposal #706 (November 2010) to create an Electronic Nutrition Care Process Record System (ENCPRS) Functional Profile, for the Electronic Health Record, to “promote information interoperability between nutrition and food systems and other areas of healthcare for a more complete patient care experience.”22 Our preliminary research, providing the first steps in the process of mapping grocery item data to the SR, could eventually become integrated with these larger projects and long-term desiderata in the fields of nutrition research and informatics.
Despite these limitations, supermarket sales data offer several advantages that make it a unique data source. Many assessment methods provide a one-time nutritional snapshot of an individual, household, or population.3 However, sales data are constantly being collected, offering a rare view of the variety of foods consumed by a family or a community over a longer period of time. Also, participant and researcher burden is an important factor to consider when choosing an assessment method.4 Sales data provide dietary researchers with an indirect measure of dietary patterns in the grocery shopping population with virtually no participant burden and significantly reduced researcher burden. Since the grocery data are collected automatically and directly from the store system’s point-of-sale, there is significantly reduced risk for measurement error due to the array of self-reporting biases that must be accounted for using most other methods in nutritional research studies.23
The ability to map nutritional content to sales data with only moderate effort affords researchers new opportunities. In a recent review, French et al. identified two articles that utilized UPC scanners as the methodology to assess household purchasing behaviour.4, 24, 25 One of the studies found that working with sales data at the UPC level is very difficult because new codes are constantly being created.24 Comprehensive item databases are difficult to maintain, since they must be updated on a continual basis to provide the needed coverage. The review concluded that restrictions from using UPCs along with the complexity of the supermarket system result in extremely time-consuming methods, such that their potential value is often easy to underestimate. In additional studies that used purchasing data, researchers often selected subsets of items or food groups to make their work tractable (e.g. fruits, vegetables, dairy, or high-fat foods). They studied subsets due to the vast range and variety of data as well as due to the organizational challenges involved in collecting and measuring its value, something we have illustrated here. Utilizing the internal categorization system in a supermarket grocery database, in contrast, has the potential to provide an easily-maintained, cost-effective method of linking food sales data and nutritional information. The mapping process to establish data linkages need only be completed one time initially and, through the use of higher-order categories such as sub-commodities instead of individual food items, the number of daily or weekly product changes within a store that would be necessary to track in a UPC database, is substantially reduced.
We close with an example that suggests how these grocery data, once mapped, can be used in a potential informatics application. The right hand side of Figure 4 shows a popular dietary pattern model by Hu26 that illustrates the differences between a “prudent” diet and the typical “Western” diet (values on the arrow links indicate the weight of the food group as it contributes to the pattern). The tables on the right are populated with a small sample of association rules derived from our grocery item data after mapping and grouping by shopper. The arrows in color suggest how Hu’s dietary patterns can be confirmed in actual grocery shopping patterns at the individual shopper level.
Figure 4.

Illustration of how a well recognized dietary pattern model (from Hu26) can be approximated using association rule mining from the 2-million record grocery dataset after mapping to the SR.
Conclusion
Successfully mapping nutritional information to sales data allows these data to be used for many purposes. Public health epidemiology and surveillance can leverage grocery sales data as a means to ascertain regional or ethnic differences in eating behaviors.12, 18, 27, 28 Sales data can further be used in interventions to determine the effect of public health nutrition policy changes or healthy eating campaigns on consumer food purchasing patterns and assess them as an indirect, low-cost measure of population dietary health.24, 29 In the clinical and consumer health domains, monitoring individual or household purchases via sales data potentially provides a powerful means for facilitating dietary analysis, as a feedback mechanism to inform and promote individual dietary behavioral change. The act of purchasing grocery items is a conscious (intentional) nutritional choice and thereby serves as a dietary assessment indicator for individuals as well as families and households. In sum, the mapping and linking of supermarket sales data to the SR nutrient information database offers potential as a useful informatics tool, with many different possible applications in the public health, nutrition, and clinical domains.
We have demonstrated that mapping grocery sales data to nutrient information using a supermarket’s built-in hierarchical item category structure is feasible. Successful mapping and linkage allows sales data to be utilized for many research purposes, including public health surveillance, intervention assessment, and household or individual food purchase evaluation.
References
- 1.World Health Organization . Technical Report Series. Diet, nutrition and the prevention of chronic diseases. Geneva: 2003. [PubMed] [Google Scholar]
- 2.Ogden CL, Carroll MD, McDowell MA, Flegal KM. Obesity among adults in the United States--no statistically significant change since 2003–2004. NCHS Data Brief. 2007 Nov;(1):1–8. [PubMed] [Google Scholar]
- 3.Barrett-Connor E. Nutrition epidemiology: how do we know what they ate. Am J Clin Nutr. 1991 Jul;54(1 Suppl):182S–7S. doi: 10.1093/ajcn/54.1.182S. [DOI] [PubMed] [Google Scholar]
- 4.French SA, Shimotsu ST, Wall M, Gerlach AF. Capturing the spectrum of household food and beverage purchasing behavior: a review. J Am Diet Assoc. 2008 Dec;108(12):2051–8. doi: 10.1016/j.jada.2008.09.001. [DOI] [PubMed] [Google Scholar]
- 5.Yasnoff WA, O Carroll PW, Koo D, Linkins RW, Kilbourne EM. Public health informatics: improving and transforming public health in the information age. Journal of Public Health Management and Practice. 2000;6(6):67–75. doi: 10.1097/00124784-200006060-00010. [DOI] [PubMed] [Google Scholar]
- 6.Montgomery A. Creating Micro-Marketing Pricing Strategies Using Supermarket Scanner Data. Marketing Science. 1997;16(4):315–37. [Google Scholar]
- 7.Mladenic D, Eddy W, Ziolko S, editors. Exploratory Analysis of Retail Sales of Billions of Items. Proceedings of Interface; 2001. [Google Scholar]
- 8.Agrawal R, Imienlinski T, Swami A, editors. Mining Association Rules Between Sets of Items in Large Datasets. Proceedings of the ACM SIGMOD International Conference on the Management of Data; 1993. [Google Scholar]
- 9.Brin S, Motwani R, Silverstein C, editors. Beyond Market Baskets: Generalizing Association Rules to Correlations. Proceedings of the ACM SIGMOD International Conference on Management of Data; 1997. [Google Scholar]
- 10.Tsai P, Chen C. Information Systems. 2004. Mining interesting association rules from customer databases and transaction databases; pp. 685–96. [Google Scholar]
- 11.Bell DR, Lattin JM. Shopping Behavior and Consumer Preference for Store Price Format; Why “Large Basket” Shoppers Prefer EDLP. Marketing Science. 1998:66–8. [Google Scholar]
- 12.Narhinen M, Berg MA, Nissinen A, Puska P. Supermarket sales data: a tool for measuring regional differences in dietary habits. Public Health Nutr. 1999 Sep;2(3):277–82. doi: 10.1017/s1368980099000373. [DOI] [PubMed] [Google Scholar]
- 13.Narhinen M, Nissinen A, Puska P. Sales data of a supermarket--a tool for monitoring nutrition interventions. Public Health Nutr. 1998 Jun;1(2):101–7. doi: 10.1079/phn19980016. [DOI] [PubMed] [Google Scholar]
- 14.Ni Mhurchu C, Blakely T, Wall J, Rodgers A, Jiang Y, Wilton J. Strategies to promote healthier food purchases: a pilot supermarket intervention study. Public Health Nutr. 2007 Jun;10(6):608–15. doi: 10.1017/S136898000735249X. [DOI] [PubMed] [Google Scholar]
- 15.Hamilton S, Mhurchu CN, Priest P. Food and nutrient availability in New Zealand: an analysis of supermarket sales data. Public Health Nutr. 2007 Dec;10(12):1448–55. doi: 10.1017/S1368980007000134. [DOI] [PubMed] [Google Scholar]
- 16.Radimer KL, Harvey PW. Comparison of self-report of reduced fat and salt foods with sales and supply data. Eur J Clin Nutr. 1998 May;52(5):380–2. doi: 10.1038/sj.ejcn.1600557. [DOI] [PubMed] [Google Scholar]
- 17.Tin ST, Mhurchu CN, Bullen C. Supermarket sales data: feasibility and applicability in population food and nutrition monitoring. Nutr Rev. 2007 Jan;65(1):20–30. doi: 10.1111/j.1753-4887.2007.tb00264.x. [DOI] [PubMed] [Google Scholar]
- 18.Van Wave TW, Decker M. Secondary analysis of a marketing research database reveals patterns in dairy product purchases over time. J Am Diet Assoc. 2003 Apr;103(4):445–53. doi: 10.1053/jada.2003.50069. [DOI] [PubMed] [Google Scholar]
- 19.USDA National Nutrient Database for Standard Reference, Release 20. Nutrient Data Laboratory Home Page; http://www.ars.usda.gov/ba/bhnrc/ndl [database on the Internet] [cited August 25, 2008]. [Google Scholar]
- 20.Lemay DG, Zivkovic AM, German JB. Building the bridges to bioinformatics in nutrition research. The American journal of clinical nutrition. 2007;86(5):1261. doi: 10.1093/ajcn/86.5.1261. [DOI] [PubMed] [Google Scholar]
- 21.Information DF LanguaL™ - the International Framework for Food Description. 2011. Available from: http://www.langual.org/
- 22.HL-7 Project Summary for Electronic Nutrition Care Process Record System (ENCPRS) Functional Profile. 2011. [updated June 24, 2011]; Available from: http://www.hl7.org/special/committees/projman/searchableprojectindex.cfm?action=edit&ProjectNumber=706.
- 23.Greenwood D, Ransley J, Gilthorpe M, Cade J. Use of itemized Till receipts to adjust for correlated dietary measurement error. American journal of epidemiology. 2006;164(10):1012. doi: 10.1093/aje/kwj308. [DOI] [PubMed] [Google Scholar]
- 24.Baxter J, Graves K, Mullis R, Potter J. Experiences in Using Computerized Sales Data to Evaluate a Nutrition Intervention Program. J Nutr Educ. 1996;28:443–5. [Google Scholar]
- 25.Weinstein JL, Phillips V, MacLeod E, Arsenault M, Ferris AM. A universal product code scanner is a feasible method of measuring household food inventory and food use patterns in low-income families. J Am Diet Assoc. 2006 Mar;106(3):443–5. doi: 10.1016/j.jada.2005.12.004. [DOI] [PubMed] [Google Scholar]
- 26.Hu FB. Dietary pattern analysis: a new direction in nutritional epidemiology. Current opinion in lipidology. 2002;13(1):3. doi: 10.1097/00041433-200202000-00002. [DOI] [PubMed] [Google Scholar]
- 27.Jones E. An Analysis of Consumer Food Shopping Behavior Using Supermarket Scanner Data: Differences by Income and Location. Amer J Agr Econ. 1997;79(5):1437–43. [Google Scholar]
- 28.Den Hond EM, Lesaffre EE, Kesteloot HE. Regional differences in consumption of 103 fat products in Belgium: a supermarket-chain sales approach. J Am Coll Nutr. 1995 Dec;14(6):621–7. doi: 10.1080/07315724.1995.10718551. [DOI] [PubMed] [Google Scholar]
- 29.Mathios A. The importance of nutrition labeling and health claim regulation on product choice: an analysis of the cooking oils market. Agricultural and Resource Economics Review. 1998;27:159–68. [Google Scholar]