Abstract
The Emergency Department (ED) delivers a major portion of health care – often with incomplete knowledge about the patient. As such, EDs are particularly likely to benefit from a health information exchange (HIE). The Indiana Public Health Emergency Surveillance System (PHESS) sends real-time registration information for emergency department encounters. Over the three-year study period, we found 2.8 million patients generated 7.4 million ED visits. The average number of visits was 2.6 visits/patient (range 1–385). We found more than 40% of ED visits during the study period were for patients having data at multiple institutions. When examining the network density, we found nearly all EDs share patients with more than 80 other EDs. Our results help clarify future health care policy decisions regarding optimal NHIN architecture and discount the notion that ‘all healthcare is local’.
Introduction
Patients seek health care in many different settings, and this is equally true in emergency department settings.1 In the United States, the ED represents a major portion of health care with 116.8 million visits each year.2 As a direct result of increased ED visits and decreased inpatient capacity, the Institute of Medicine issued its report on Emergency Care. The 2006 Institute of Medicine report entitled Hospital-based Emergency Care: At the Breaking Point specifically calls for hospitals to adopt information systems to improve the safety and quality of emergency care.3 Improved care quality results from informed decisions made via immediate access to relevant health care information. However, the emergency patient’s complete record often resides elsewhere in the health care community. Commonly, patients often forget key details or are too ill or injured to provide relevant past medical history, medications, or allergy information. Patients routinely ask their clinicians to “check the computer” for relevant data, unaware those providers are unable to access their medical data from other health care systems in an efficient and effective manner.
Because of the lack of care continuity, EDs by their nature are particularly likely to benefit from an increasingly integrated health care system, such as those supported by health information exchanges (HIEs). Title XIII of the American Recovery & Reinvestment Act of 2009, also as known as the Health Information Technology for Economic & Clinical Health (HITECH) act dramatically advances the prospect for widespread HIE adoption by requiring providers to demonstrate EHR information exchange capabilities to be eligible for Medicare and Medicaid incentive payments.4 The goal is to begin mobilizing electronic clinical data in support of the vision of a Nationwide Health Information Network (NHIN).
However, creating a NHIN is a substantial challenge. There are issues of size, complexity, privacy, promoting change within existing health care systems, and ensuring that the approach does not unnecessarily hamper innovation. In order to optimally develop systems that can efficiently and effectively exchange integrated clinical data, we first need to understand the nature of the distribution of care so we can develop appropriate technical architectures to serve those informational needs. Common architecture models range from peer to peer models, to federated models, to a fully integrated monolithic system as proposed in the United Kingdom.
While the architecture discussion continues, the ED of the future will require highly integrated information technologies that access clinical data across the spectrum of care.5 Previous work demonstrated that exchanging health care information via a regional health information exchange – the Indiana Network for Patient Care (INPC) – can dramatically reduce health care costs.6 These cost savings likely arise from a reduction in unnecessary testing through access to a patient’s data from across central Indiana.
We have previously described central Indiana’s patient crossover rates (i.e. a patient from one system being treated in a separate healthcare system).1 Our analysis found that 25% of the patients with more than one visit also visited one of the other health care systems in the course of the year in a local health information exchange. Much less is known about the additional value a larger HIE could provide.
The purpose of this study is to describe patient crossover rates throughout the entire State of Indiana over a three-year period. This information provides one estimate of the opportunities for cross-institutional data to influence medical care.
Methods
This study was conducted at the Regenstrief Institute. We obtained approval from the Indiana State Department of Health (ISDH) data release committee and received permission from the Indiana University IRB to perform the analysis. An overview of our approach is illustrated in Figure 1.
Figure 1.
Process for preparing ED encounter data
PHESS Transactions
This analysis used data derived from the original HL7 version 2 registration transactions for emergency department encounters over the three-year study period between January 1, 2008 and December 30, 2010 from all institutions participating in the Indiana Public Health Emergency Surveillance System (PHESS). PHESS began in 2004 as a partnership between ISDH and the Regenstrief Institute to implement a statewide biosurveillance system.7 Each PHESS participant sends real-time HL7 transactions that contain registration information for all emergency department encounters.
Valid ED Transactions
Clinical information systems can generate electronic transactions that are (a) identical to a previous transaction, (b) non-compliant with the PHESS requirements, or (c) unrelated to patient care (e.g., test messages used to ensure proper system function, spurious messages without clear cause, etc.). As a result, we processed each transaction to ensure it was unique and contained valid emergency department encounter data according to PHESS requirements and a set of heuristics drawn from Regenstrief’s long-term real-world experience operating a health information exchange. For example, transactions containing a patient first name of “QC-Check” (quality control check) indicate a transaction unrelated to patient care.
Unique Encounters
After validating the transactions, we identified unique emergency department encounters. This is necessary because clinical systems often send multiple electronic registration transactions for the same clinical encounter: an initial transaction indicating the beginning of an encounter (ADT^A04) and subsequent transactions to update or add information not gathered during the initial intake (ADT^A08). Based on our longstanding operational experience and prior data analyses, we used data elements including person, place and time to establish unique emergency department encounters8, 9 The specific fields included (1) healthcare institution (HL7 MSH-4), (2) ED encounter date (HL7 PV1–44), and (3) medical record number (HL7 PID-3). Transactions missing any of these fields could not be definitively and uniquely identified as an encounter and were excluded from the analysis.
Unique Patients
We next identified unique patients among the set of unique encounters. This task is identical to the process of finding duplicate patients in a patient registry: we linked the dataset containing all unique encounters to itself. To accomplish this we used an open-source probabilistic record linkage software package.10 To link patients we used various combinations of patient demographics, including social security number, last and first name, gender, date of birth, telephone number, and zip code as determined by the record linkage software. In this manner all emergency department encounters belonging to the same patient were linked, forming a “patient group.” We randomly assigned a unique global patient identifier to each patient group. Each unique emergency department encounter was assigned the appropriate global patient identifier.
Data Analyses
Lastly, we generated summary statistics for the final dataset containing unique emergency department encounters and global patient identifiers using the R statistical package. We used Gephi to visualize the network relationships among emergency departments that share patients and compute network statistics.11 To do so we created a directed network between the 96 EDs based on the number of patients that were seen in an ED and subsequently seen in a different ED during the study period. We used Gephi to visualize the network and compute network statistics. We used the Force Atlas layouts to visualize the network.12 We also utilized k-core decomposition to identify the central network core.
Results
The distribution of emergency care and relationships among institutions can be described using a variety of factors. This includes using combinations of the individual patient, the individual encounter, or the individual institution as unit(s) of analyses. We present summary statistics and analyses using various combinations of these factors as the as well as a network relationship analysis.
Summary statistics
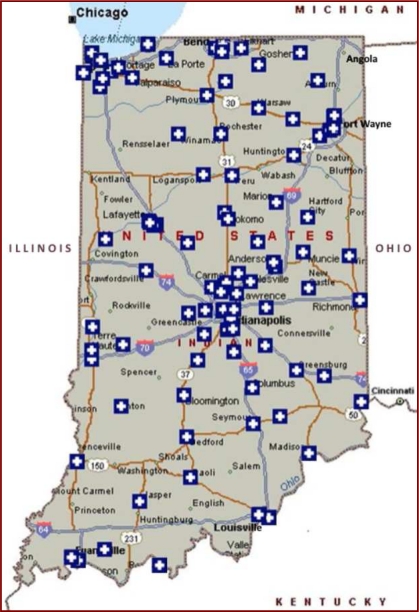
A total of 96 emergency departments shown in Figure 2 contributed data to this analysis. They generated a combined 41,766,585 HL7 registration transactions during the 3-year study period. We identified 6,313,467 duplicate or invalid transactions and another 1,637,947 that were missing either the institution name, medical record number, or visit date, leaving a total of 33,815,171 million unique, valid transactions. From this dataset we identified 7,447,521 unique emergency department encounters. From these transactions we found 2,882,274 unique patients using probabilistic matching. Thus, more than 2.8 million patients accounted for over 7.4 million visits for an average of 2.6 visits per patient.
Figure 2.
Geographical distribution of the 96 emergency departments participating in Indiana’s Pubic Health Electronic Surveillance System (PHESS) as of Dec-31-2010.
Total ED visits per patient
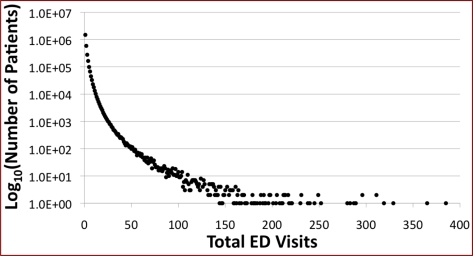
Figure 3 shows the distribution of patients as function of total ED visits. A single patient may have more than one visit, and we found six patients had more than 300 visits and a single patient accumulated 385 visits for the 3-year study period. Overall, 48% (1,392,041) of these unique patients had more than 1 ED visit while 3.3% (94,433) of patients had more than 10 visits.
Figure 3.
Distribution of patients stratified by the total number of ED visits. Note that six patients visited the ED more than 300 times and a single patient accumulated 385 visits for the 3-year study period.
Total unique EDs visited per patient
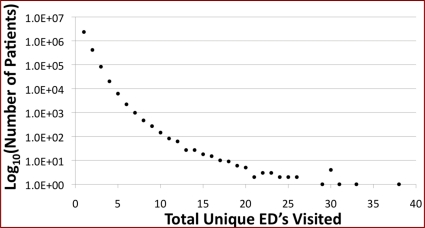
Figure 4 highlights the distribution of patients versus the number of unique EDs visited. Of the “multi-visit” patients, 38.1% (530,525) visited different EDs while 61.9% (861,516) of the “multi-visit” patients remained at a single ED. More than 1% (30,718) of patients visited 4 or more EDs during the study period.
Figure 4.
Distribution of patients stratified by the total number of unique EDs visited. Note that one patient visited 38 EDs during the 3-year study period.
Although the patients who visited multiple EDs represented just 22.5% of all ED patients, these “multi-visit” patients accounted for 40.7% (3,033,309) of all ED visits. Stated another way: more than 40% of ED visits during the study period were for patients having data at multiple institutions.
Visits by patients with data at multiple institutions
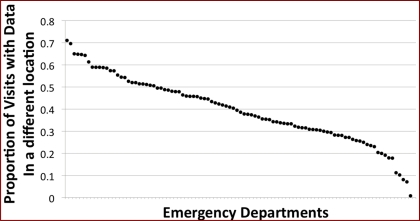
Examining each ED individually, Figure 5 shows the proportion of total visits by patients having data at multiple institutions. For 26 EDs, more than 50% of the visits were by patients with data in multiple institutions. Institutions with lower visit volumes, those who had recently joined PHESS, and those with proximity to medical communities in other states were more likely to have proportions less than 50%.
Figure 5.
Proportion of visits by patients with data residing in multiple institutions for each individual emergency department. For 26 EDs, more than 50% of the visits were by patients with data in multiple institutions.
Patients with data at other institutions
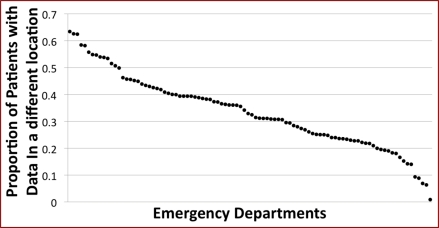
We use patients as the unit of analysis to determine the proportion of patients seen at a particular ED who also has ED encounter data at other institutions Figure 6 shows the proportion of total visits by patients having data at multiple institutions stratified by individual ED, independent of the number of visits. More than 50% of patients at 15 EDs had encounters at other institutions.
Figure 6.
Proportion of patients with data residing in multiple institutions for each individual emergency department. More than 50% of patients at 15 EDs had encounters at other institutions.
Network visualization
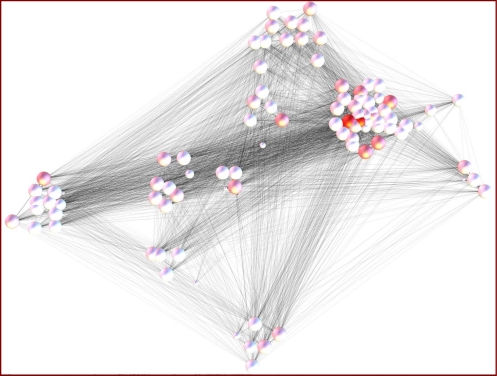
The Force Directed layout resulted in the network visualization shown in Figure 7. This configuration is based on the patients shared among EDs and does not directly reflect the actual geographical locations of the ED. In the figure each node represents one of the emergency departments. The node size is proportional to the weighted degree (the sum of the patients that go to or come from other EDs). The node shading represents the degree of betweenness of the node (“betweenness” is a centrality measure of a vertex within a graph which measures how often the vertices that occur on many shortest paths between other vertices). The network density, which is a measure of how many edges are present in the network as a proportion of the number of potential edges, is 0.85. This indicates that almost every pair of EDs in the state share patients. In fact, the entire network almost forms a clique (a completely connected network). The average degree, the number of edges coming to and going out of a node, is 161 indicating that each ED shares patients with more than 80 other EDs. In addition, using k-core decomposition we identified 74 EDs that constituted the core. While general clusters of “medical trading areas” emerge, the myriad gray edges clearly illustrate how interconnected all EDs are to one another.
Figure 7.
A network diagram illustrating the connectedness among Indiana EDs that participate in PHESS. Circular nodes represent EDs; node size indicates the visit volume; node color indicates the centrality of the ED. The gray edges connecting nodes indicate where patient crossover occurs. EDs that share proportionally larger number of patients are clustered together. While general clusters of “medical trading areas” emerge, the myriad gray edges clearly illustrate how interconnected all EDs are to one another.
Discussion
While a great deal of health care is delivered locally, much is not. During this three-year period, 2.8 million patients accounted for 7.4 million ED visits with an average of 2.6 visits per patient. Recognizing that patient visits generate data, we found more than 40% of ED visits during the study period were for patients having data at multiple institutions. Our estimates for the rates of patient crossover among the different hospital systems are likely reliable given the PHESS data “captured” an estimated 97% of all ED care in the State of Indiana.
While this is only the second study to describe the pattern of ED usage in a large community setting, this is the first study to examine patterns of emergency care for an entire state. In agreement with our previous paper,1 the amount of patient data residing in other health care systems increases as the number of hospital systems and time period grows.
When examining the network density, we observed a high degree of interconnectedness. In fact, the entire network forms a nearly completely connected network. The network analysis demonstrated that nearly every ED shares patients with nearly every other ED. The EDs that were not fully interconnected in the network and who fell outside the network core were generally smaller hospitals and joined the network more recently. In addition, some hospitals undoubtedly share patients with hospitals outside of Indiana. This is particularly true for hospitals in the northwestern part of the state and the far southwestern part of the state.
Additionally, these results help to inform the ongoing dialog regarding the merits of siloed peer-to-peer (push) and federated aggregate HIE (pull) architectures. While several NHIN architecture models have been described,13 we believe our data clearly shows the potential limitations of a peer-to-peer system for ED care. First, many point-to-point interfaces are necessary for peer-to-peer transmission. Deploying a peer-to-peer network enabling push data sharing among 96 EDs requires establishing and maintaining 4,560 [ (n2−n) / 2; n = 96 ] point-to-point interfaces, a costly scenario. Second, data access may be suboptimal in a peer-to-peer network. Currently proposed push scenarios require a sending agent (e.g., a human being) to transmit data prior to a scheduled appointment, or after an encounter is complete. Such a requirement is suboptimal for emergency care since ED visits are generally unplanned and often occur after regular business hours when many siloed clinical data systems lack a human operator. Architectures based on pull models largely avoid these issues.
Another consideration regarding architecture is redundancy. In the spring of 2008, flooding temporarily closed a hospital that happened to be a member of the INPC. We have witnessed other natural disasters. Hurricane Katrina taught the nation about the value of electronic accessible pre-existing patient information in disaster situations.14 The Veterans Health Administration’s (VHA) nationally shared data warehouse was a shining example of how such warehouses may work in crisis situations. Immediately following the disaster, information on past treatment was readily accessible in VA clinics and medical centers across the country that were treating displaced veterans and their families from Louisiana and Mississippi.
There are three important limitations to our study. First, while capturing approximately 97% of ED visit data for the state, there are still a few hospital systems that are not represented. These systems represent a smaller proportion of emergency care delivered in the state however, and are similarly likely to benefit from sharing information. Secondly, we analyzed each ED as a separate institution. We recognize that some hospital systems with multiple ED sites readily share data among their sites, and effectively act as a single institution. However, this is not the case for all multi-site hospital systems where patchwork quilts of vendor systems still exist. Future secondary data analysis could better enable us to refine our data set. Third, because our data includes only patient visits to EDs, the observed degree of interconnectedness and patient sharing likely represent lower-bound estimates for care provided across the health care spectrum. For example, our analysis does not capture a patient visit to the lab for a blood draw; the appointment with their primary care physician; the annual visit to public health for a flu vaccination; or direct admission hospitalizations without requiring an ED visit. Further, our dataset only represents Indiana, those institutions near state borders will likely share patients with other states. Therefore, despite our relatively robust numbers, actual numbers will be higher.
In the future, we plan to further explore the visit characteristics for the cohort of patients with higher than average visit rates. What motivates a patient to require 385 ED visits over three years? For what medical purpose would a patient visit 38 separate EDs? Secondly, given the answers obtained from our first series of questions, we could provide decision support to the EDs for patients with multiple visits to more than one facility. We could therefore alert the emergency provider to seek information from outside of their local system. EDs with adequate resources could then guide patients towards their medical home, resulting in less episodic and more comprehensive care. Third, as part of public health surveillance, this data could allow us to monitor disease progression throughout the community. As influenza or other ailments take hold in a community, these systems could monitor disease progression across the region or State. Lastly, these systems can provide real time data to pre-hospital personnel.15 This information has been shown to be invaluable in order to help pre-hospital personnel triage and treat patients as part of single event or multi-casualty disaster.
Conclusion
Our findings suggest that the apocryphal maxim, “all health care is local” does not accurately characterize ED care in Indiana; a substantial proportion of patients receive care across varied settings among distinct clinical organizations. Our results support the need to test the maxim’s veracity in other clinical jurisdictions as well. Further, we’ve demonstrated that public health surveillance data can be leveraged in novel ways to meaningfully inform our understanding of the nature of ED patient movements among health care institutions.16 The data suggest that particular architectural configurations supporting the query of external systems may be preferable to a distributed “push” model for supporting the informational needs of ED care providers. Additional efforts toward future system integration is necessary to improve the utility of these data sharing networks: (a) because not all EDs are connected within the state the patient crossover rate is likely under-estimated, (b) because patients often seek care across state borders, developing robust inter-state agreements aimed at cross boarder data sharing are needed.17
Acknowledgments
This work was performed at the Regenstrief Institute in Indianapolis, Indiana. This study is supported in part by the CDC through the Indiana Center of Excellence in Public Health Informatics (1P01HK000077-01). We are especially indebted to James Egg and Shahid Khokhar for their work extracting and processing the millions and millions of messages.
References
- 1.Finnell JT, Overhage JM, Dexter PR, Perkins SM, Lane KA, McDonald CJ. Community clinical data exchange for emergency medicine patients. AMIA Annu Symp Proc; 2003. pp. 235–8. [PMC free article] [PubMed] [Google Scholar]
- 2.Niska R, Bhuiya F, Xu J. National Hospital Ambulatory Medical Care Survey: 2007 emergency department summary. Natl Health Stat Report. 2010 Aug;6(26):1–31. [PubMed] [Google Scholar]
- 3.Institute of Medicine Hospital-Based Emergency Care: At the Breaking Point. Washington, DC: National Academy Press; 2006. [Google Scholar]
- 4.111th Congress of the United States of America. American Recovery and Reinvestment Act of 2009 [Google Scholar]
- 5.Cordell WH, Overhage JM, Waeckerle JF. Strategies for improving information management in emergency medicine to meet clinical, research, and administrative needs. Information Management Work Group Acad Emerg Med. 1998 Feb;5(2):162–7. doi: 10.1111/j.1553-2712.1998.tb02604.x. [DOI] [PubMed] [Google Scholar]
- 6.Overhage JM, Dexter PR, Perkins SM, Cordell WH, McGoff J, McGrath R, et al. A randomized, controlled trial of clinical information shared from another institution. Ann Emerg Med. 2002 Jan;39(1):14–23. doi: 10.1067/mem.2002.120794. [DOI] [PubMed] [Google Scholar]
- 7.Grannis S, Wade M, Gibson J, Overhage JM. The Indiana Public Health Emergency Surveillance System: ongoing progress, early findings, and future directions. AMIA Annu Symp Proc; 2006. pp. 304–8. [PMC free article] [PubMed] [Google Scholar]
- 8.Maciejewski R, Rudolph S, Hafen R, Abusalah AM, Yakout M, Ouzzani M, et al. A visual analytics approach to understanding spatiotemporal hotspots. IEEE Trans Vis Comput Graph. 2010 Mar-Apr;16(2):205–20. doi: 10.1109/TVCG.2009.100. [DOI] [PubMed] [Google Scholar]
- 9.Maciejewski R, Hafen R, Rudolph S, Tebbetts G, Cleveland WS, Ebert DS, et al. Generating synthetic syndromic-surveillance data for evaluating visual-analytics techniques. IEEE Comput Graph Appl. 2009 May-Jun;29(3):18–28. doi: 10.1109/mcg.2009.43. [DOI] [PubMed] [Google Scholar]
- 10.Grannis S, Egg J, Ribeka N. RecMatch: Probabilistic Patient Record Matching. 2008. 1.0 ed.
- 11.Gephi Version 0.7 (beta). [March 11, 2011]; Available from: http://www.gephi.org.
- 12.Noack A. Unified Quality Measures for Clusterings, Layouts, and Orderings of Graphs, and Their Application as Software Design Criteria. Brandenburg: Brandenburg Technical University; 2007. [Google Scholar]
- 13.Department of Health and Human Services . Summary of the NHIN Prototype Architecture Contracts2007 5/31/2007. [Google Scholar]
- 14.Franco C, Toner E, Waldhorn B, O’Toole T, Inglesby T. Systemic Collapse: Medical Care. The Aftermath Of Hurricane Katrina. Biosecurity And Bioterrorism: Biodefense Strategy, Practice, And Science. 2006;4(2) doi: 10.1089/bsp.2006.4.135. [DOI] [PubMed] [Google Scholar]
- 15.Finnell JT, Overhage JM. Emergency medical services: the frontier in health information exchange. AMIA Annu Symp Proc. 2010;2010:222–6. [PMC free article] [PubMed] [Google Scholar]
- 16.Stokes-Buzzelli S, Peltzer-Jones JM, Martin GB, Ford MM, Weise A. Use of health information technology to manage frequently presenting emergency department patients. West J Emerg Med. 2010 Sep;11(4):348–53. [PMC free article] [PubMed] [Google Scholar]
- 17.Fowler B, Wade M, Campbell R, DeFrancesco S, Grannis S. Enhancing Syndromic Surveillance through Cross-border Data Sharing. International Society for Disease Surveillance Annu Symp Proc. 2008 [Google Scholar]


