

Abstract
Circadian rhythm is a fundamental biological system involved in the regulation of various physiological functions. However, little is known about a nature or function of circadian clock in human primary cells. In the present study, we have applied in vitro real time circadian rhythm monitoring to study human clock properties using primary skin fibroblasts. Among factors that affect human physiology, slightly lower extracellular pH was chosen to test its effects on circadian rhythm expression. We established human primary fibroblast cultures obtained from three healthy subjects, stably delivered a circadian reporter gene Bmal1-luciferase, and recorded circadian rhythms in the culture medium at pH 7.2 and pH 6.7. At pH 7.2, robust and sustained circadian rhythms were observed with average period length 24.47 ± 0.03 h. Such rhythms were also found at pH 6.7; however, period length was significantly shortened to 22.60 ± 0.20, amplitude was increased, and damping rate was decreased. The effect of exposure to low pH on the period length was reversible. The shortened period was unlikely caused by factors affecting cell viability because cell morphology and MTT assay showed no significant difference between the two conditions. In summary, our results showed that the circadian rhythm expression is affected at pH 6.7 in human primary fibroblasts without affecting cell viability.
Keywords: Real time bioluminescence monitoring, Circadian rhythm, Peripheral oscillator, Human primary skin fibroblast, pH, Period
1. Introduction
Circadian rhythms are periodic cycles of molecular, physiological and behavioral processes that last for approximately 24 hours. In mammals, the central clock, localized to the suprachiasmatic nucleus (SCN) of the hypothalamus, synchronizes circadian functions within the body [1]. The clock mechanisms consist of transcriptional and translational feedback loops of circadian clock genes and their proteins. In addition to the central clock, peripheral circadian oscillators have been identified in many types of central and peripheral cells. Sustained peripheral circadian rhythms show similar patterns of circadian clock gene expression as the SCN neurons, suggesting that circadian machinery is similar, if not exactly the same, between the central and peripheral cells [1–3]. Taking advantage of such similarity in clock machinery between the central clock and peripheral clock, Brown and his colleagues applied real time in vitro circadian rhythm monitoring in human primary skin fibroblasts using a luciferase reporter gene driven by the promoter of the circadian clock gene Bmal1 [4]. Therefore, we now have a strategy to study the nature of human peripheral circadian clocks in primary cells.
It has been reported in numerous previous studies that circadian rhythm expression responds to a series of external and internal stimuli, such as light, certain neurotransmitters, and lithium. Our previous studies have shown that SP600125, an inhibitor of one of the mitogen-activated protein kinases (MAPKs) c-Jun N-terminal kinase (JNK) extends the period length in the SCN and peripheral fibroblast cells [3]. Furthermore, we have shown that serotonin reuptake inhibitors similarly shorten the period length in the SCN and fibroblasts [5]. These results suggest that the fibroblast is a suitable model to study the effects of external stimuli on circadian rhythm generation.
It is now well accepted that circadian functions are affected in certain diseases [6–8]. Although a proper circadian function is well appreciated, less is understood about the nature of the human circadian clock, its machinery, functions or implication in the regulation of proper physiological conditions. In this study we therefore have applied the in vitro real time circadian rhythm monitoring technique with the Bmal1-luciferase reporter, to study the property of circadian clocks in human primary skin fibroblasts. We focused on the impact of slightly acidic extracellular condition on circadian rhythm expression. This is relevant because very little is known about any relationship between circadian rhythms and decreased extracellular pH, which is associated with a number of disease states, such as ischaemia and cancer [6,8].
2. Materials and methods
2.1. Study participants
The investigation was carried out in accordance with the Declaration of Helsinki, and the study protocol was reviewed and approved by the institutional review board at both Morehouse School of Medicine and Emory University. Signed informed consents were obtained after the purpose and procedures of the study had been fully explained. Three healthy subjects who have shown to have no known pre-existing medical conditions participated. These subjects were on no medication, and had no disease or disorder. One male and two females participated with average age 38.67 ± 13.05 (mean ± SD, ranged from 25 to 40).
2.2. Cell culture
Detailed method for fibroblast culture is described in previous our studies [3]. Fibroblasts isolated from a 2-mm skin biopsy were cultured in Minimum Essential Medium supplemented with 20 % new born calf serum, 100 units/mL antibiotics and 100 µg/mL L-glutamin at 37 °C in 5 % CO2 and 95 % air atmosphere culture incubator. Fibroblasts stably expressing Bmal1-luciferase (a gift from Dr. S. Brown) were prepared by adding Bmal1-luciferase lentivirus to the fibroblast cultures (prepared at PENN VECTOR Gene Therapy Program, School of Medicine, University of Pennsylvania, Philadelphia, PA). Three days before circadian rhythm monitoring, 5×10⁵ fibroblasts with Bmal1-luciferase reporter gene were seeded in a 35 mm Petri dish. Circadian rhythms among cells were synchronized by stimulating fibroblasts using 100 nM dexamethasone (Sigma-Aldrich, St. Louis, MO) for 1 h, after which the medium was replaced with monitoring medium (see detailed in [3,4]). pH of the monitoring medium was adjusted by adding HCl to the monitoring medium until the desired pH was reached (neutral medium, pH 7.20; acid medium, pH 6.70). pH was immediately measured after medium was warmed in a culture incubator at 37 °C, and immediately after termination of circadian rhythm recording.
2.3. Microarray analysis
Detailed procedures for microarray analysis were described in our previous papers [9–12]. In brief, total RNA was isolated using RNeasy kit (Qiagen, Valencia, CA) according to the manufacturer’s protocol, followed by DNase I treatment. cDNA was then synthesized using oligo T7-(dT)24 primer. Double-stranded cDNA was used for in vitro transcription to synthesize biotin-labeled cRNA. Fifteen micrograms of the fragmented cRNA was then hybridized to a Human Gene Expression U133 Array GeneChip (Affymetrix, Santa Clara, CA). A single GeneChip was used to process cRNA sample obtained from one subject, and the whole procedure was repeated. Therefore, two GeneChips were used to analyze the sample obtained from one subject, and a total of six GeneChips were used in this study. GeneChips were hybridized at 45 °C for 16 h, stained with streptavidin–phycoerythrin, and scanned according to the manufacturing protocols.
Affymetrix GeneChip® Operating Software (GCOS) was used to normalize and analyze data for each GeneChip. Detection P value was used to statistically determine whether a transcript was expressed on a GeneChip. The software generated a present (P), marginal (M) or absent (A) call for each transcript based on the P value.
2.4. Bioluminescence monitoring and data analysis
Detailed procedures were described in previous our studies [3,5]. In brief, bioluminescence rhythms were recorded in a real-time bioluminescence monitoring system (Lumicycle, Actimetrics, Wilmette, IL, USA) for six consecutive days. Fibroblasts in petri dishes were placed in a light-tight chamber placed in a 37 °C culture incubator. Bioluminescence data analysis was performed using the Lumicycle data analysis software. The raw data was subjected to baseline correction, performed by fitting a polynomial curve to the data. This is accomplished by subtracting baseline fit curve from raw data and the resulting baseline-subtracted data was used to determine the circadian period length. A chi-square analysis was performed to establish whether or not there is a significant circadian rhythm. In all the cases, significant circadian rhythms were observed and, therefore, subsequent analyses were performed. The estimated period was obtained from a Fourier transform of the records: the software fits the data to a sine wave multiplied by an exponential decay:
L = Asin (2π/P-t0) × e−t/day
where L is the bioluminescence in counts/s, i.e. the photon counts emitted per second as represented in the corresponding figures, P is the period in hours, t0 is the phase in cycles relative to the start of the fitted portion of the data, A is the amplitude in counts/s and d is the exponential damping time constant in days. The time points of the peaks and troughs of the baseline-subtracted data are fitted to the dominant sine wave and then fitted to an exponential decay. The damping rate was defined as the number of days necessary for the amplitude of the rhythm to decrease to 1/e (≈36.79 %) of its initial value.
At least four Petri dishes were prepared for each experimental condition, and the average values represented as N=1 set. The data were obtained from at least four independent sets of experiments. Average values obtained from at least four sets of experiments represented N=1 subject.
2.5. MTT cell viability assay
Cell viability was evaluated by measuring 3-(4,5-dimethylthiazol-2-yl)-2,5-diphenyl tetrazolium bromide (MTT, Sigma,St. Louis, MO, USA) dye absorbance in cells by following the manufacturer’s directions. In brief, MTT compound was added to cell culture dishes at the end of circadian rhythm recording, and culture dishes were incubated at 37 °C for 2 h. Absorbance at 570 nm and 690 nm were measured using a plate reader Spectra Max 190 (Molecular Devices Corporation, Sunnyvale, CA). Absorbance at 690 nm was subtracted from that at 570 nm to adjust the background level in each well. The percentage of viable cells was represented relative to control values (cells in neutral medium).
2.6. Statistical analysis
The data were analyzed using non-parametric tests. A P-value of less than 0.05 was considered significant for the results. Values shown in figures are means ± S.E.M.
3. Results
3.1. Characterization of skin fibroblasts
Seven genes that are highly expressed in fibroblasts but not in keratinocytes were selected to test their gene expression levels in our cell lines (Table 1). In all the three cell lines, Lysosomal-associated membrane protein 1 (LAMP1), Glycoprotein nmb (GPNMB), Vimentin (VIM), Insulin-like growth factor binding protein 6 (IGFBP6), Metallothionein 1F (MT1F), Glutaredoxin (GLRX) and Metallothionein 1H (MT1H) were similarly expressed. On the contrary, keratinocyte markers, Keratin 14 (KRT14), Keratin 5 (KRT5), Small proline-rich protein 1B (SPRR1B) and Lectin galactoside-binding soluble 7 (LGALS7) were expressed only below threshold levels (absent).
Table 1.
Expression of fibroblast and keratinocyte markers in human primary fibroblasts.
| Genes | Symbol | Subject1 | Subject2 | Subject3 |
|---|---|---|---|---|
| Fibroblast markers | ||||
| Lysosomal-associated membrane protein 1 | ||||
| LAMP1 | 13365.16 P | 11335.14 P | 10476.87 P | |
| Glycoprotein (transmembrane) nmb | GPNMB | 8277.36 P | 7113.17 P | 6884.96 P |
| Vimentin | VIM | 29085.51 P | 10813.40 P | 31810.28 P |
| Insulin-like growth factor binding protein 6 | ||||
| IGFBP6 | 3851.35 P | 11885.45 P | 6001.85 P | |
| Metallothionein 1F | MT1F | 2917.07 P | 4173.85 P | 6567.71 P |
| Glutaredoxin (thioltransferase) | GLRX | 4246.43 P | 3587.23 P | 3868.10 P |
| Metallothionein 1H | MT1H | 6146.21 P | 5404.89 P | 18790.66 P |
| Keratinocyte markers | ||||
| Keratin 14 | KRT14 | 5.17 A | 8.64 A | 13.75 A |
| Keratin 5 | KRT5 | 6.60 A | 6.37 A | 9.77 A |
| Small proline-rich protein 1B | SPRR1B | 27.62 A | 16.02 A | 20.13 A |
| Lectin galactoside-binding soluble | 7LGALS7 | 14.42 A | 7.13 A | 11.44 A |
P, PRESENT; A, ABSENT.
To further characterize which type of fibroblasts are dominated in the cell lines, additional gene expression was analyzed (Table 2). In all the three cell lines, Collagen, type I, alpha 1 (COL1A1), Collagen, type I, alpha 2 (COL1A2) and Collagen, type III, alpha 1 (COL3A1) were highly expressed. Tenascin XB (TNXB) was less abundant, whereas Tenascin C levels were more than TNXB. Comparing Versican (VCAN) and Decorin (DCN) levels, DCN levels were higher than VCAN in all the three cell lines.
Table 2.
Expression of fibroblast markers in human primary fibroblasts.
| Genes | Symbol | Subject1 | Subject2 | Subject3 |
|---|---|---|---|---|
| Collagen, type I, alpha 1 | COL1A1 | 32293.08 | 18255.15 | 45480.64 |
| Collagen, type I, alpha 2 | COL1A2 | 51503.90 | 20400.66 | 47532.24 |
| Collagen, type III, alpha 1 | COL3A1 | 35347.56 | 18144.89 | 29928.39 |
| Tenascin XB | TNXB | 61.41 | 36.11 | 40.38 |
| Tenascin C | TNC | 3935.48 | 3636.41 | 3778.63 |
| Versican | VCAN | 8241.01 | 4305.13 | 4646.42 |
| Decorin | DCN | 26391.33 | 15190.18 | 21557.77 |
3.2. The effects of low pH on circadian rhythm expression
As shown in Fig. 1A robust and sustained circadian Bmal1-driven bioluminescence rhythms were recorded from human primary skin fibroblasts in a pH 7.2 culture medium. Average period length among the three subjects was 24.47 ± 0.03 h. Similar to the recordings at pH 7.2, robust and sustained circadian bioluminescence rhythms were obtained even in the slightly acidic medium (pH 6.7; Fig. 1A). However, the period length was significantly shortened in all the three cell lines tested (22.60 ± 0.20, N=3 subjects; Fig. 1A, right panel, P < 0.0005), amplitude was increased from 116.57 ± 6.97 to 241.90 ± 18.27 (Fig. 1B left, P < 0.005), and damping rate was decreased from 3.87 to 2.39 day (Fig. 1B right, P < 0.011).
Figure 1.
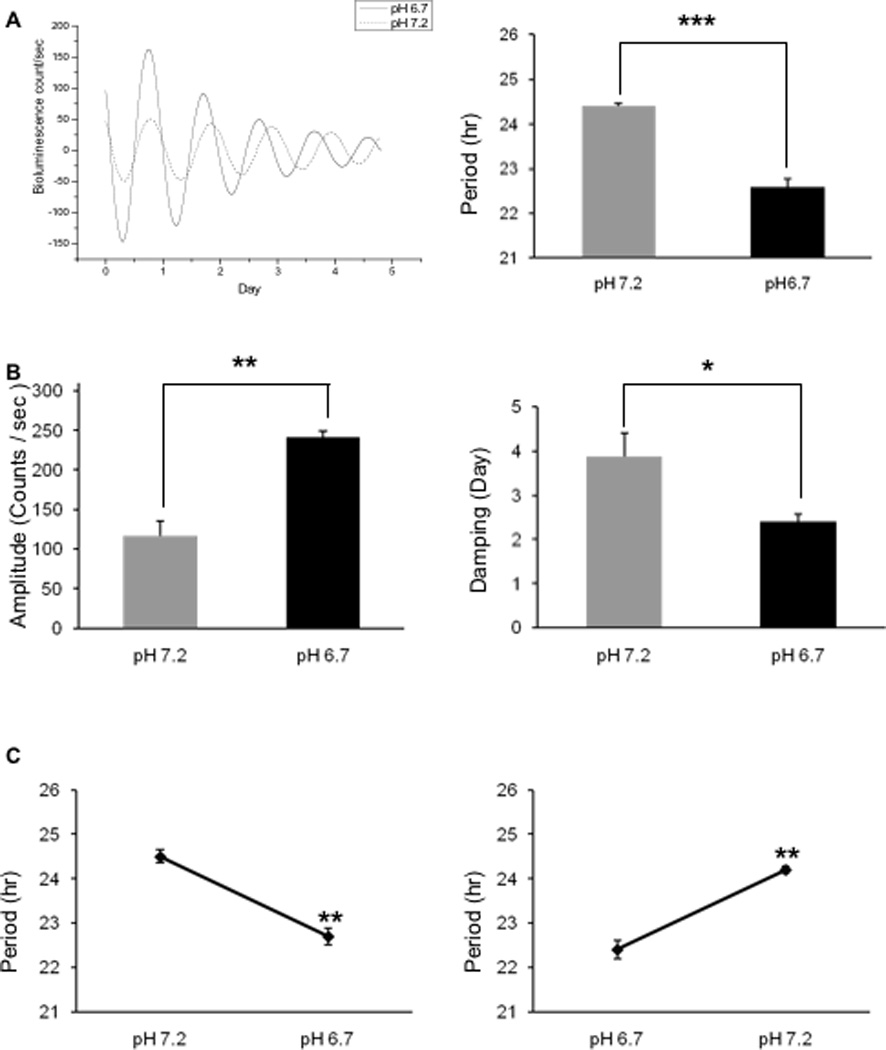
Altered circadian rhythm expression at pH 6.7 in human primary skin fibroblasts. Fibroblasts were cultured in culture medium either at pH 7.2 or pH 6.7, and circadian rhythms were recorded for six days. (A) Left. Robust and sustained Bmal1 promoter driven bioluminescence rhythms were observed at both pH 7.2 and pH 6.7. Right. At pH 6.7 the period length was significantly shortened. (B) The damping rate was shortened and amplitude was increased at pH 6.7. (C) Circadian rhythms were recorded at pH 7.2 or pH 6.7 and, then, rhythms were monitored again at the alternate pHs. Irrespective of orders used for different pH treatment, incubation at pH 6.7 consistently shortened the period lengths. *, P < 0.05; **, P < 0.005; ***, P < 0.0005. Values are means ± S.E.M. N=3 subjects.
The effects of exposure to the slightly low pH were reversible, since pre-exposure to neither pH 7.2 or 6.7 affected the period length when cells were consequently incubated in the alternate culture medium (Fig. 1C; pre-pH 6.7 vs post-pH 7.2, P < 0.001; pre-pH 7.2 vs post-pH 6.7, P < 0.002; both pre-pH 6.7 vs post-pH 6.7 and pre-pH 7.2 vs post-pH 7.2, P > 0.210).
After monitoring circadian rhythms for six days, culture medium was removed and its pH was immediately measured. Both pHs showed a reduction of less than 0.1.
3.3. The effects of low pH on the cell viability
Cell viability was also measured to determine if it was affected by the acidic condition (Fig. 2). Cells cultured at pH7.2 and pH6.7 both showed very similar cell morphology and appearance (Fig. 2, upper panels). The MTT assay showed that there was no significant difference in absorbance between pH7.2 and pH6.7 culture conditions (Fig. 2, lower figure, P > 0.05).
Figure 2.
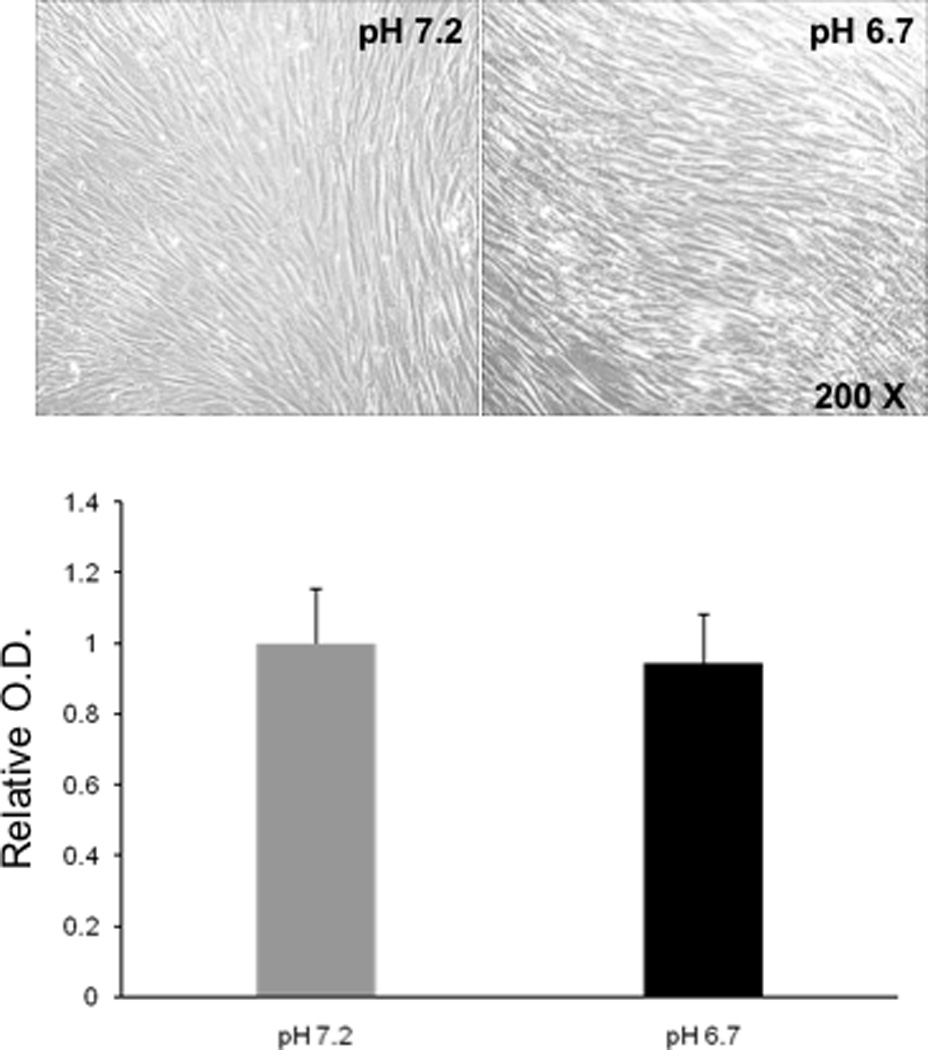
Cell morphology or cell viability was not significantly affected by exposure to the low pH. Cell morphology and MTT assay were examined six days after the initiation of rhythm recordings. Similar cell morphology was observed at both pH 6.7 and pH 7.2 (upper). The MTT assay showed no significant difference in the absorbance that indicates that amount of metabolic activity between pH 6.7 and pH 7.2 conditions was the same. Values are means ± S.E.M. N=3 subjects.
4. Discussion
In the present study we established primary fibroblast cell lines from human skin biopsies, applied the in vitro real time circadian rhythm monitoring method with Bmal1-luciferase reporter gene, and recorded circadian rhythms in those cells.
A skin biopsy consists of heterogeneous cell populations that include keratinocytes and fibroblasts [13]. Even fibroblasts originating in a skin piece are classified into at least two types of fibroblast, namely papillary dermal fibroblasts and reticular fibroblasts [14]. To characterize three primary fibroblast cell lines that we established, marker gene expression was determined (Tables 1, 2). To distinguish between keratinocytes and fibroblasts, eleven genes were selected that are highly expressed either in keratinocytes or fibroblasts [13]. Based on the observation that all the fibroblast markers are present but keratinocyte markers are absent, it appears that the three cell lines consist of fibroblasts. In addition, those cells are rich in Collagen I and III, and they express more DCN than VCAN that are characteristics of papillary dermal fibroblasts than reticular fibroblasts [14]. Therefore, our results suggest that majority of cells, if not all, are papillary fibroblasts in three cell lines.
After delivering Bmal1-luciferase DNA into human primary fibroblasts using lentivirus, robust and sustained circadian rhythms are recorded in three cell lines (Fig. 1). As originally reported by Brown and his colleagues, we observed that the average period length among the three subjects is about 24.5 h (Fig. 1A) that suggests that our method is fully optimized. When the pH was decreased to 6.7, the period length was significantly shortened (Fig. 1A). The decreased extracellular pH similarly affected the period length among the three subjects’ samples since no inter-individual difference was observed. Furthermore, exposing cells to pH 6.7 did not have any permanent effects on circadian rhythm expression because the impact of the acidic condition was reversible (Fig. 1C). Similarly, amplitudes and damping rates were significantly affected by exposing cells to pH 6.7 culture medium (Fig. 1B). It is worth to note that the period length is more sensitive to slightly acidic conditions than slightly alkaline environment because we did not find significant impact of pH 7.8–8.0 culture media on the period length (unpublished observation).
The optimum pH for human fibroblasts varies from 6.9 to 7.8 [15]. For this study, complete culture medium was adjusted to a pH of 6.7 that falls outside the optimal growth range for fibroblasts [16]. Previous studies have shown that a pH range of 6.8 – 8.2 enhances human-human hybridoma (HB4C5) cell viability, while ranges outside demonstrates a decrease in cell viability [15]. Ceccarine and Eagle [16] found that the rate of growth of skin and lung fibroblasts, whether normal, cancer or virus-transformed, were markedly pH dependent. In our study, we however found that cell viability was not significantly affected by culturing cells at pH 6.7 for up to seven days that is assessed by visual cellular inspection and the MTT cell viability assay (Fig. 2).
Although previous studies have shown the effects of different extracellular pH on cell viability, the effect of various pH on circadian rhythms is less studied. West [17] investigated the effect of pH on the sporulation rhythms in Neurospora Crassa. Ruoff et al. [18] observed that increasing extracellular and intracellular pH shortens the period length of the rhythms in Neurospora Crassa clock mutants due to degradation of the FRQ protein. Lowering the extracellular pH abolishes the circadian rhythm in Bulla [19].
In mammals extracellular fluid shows various pH depending on the tissues and organs. For example, very low pH is found in the digestive organs, while plasma pH ranges 7.35–7.45. In saliva it varies from 6 to 8, and acidic pH is found in urine. It would be of interest to test the impact of various range of pH on clock functions in cells from different peripheral tissues and organs. It is speculated that cellular clock machinery is similar among different cell types and therefore the period length would be significantly affected by extracellular pH. The central clock in the SCN may contribute to synchronizing peripheral clocks among different peripheral tissues and organs. Alternatively, it would be more interesting to find that the impact of extracellular pH differs depending on the cell types.
The cause and mechanisms how the decreased extracellular pH shortens the period length are currently unknown. Besides, investigating the effect of various pH on circadian rhythm expression using human cells will help us understanding implication of altered circadian rhythms in pathological conditions, such as cancers and ischaemia [6,8].
In conclusion, we found that slightly acidic extracellular condition (pH6.7) significantly affects circadian rhythm expression in human primary fibroblasts. Although further studies will be necessary, any health consequences caused by decreased extracellular pH may involve affected circadian rhythm expression.
Highlights.
Robust and sustained circadian rhythms are observed at pH 6.7 and 7.2.
At pH 6.7 period length is about two hours shortened and amplitude is increased.
The effects of exposure to pH 6.7 on the period are reversible.
Acknowledgements
The authors would like to thank Dr. S. Brown and Dr. U. Schibler for a generous gift of a Bmal1-luciferase DNA construct. The authors would like to thank Dr. Brown for his invaluable suggestions. The Molecular Core, including the LumiCycle and Affymetix microarray suites was supported by Keck Foundation. The Affymetrix gene profile was obtained by Dr. B. Ford, Dr. G. Ford, and A Gates at the Keck Molecular Core. Bmal1-luciferase lentivirus was prepared at PENN VECTOR Gene Therapy Program, School of Medicine, University of Pennsylvania. This study was supported by the NIH grants NS060659, NCRR/RCMI G12-RR03034 and 5P20RR11104, and 21MD000101 from the National Center on Minority Health and Health Disparities.
Footnotes
Publisher's Disclaimer: This is a PDF file of an unedited manuscript that has been accepted for publication. As a service to our customers we are providing this early version of the manuscript. The manuscript will undergo copyediting, typesetting, and review of the resulting proof before it is published in its final citable form. Please note that during the production process errors may be discovered which could affect the content, and all legal disclaimers that apply to the journal pertain.
References
- 1.Ko CH, Takahashi JS. Molecular components of the mammalian circadian clock. Hum. Mol. Genet. 2006;15:271–277. doi: 10.1093/hmg/ddl207. [DOI] [PubMed] [Google Scholar]
- 2.Fukuhara C, Tosini G. Peripheral circadian oscillators and their rhythmic regulation. Front Biosci. 2003;8:642–651. doi: 10.2741/1042. [DOI] [PubMed] [Google Scholar]
- 3.Chansard M, Mlyneux P, Nomura K, Harrington ME, Fukuhara C. c-Jun N-terminal kinase inhibitor SP600125 modulates the period of mammalian circadian rhythms. Neurosci. 2007;145:812–823. doi: 10.1016/j.neuroscience.2006.12.037. [DOI] [PMC free article] [PubMed] [Google Scholar]
- 4.Brown SA, Fleury-Olela F, Nagoshi E, C, et al. The period length of fibroblast circadian rhythm gene expression varies widely among human individuals. PLoS Biol. 2005;3:1813–1818. doi: 10.1371/journal.pbio.0030338. [DOI] [PMC free article] [PubMed] [Google Scholar]
- 5.Nomura K, Castanon-Cervantes O, Davidson A, Fukuhara C. Selective serotonin reuptake inhibitors and raft inhibitors shorten the period of Period1-driven bioluminescence rhythms in rat-1 fibroblasts. Life Sci. 2008;82:1169–1174. doi: 10.1016/j.lfs.2008.03.024. [DOI] [PMC free article] [PubMed] [Google Scholar]
- 6.Cobbe SM, Poole-Wilson PA. The time of onset and severity of acidosis in myocardial ischaemia. J. Mol. Cell Cardiol. 1980;12:745–760. doi: 10.1016/0022-2828(80)90077-2. [DOI] [PubMed] [Google Scholar]
- 7.Maury E, Ramsey KM, Bass J. Circadian rhythms and metabolic syndrome: from experimental genetics to human disease. Circ. Res. 2010;106:447–462. doi: 10.1161/CIRCRESAHA.109.208355. [DOI] [PMC free article] [PubMed] [Google Scholar]
- 8.Wojtkowiak JW, Verduzco D, Schramm K, Gillies RJ. Drug resistance and cellular adaptation to tumor acidic pH microenvironment. Mol. Pharm. 2011 Oct;7 doi: 10.1021/mp200292c. [Epub ahead of print] [DOI] [PMC free article] [PubMed] [Google Scholar]
- 9.Fukuhara C, Dirden JC, Tosini G. Analysis of gene expression following norepinephrine stimulation in the rat pineal gland using DNA microarray technique. J. Pin. Res. 2003;35:196–203. doi: 10.1034/j.1600-079x.2003.00078.x. [DOI] [PubMed] [Google Scholar]
- 10.Xu Z, Ford GD, Croslan DR, Jiang J, Gates A, Allen R, Ford BD. Neuroprotection by neuregulin-1 following focal stroke is associated with the attenuation of ischemia-induced pro-inflammatory and stress gene expression. Neurobiol. Dis. 2005;19:461–470. doi: 10.1016/j.nbd.2005.01.027. [DOI] [PubMed] [Google Scholar]
- 11.Ford GD, Ford BD, Steele EC, Jr, Gates A, Hood D, Matthews MA, Mirza S, Macleish PR. Analysis of transcriptional profiles and functional clustering of global cerebellar gene expression in PCD3J mice. Biochem. Biophys. Res. Commun. 2008;377:556–561. doi: 10.1016/j.bbrc.2008.10.033. [DOI] [PMC free article] [PubMed] [Google Scholar]
- 12.Fukuhara C, Tosini G. Analysis of daily and circadian gene expression in the rat pineal gland. Neurosci. Res. 2008;60:192–198. doi: 10.1016/j.neures.2007.10.011. [DOI] [PMC free article] [PubMed] [Google Scholar]
- 13.Curto EV, Lambert GW, Davis RL, Wilborn TW, Dooley TP. Biomarkers of human skin cells identified using DermArray DNA arrays and new bioinformatics methods. Biochem. Biophys. Res. Commun. 2002;291:1052–1064. doi: 10.1006/bbrc.2002.6542. [DOI] [PubMed] [Google Scholar]
- 14.Sorrell JM, Caplan AI. Fibroblast heterogeneity: more than skin deep. J. Cell Sci. 2004;117:667–675. doi: 10.1242/jcs.01005. [DOI] [PubMed] [Google Scholar]
- 15.Zungu IL, Evans DH, Houreld N, Abrahamse H. Biological responses of injured human skin fibroblasts to assess the efficacy of in vitro models for cell stress studies. African J. Biochem. Res. 2007;1:60–71. [Google Scholar]
- 16.Ceccarine C, Eagle H. pH as a determinant of cellular growth and contact inhibition. Proc. Nat. Acad. Sci. USA. 1971;68:229–233. doi: 10.1073/pnas.68.1.229. [DOI] [PMC free article] [PubMed] [Google Scholar]
- 17.West DJ. Effect of pH and biotin on a circadian rhythm of conidiation in Neurospora crassa. J. Bacteriol. 1975;123:387–389. doi: 10.1128/jb.123.1.387-389.1975. [DOI] [PMC free article] [PubMed] [Google Scholar]
- 18.Ruoff P, Behzadi A, Hauglid M, Vinsjevik M, Havas H. pH homeostasis of the circadian sporulation rhythm in clock mutants of Neurospora Crassa. Chronobiol. Int. 2000;17:733–750. doi: 10.1081/cbi-100102109. [DOI] [PubMed] [Google Scholar]
- 19.Khalsa SB, Ralph MR, Block GD. Does low intercellular pH stop the motion of the Bulla circadian pacemaker? J. Neurosci. 1991;1:2672–2679. doi: 10.1523/JNEUROSCI.11-09-02672.1991. [DOI] [PMC free article] [PubMed] [Google Scholar]