

Abstract
As plant research moves to a “post-genomic” era, many diverse internet resources become available to the international research community. Arabidopsis thaliana, because of its small size, rapid life cycle and simple genome, has been a model system for decades, with much research funding and many projects devoted to creation of functional and structural genomics resources. Different types of data, including genome, transcriptome, proteome, phenome, metabolome and ionome are stored in these resources. In this chapter, a variety of genomics resources are introduced, with simple descriptions of how some can be accessed by laboratory researchers via the internet.
INTRODUCTION
After the sequencing of the Arabidopsis thaliana genome was completed in 2000 (Arabidopsis Genome Initiative, 2000), a variety of new genomics resources were created by Arabidopsis researchers. Some examples include large numbers of genetic polymorphisms (Jander et al., 2002;Törjék et al., 2003; Borevitz et al., 2007), homozygous T-DNA populations from the Salk Institute (Alonso and Ecker, 2006) and genome-wide expression data from researchers around the world (Schmid et al., 2005; Kilian et al., 2007). Different types of data, such as DNA, RNA, protein and phenotype have been deposited in resources of different scales, including large-scale public repositories (for example, GenBank), community-specific databases (for example, TAIR) and projectspecific databases (for example, Purdue Ionomics Information Management System). The three types of biological databases were reviewed by Rhee and Crosby (2005).
While large-scale public repositories and Arabidopsis community-specific database resources are widely accessed by Arabidopsis researchers, the use of most project-specific resources is limited to a small sector of the community—mainly those involved in these projects. To encourage Arabidopsis researchers to use and develop databases, this chapter introduces a variety of genomic resources. According to the types of data stored, these resources can be classified into genomic data (such as in genome browsers, mutant databases, and polymorphisms), transcriptomic information (mRNA expression databases, cDNA and EST databases, and co-expression analysis tools), proteomics (such as protein expression databases and protein-protein interaction databases), phenomics and metabolomics. We have not tried to comprehensively list all resources. For example, a wide array of useful NCBI resources, including PubMed and GenBank, are accessible through Entrez. Instead, a subset of Arabidopsis-centric web tools were selected that we and our colleagues find to be useful. Web resources that are judged to be especially useful to entry level or occasional users are highlighted. Given how rapidly websites and genomics tools are created and disappear, it is expected that some of the specific information in this chapter will go out of date very quickly.
1. GENOMICS
1.1. Genome browsers
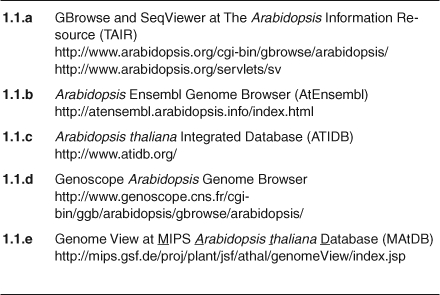
As the variety and extent of data mapped to the Arabidopsis genome increases, the need to visualize genomic annotation and features from many resources in a single viewer increases (Swarbreck et al., 2008). This type of tool offers Arabidopsis researchers highly configurable displays for viewing genomic annotations, including gene models, transcript evidence, markers, clones, T-DNA and transposon insertions, and polymorphisms. Here are two examples of genome browsers:
1.1.a. GBrowse and SeqViewer at The Arabidopsis Information Resource (TAIR)
TAIR (http://www.arabidopsis.org/) is the most commonly used genomic resource for Arabidopsis. TAIR has the complete genome sequence for Arabidopsis thaliana ecotype Col-0, inferred or experimentally supported gene structures, a variety of gene product information, and genome maps. TAIR incorporates Gene Ontologies (GO) and Plant Ontologies (PO) in their descriptions of genes and gene products. GBrowse at TAIR provides a variety of useful information about a region of chromosome specified by the user. It is relatively easy to learn how to use, and the interface intuitively permits the user to see a diverse set of data. The display behavior is controllable by the user: displaying ‘Tracks’ allows the user to choose the information to display or hide (remember to click ‘Update Image’ to change the display after changing the behavior of the browser). ‘Display Settings’ is used to choose how information is displayed. Clicking on different elements (for example, a cDNA model or polymorphism) opens up a new window with detailed information about the element selected. The interface of SeqViewer is not as configurable as that of GBrowse. However, if the users want to download the sequence of a certain gene, they can click the sequence ruler. This will open 10 kb sequence window with exons and introns coded with upper and lower cases. Users can highlight any region and paste into desktop applications, such as DNAStar and Jellyfish.
1.1.b. Arabidopsis Ensembl Genome Browser (AtEnsembl)
AtEnsembl displays similar features as GBrowse and is also user friendly. For users that are accustomed to other Ensembl genome browsers, such as Ensembl Homo sapiens and Ensembl Mus musculus, they might find AtEnsembl easier to use. As with GBrowse, AtEnsembl allows users to upload their own annotations.
More examples of genome browsers are listed in Table 1.1. One important feature to consider when using these resources is whether the information is up to date. For example, as of this writing, TAIR v. 8.0 is the most recent available Arabidopsis genome annotation release (released in April 2008). AtEnsembl displays TAIR v. 8.0, MIPS annotations from 2004, and other features such as inserts stocked at NASC, Affymetrix probes and other alignment data (James et al., 2007). ATIDB displays TAIR v. 6.0 annotations, Gene Ontology database, and Brassica homologies (Pan et al., 2003). MAtDB (Spannagl et al., 2007) displays TAIR v. 8.0, which includes microRNAs (miRNAs) and transposable element genes. ATIDB, Genoscope, MAtDB and TAIR also allow users to upload their own annotations (Pan et al., 2003; Spannagl et al., 2007; Swarbreck et al., 2008). It is good to choose the tool based on your need. For instance, if a user is interested in finding insertional mutations, T-DNA Express is an excellent place to start. While the interface is not as flexible as GBrowse, as the generator of insertional mutant data, this site traditionally has housed comprehensive and up-to-date information on mutant resources.
Table 1.1.
Genome browsers
1.2. Databases useful for positional cloning
Positional cloning, also called map-based cloning, is an approach that identifies the genetic cause of a mutant phenotype. Comprehensive DNA polymorphism data of various Arabidopsis ecotypes provide markers for traditional genetic mapping and are increasingly important for association genetics (linkage disequilibrium mapping) and evolutionary studies. The high-quality sequence of Arabidopsis Col-0 ecotype (Arabidopsis Genome Initiative, 2000) is the foundation of future sequencing from other ecotypes and populations and development of databases of DNA polymorphisms among these strains. DNA differences among ecotypes include single nucleotide polymorphisms (SNPs) and insertion-deletions (InDels). Besides DNA polymorphisms, knowledge-based ranking of candidate genes is also useful in positional cloning. Examples of databases useful for positional cloning are listed below and in Table 1.2.
Table 1.2.
Databases useful for positional cloning
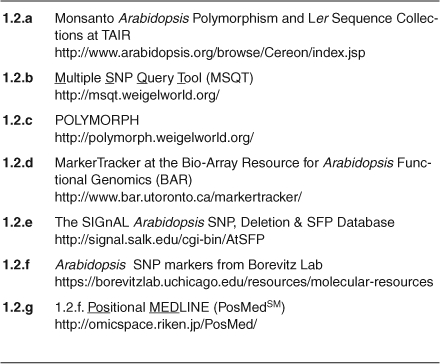
1.2.a. Monsanto Arabidopsis Polymorphism and Ler Sequence Collections at TAIR
This resource contains >37,300 SNPs, >18,500 InDels, and >700 large Indels, a total of 56,670 polymorphisms between Col-0 and Ler. This was derived by comparison of assemblies of the shotgun genomic sequence of Ler with the reference Col-0 sequence (Jander et al., 2002). Polymorphism and Ler sequence data are available to individuals in the not-for-profit research and outreach communities.
1.2.b. Multiple SNP Query Tool (MSQT)
MSQT contains >17,000 SNP and InDel polymorphisms among 96 ecotypes (Nordborg et al., 2005;Warthmann et al., 2007). This tool allows the user to find SNPs and InDels between ecotypes and to develop assays for the detection of the polymorphisms. Once users specify ecotypes, chromosome and position for their query, they can click “Compute SNPs” and the result will be shown on the same page. The user can then click on “assay_development_format” for the flanking sequence around the SNP or InDel. Expert users can query the database with SQL statements.
1.2.c. POLYMORPH
As of this writing, POLYMORPH contains >1,000,000 SNPs among 20 ecotypes (Clark et al., 2007; Warthmann et al., 2007; Zeller et al., 2008). Like MSQT, POLYMORPH is easy to use although it has more features than MSQT. Users can query SNPs by allele frequency, ecotype, AGI codes and positions. Besides SNPs, users can search for polymorphic region predictions (PRPs) and repetitive 25mers. PRPs are a type of prediction that identifies regions of high polymorphism or deletion for which specific polymorphism data cannot be recovered with a given re-sequencing technology (Clark et al., 2007). The GBrowse Viewer in POLYMORPH allows users to display SNPs from any of the 20 ecotypes on the Arabidopsis genome. As with MSQT, POLYMORPH users can visualize the flanking sequence around the SNPs, and even design PCR primers to amplify the fragment.
1.2.d. MarkerTracker at the Bio-array Resource for Arabidopsis Functional Genomics (BAR)
MarkerTracker pre-computed restriction fragment length polymorphisms for a large number of ecotypes (Jander et al., 2002; Nordborg et al., 2005). This tool provides information about PCR primers and predicted restriction fragment lengths in user-defined regions of the genome and it generates virtual gel pictures of potential CAPS markers.
1.2.e. The SIGnAL Arabidopsis SNP, Deletion & SFP Database
This database displays >12,400 unique single-feature polymorphisms (SFPs) among Col-0, Cvi, Ler, Nd-1, Tsu-1 and Ws-2 (Borevitz et al., 2003) and >77,400 SFPs discovered in 23 Arabidopsis ecotypes in comparison with Col-0 (Borevitz et al., 2007) on the Arabidopsis genome. Clicking on different SFPs opens up a new window with detailed information about the SFP.
1.2.f. Arabidopsis SNP markers from the Borevitz Lab
In collaboration with five other labs, the Borevitz lab developed 289 and later 149 more SNP markers for mapping in F2 crosses of various genetic backgrounds. Map-based cloning traditionally involves the detection of DNA polymorphisms across several thousand of F2 plants. In the past few years, new technologies have been developed to detect DNA polymorphisms in a high throughput manner (Jander et al., 2002), for example, the use of oligonucleotide arrays (Gene Chips). Oligonucleotide arrays allows the detection of DNA polymorphisms by differential hybridizations Jander et al., 2002). The steps required for array genotyping and mapping can be found in a methods paper written by Dr. Borevitz.
1.2.g. Positional MEDLINE (PosMedSM)
PosMedSM employs a full-text search against the biological literature with the user's keywords and provides a list of ranked candidate genes associated with the keywords within a certain interval. Users who work on map-based cloning may benefit from using this database. Once the region of interest is narrowed down either by traditional mapping (Jander et al., 2002) or by array mapping Hazen et al., 2005), the user can type in the genomic interval and retrieve a list of genes and mutants within the region. The user can then decide whether certain genes are worth sequencing and certain mutants are worth analyzing.
1.3. Databases useful for reverse genetics
While databases of naturally occurring mutations are an increasingly important tool for functional genomics, ecology and evolutionary biology, induced mutations continue to be important to plant biologists (Alonso et al., 2003). There are various methods to alter the amount or nature of the gene product produced, including ethylmethanesulfonate (EMS), T-DNA, transposon, RNAi and microRNA. Examples of databases that are useful to researchers interested in Arabidopsis reverse genetics are listed below and in Table 1.3.
Table 1.3.
Databases useful for reverse genetics
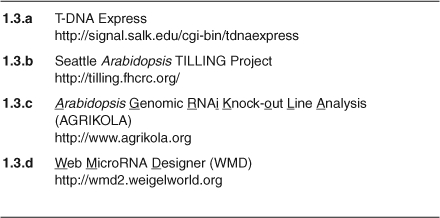
1.3.a. T-DNA Express
This is a comprehensive germplasm database hosted by the Ecker group at Salk Institute, which is regularly updated for lines containing newly identified insertional mutations, or homozygous mutants for previously known alleles (Alonso et al., 2003). Clicking hotlinks of individual mutations opens up a window with detailed information about the mutation. The Ecker group also developed a high-throughput T-DNA Primer Design tool. Users can paste any T-DNA or transposon lines in the box, click ‘Submit’ and retrieve the sequences of the left border and right border primers. To ensure that the wild-type band and the T-DNA band can be separated by agarose gel electrophoresis it is helpful to change the size of the 5′ extension—‘Ext5′ from ‘300’ (default) to ‘500’.
1.3.b. Seattle Arabidopsis TILLING Project
The Seattle Arabidopsis TILLING Project discovers Col-0 ecotype mutants with allelic series of EMS-induced mutations in target 1-kb loci in response to request by the community (Till et al., 2003). This website can be used to request that EMS mutant alleles be identified for a gene of interest. It also contains links to community TILLING projects for other plants.
1.3.c. Arabidopsis Genomic RNAi Knock-out Line Analysis (AGRIKOLA)
The AGRIKOLA website describes the results of high throughput cloning of Arabidopsis DNA sequences into RNAi gene silencing vectors (Hilson et al., 2004). These clones and Arabidopsis lines transformed with the RNAi constructs are distributed by the Nottingham Arabidopsis Stock Center (NASC). The knockdown phenotype and images of silenced lines can be queried by AGI code, CATMA code, gene name, or gene function, through the AGRIKOLA database page.
1.3.d. Web MicroRNA Designer (WMD)
This site has a web-based tool for design of plasmids that encode artificial microRNAs (amiRNAs), which are useful for targeted gene inactivation (Schwab et al, 2006). On the ‘Designer’ page, a user can specify target gene(s), genome release, minimal number of target genes, off-targets and provide an email address to retrieve the list of ranked amiRNA sequences. Good amiRNA sequences are coded with green color and listed at the top. The user can then paste the amiRNA sequences of their interest into the ‘Oligo Design’ page and specify the precursor vector to retrieve four oligo sequences. The four oligo primers are used to engineer the amiRNA into Arabidopsis endogenous precursor miR319a by site-directed mutagenesis. Once the sequence is confirmed, the amiRNA precursor should then be cloned behind a promoter in a transformation vector for introduction into plants.
2. TRANSCRIPTOMICS
2.1. Global gene expression and co-expression databases
Analysis of global gene expression is essential for understanding how complex biological processes are regulated. Large collections of microarray data also contain information about coordinated changes in transcript levels in these datasets. A number of bioinformatics resources have been developed to extract this kind of information for individual genes (Ogata et al., 2008). Different features (such as correlation calculations, clustering analysis, scatter plots and bar graphs) are offered by these resources, each with their own advantages (Steinhauser et al., 2004; Zimmermann et al., 2004; Zimmermann et al., 2005; Manfield et al., 2006;Wei et al., 2006). Here are some databases of global gene expression and tools for visualizing the expression data and gene correlations:
2.1.a. AtGenExpress
AtGenExpress is a database containing original microarray data (abiotic stress, ecotypes, development, hormones, light and pathogen series) and sample descriptions from the AtGenExpress project (Schmid et al., 2005; Kilian et al., 2007). Users can download the data as .txt files or extract the expression profiles of genes of their interest through AtGenExpress Visualization Tool (AVT). Other visualization tools listed below and in Table 2.1 (2.1.c – 2.1.k) offer highly configurable displays of expression data for a gene or genes of interest (Steinhauser et al., 2004; Zimmermann et al., 2004; Toufighi et al., 2005; Zimmermann et al., 2005).
Table 2.1.
Global gene expression and co-expression databases
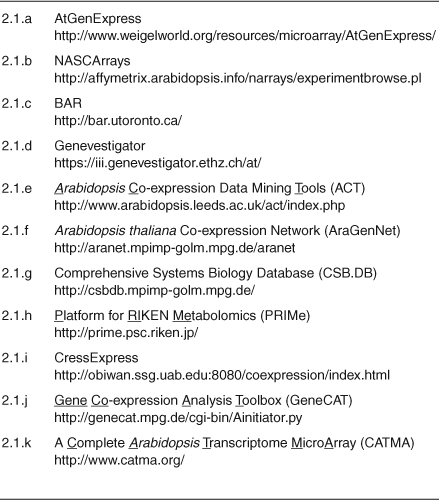
2.1.b. NASCArrays
NASCArrays is another database containing original microarray data. Currently, most of the microarray data in NASCArrays is for Arabidopsis run by the NASC Affymetrix Facility. There are also experiments from other species and experiments run by other centers. Several data-mining tools were developed by NASCArrays, such as Spot History, Two Gene Scatter Plot and Gene Swinger. Unfortunately, users are not allowed to specify which experiments to query while using these tools. However, power users can also download large amounts of data through Super Bulk Gene Download for free or purchase entire datasets on CDs/DVDs through Affywatch.
2.1.c. BAR
BAR contains a number of easy-to-use web-based tools, such as Arabidopsis eFP Browser, Cell eFP Browser, and e-Northerns with Expression Browser (Toufighi et al., 2005;Winter et al., 2007), to visualize expression data from AtGenExpress, BAR, and NASCArrays. When using the expression tools in BAR, it is possible to specify which data set to query. While users can choose multiple experiments within a dataset, they cannot choose multiple datasets in one query. In the case of Arabidopsis eFP Browser, gene expression data are painted onto idealized images of Arabidopsis. It is also possible to use Expression Angler to calculate Pearson correlation coefficients among genes of interest across selected datasets (Toufighi et al., 2005). Alternatively, Sample Angler will compute and visualize correlations between gene expression levels over selected experiments.
2.1.d. Genevestigator
https://iii.genevestigator.ethz.ch/at/
Genevestigator offers user-friendly tools, such as Digital Northern, Gene Atlas, Gene Chronologer and Response Viewer (Zimmermann et al., 2004; Zimmermann et al., 2005), to visualize microarray data from AtGenExpress, NASCArrays, GEO, Array-Express, TAIR, the Gruissem Laboratory, FGCZ and many other sources. When using Digital Northern and Response Viewer, users can specify chip types, chip sources and experiments for their genes of interest. Multiple chip sources and experiments can be chosen in one query. Genevestigator also offers Gene Correlator to study how two genes are co-expressed over selected chips in the database. A scatter plot allows the user to visualize the correlation between the two genes and Pearson's correlation coefficient allows assessment of the robustness of the correlation.
Additional tools for visualizing expression data are listed Table 2.1. While exploring expression data with various visualization or data-mining tools, it is important to be aware of which data sets or experiments were used to generate the output on the screen. Sometimes different resources refer to the same data set or experiment with slightly different names. For users who prefer to compare results from different resources, it is also important know whether these data sets or experiments are exactly the same.
2.2. cDNA and EST databases
Functional analysis of the Arabidopsis genome requires accurate gene structure information and a complete gene inventory. Expressed sequence tags (ESTs) and full-length cDNAs are essential for the correct annotation and functional analysis of genes and their products. Databases for cDNAs and ESTs are listed in Table 2.2. The following are two examples for cDNA and EST databases:
Table 2.2.
cDNA and EST databases
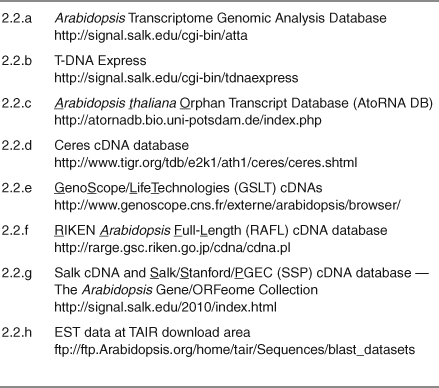
2.2.a. Arabidopsis Transcriptome Genomic Analysis Database
This database displays orphan RNAs (AtoRNAs) (Riaño-Pachón et al., 2005), Ceres cDNAs, Community Full-Length (CFL) cDNAs, GSLT cDNAs (Castelli et al., 2004), RAFL cDNAs (Seki et al., 2002), SALK cDNAs, and SSP cDNAs (Yamada et al., 2003) on the Arabidopsis genome. Icons for cDNAs from different sources are color-coded. Clicking on the icons opens up a new window with detailed information about the cDNA. Users can retrieve more information about the cDNA of interest by clicking GenBank next to the clone id on this page. To download sequences of AtoRNAs, Ceres cDNAs, RAFL cDNAs in bulk, users are encouraged to visit individual web sites.
2.2.b. T-DNA Express
T-DNA Express contains information for the same cDNAs listed the Arabidopsis Transcriptome Genomic Analysis Database, and is easy to use.
2.3. Small RNA databases
Since the discovery of RNA-based silencing systems, there have been some paradigm-shifting changes in understanding gene regulation at the transcriptional and posttranscriptional levels. Small RNAs can be classified into miRNAs, small interfering RNAs siRNAs), trans-acting siRNAs (ta-siRNAs), small nuclear RNAs snRNAs) and others (Vaughn and Martienssen, 2005). Resources are being developed to investigate the function, regulation and evolution of small-RNA-based silencing pathways plants using Arabidopsis as the model system (Table 2.3):
Table 2.3.
Small RNA databases
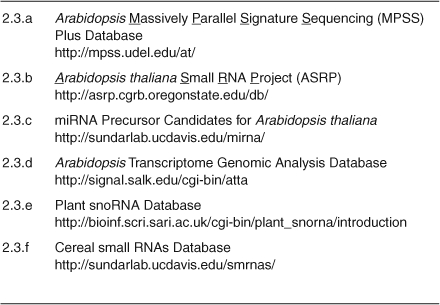
2.3.a. Arabidopsis Massively Parallel Signature Sequencing (MPSS) Plus Database
This project uses MPSS technology to identify and measure expression of genes in specific plant tissues. MPSS identifies short sequence signatures produced from a defined position within an mRNA or small RNA, and the relative abundance of these signatures in a given library represents a quantitative estimate of expression of that gene. SBS (sequencing by synthesis) 454 pyrosequencing small RNA data and MPSS small RNA library data are found at this web site (Lu et al., 2005; Lu et al., 2006). Users can query these signatures by protein entry code (i.e., AGI code), BAC clone name, sequence of the signature, or keyword for predicted protein function. To retrieve the MPSS map for a region of chromosome, click the region of interest on the chromosome viewer.
2.3.b. Arabidopsis thaliana Small RNA Project (ASRP)
ASRP has small RNA profiling data from a series of silencingdefective mutants, developmental stages and treatments and it examines small RNA pathways at a genome-wide level. At the home page, small RNAs are searchable by keywords (such as name of the small RNA and AGI code of the gene), genome coordinates, or small RNA sequences. There are four categories in search result: sequences, genes, miRNAs and ta-siRNAs. Once the search is done, the number of hits under each category is shown on the radio button right ahead of each category. Detailed information about the hits can be retrieved by clicking on the radio buttons. The information can also be downloaded as .csv files, which can be opened with Excel. The description of each small RNA library dataset is available at the database information page. Each dataset has hyperlinked GEO accessions. Detailed information about the sequences and abundance of small RNAs in these samples can be found by clicking on the GEO accessions.
2.3.c. miRNA Precursor Candidates for Arabidopsis thaliana
This database contains information for miRNAs and miRNA precursor candidates predicted by the algorithm‘findMiRNA’ (Adai et al., 2005). At the search page, users can search for miRNAs by transcript ID (i.e., AGI code), intergenic regions, introns (for example, AT3G44280.1–I2) or sequences. After clicking the ‘submit’ button, a new window opens up, showing a list of miRNA candidates with miRNA precursor candidates and RNA fold structures, which is unique for this database. All predictions for the entire genome and related software, such as findMiRNA, are available for download at the download page.
2.3.d. Arabidopsis Transcriptome Genomic Analysis Database
This database displays ASRP miRNAs, ASRP sRNA contigs, MPSS sRNA contigs, and miRNA precursors on the Arabidopsis genome at the bottom of the genome viewer. Information about the small RNAs can be retrieved by clicking on the small RNA icons.
There are two other plant miRNA databases: Plant snoRNA Database and Cereal small RNAs Database. Plant snoRNA Database contains Arabidopsis snoRNAs whose sequences were used to identify ~250 snoRNAs (small nucleolar RNAs) from other plant species. Cereal small RNAs Database contains large-scale datasets of maize (Zea mays) and rice (Oryza sativa) small RNA sequences generated by 454 pyrosequencing.
3. PROTEOMICS
3.1. Protein subcellular localization databases
Identifying proteins in specific subcellular locations is a very important step toward the understanding of cellular functions (Heazlewood et al., 2005). Researchers can either use targeting algorithms to predict the localization of these proteins or take experimental approaches. A substantial amount of experimental data about the subcellular location of Arabidopsis proteins are reported in the literature, including mass spectrometry (MS) data of organelle proteomes (~2,500 proteins), imaging data of chimeric fluorescent fusion proteins (~900 proteins) and biochemical data (~1,800 proteins) (Heazlewood et al., 2005). Here are some resources/databases containing large or medium sets of protein subcellular localization data.
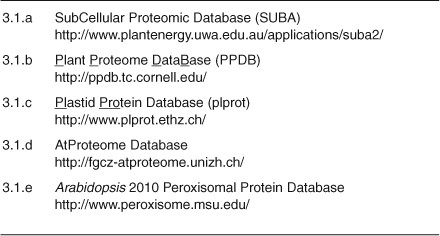
3.1.a. SubCellular Proteomic Database (SUBA)
SUBA contains a variety of experimental data and computational predictions regarding subcellular localization of proteins in Arabidopsis. These include large scale proteomic and GFP localization data and precompiled bioinformatic predictions for protein subcellular localizations (Heazlewood et al., 2005; Heazlewood et al., 2007). Users employ an easy-to-use interface to search for proteins whose locations are inferred by GFP assay, MS/MS assay, TAIR, AmiGO, or UniProt; or are predicted by iPSORT, LOCtree, MitoPred, Mitoprot 2, MultiLoc, PeroxiP, Predotar, SubLoc, TargetP, or WoLF PSORT to be in any subcellular locations, such as cell plate, cytoskeleton, cytosol, etc. It is also possible to search for proteins whose locations have been described in the literature. Search criteria can be specified and then modified using BOOLEAN logic. A reminder at the top of the screen keeps track of the current search criteria. Submitting the search criteria opens up the ‘result’ page—a default table containing columns for AGI code, TAIR description, etc. Users can also choose additional columns to display and/or sort the table by a specific column. More importantly, users can freely download all results in .txt files. The predicted or validated subcellular localization data from SUBA are also visible at the BAR Cell eFP Browser.
3.1.b. Plant Proteome DataBase (PPDB)
The PPDB has evolved from a focus on Arabidopsis and maize plastids to a broader plant proteome repository. It stores experimental data from the vanWijk laboratory proteome and MS analysis and curated information about protein function, properties and subcellular localization (Friso et al., 2004). Users can search PPDB by accession (i.e., AGI code), gene name or annotation, specify the columns in the search result table, and choose the output format (web or excel file). The web portal also provides access to proteome experiments, comparative proteomics and plastid sub-organelle proteomics. One useful feature is that users can visualize protein gel images for the proteome experiments. PPDB has an extensive set of data for plastid proteomics, with human curation of experimental data from the literature and the van Wijk laboratory, and prediction of trans-membrane domains (TMDs) by TMHMM or Aramemnon. An especially useful feature is that PPDB has lists of plastid proteins that are located in the outer envelope, inner membrane space, inner envelope, stroma, thylakoid, plastoglobules, plastid chromosome, and plastid 70S ribosome. Additionally, PPDB currently contains lists of proteins that undergo methionine oxidation, histidine and tryptophan oxidation, and Nterminal acetylation during post-translational modification.
3.1.c. Plastid Protein Database (plprot)
Plprot stores MS data from large scale proteome analyses of tobacco (Nicotiana tabacum) proplastids, rice etioplasts, Arabidopsis chloroplasts and bell pepper (Capsicum annuum) chromoplasts (Baginsky et al., 2004; Kleffmann et al., 2004; Baginsky et al., 2005; von Zychlinski et al., 2005; Kleffmann et al., 2006; Siddique et al., 2006). Users can search for proteins in the four databases and the complete plastid database which includes all the proteins identified in any of the four plastid types, by identifier, accession number, organism, fraction, localization, and protein annotation. It is possible to retrieve lists of proteins that were detected in only one plastid type or in the overlap between two or all three plastid types by clicking on different parts of the triangle on ‘plastid-type comparison’ page.
3.1.d. AtProteome Database
The AtProteome Database is an interactive Arabidopsis proteome map for different organs, developmental stages, and undifferentiated cultured cells (Baerenfaller et al., 2008). To search for a protein, click ‘Protein Search’ and specify the search arguments, such as AGI codes or keywords. After clicking ‘Search’, the proteins identified in the database will be listed with gene model, description, molecular weight, isoelectric point, the number of amino acids, the number of theoretical tryptic peptides of the protein, and the number of distinct peptides with which the protein was identified. Detailed information about the distinct peptides and spectral counts detected in different tissue samples will be shown after clicking any part of the row. The position of distinct peptides will be displayed on the Arabidopsis genome via the Peptide Browser.
Besides the above three databases, there are web-accessible databases created for specific projects. For example, the Arabidopsis 2010 Peroxisomal Protein Project (Table 3.1) aims to provide a comprehensive inventory of peroxisomal proteins inferred from proteomics data and tested using transgenic plants expressing reporter fusion constructs.
Table 3.1.
Protein subcellular localization databases
3.2. Protein-protein interaction databases
Complex biological processes often rely on the physical interactions of proteins. Genome-scale networks of protein-protein interactions in yeast (Saccharomyces cerevisiae) (Uetz et al., 2000), fruit fly (Drosophila melanogaster) (Giot et al., 2003), nematode (Caenorhabditis elegans) (Li et al., 2004) and human (homo sapiens) (Rual et al., 2005) are being created with high-throughput yeast-two-hybrid and other methods for assaying protein interactions. Several projects have been funded or finished to understand protein interaction networks in Arabidopsis. Tools that allow visualization of protein interactions will become increasingly important as larger parts of the interactome are experimentally revealed.
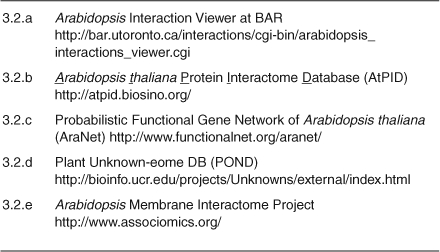
3.2.a. Arabidopsis Interaction Viewer at BAR
The BAR Arabidopsis Interaction Viewer combines published protein interaction data from other species, co-expression data of Arabidopsis genes and co-localization data of Arabidopsis proteins with some computational approaches to predict the protein interaction networks in Arabidopsis. The website currently contains both predicted and confirmed interacting proteins (Geisler-Lee et al., 2007; Popescu et al., 2007). Users can specify one or multiple proteins and retrieve a list of predicted functional partners with interolog confidence values, Pearson correlation coefficients, as well as yeast two-hybrid evidence from yeast, nematode, fruit fly and human. Users can store the query results by downloading the result table into Excel or Cytoscape.
3.2.b. Arabidopsisthaliana Protein Interactome Database (AtPID)
AtPID contains tens of thousands of pairs of protein interactions from prediction methods and thousands of pairs from the literature (Cui et al., 2008a). The pairs of proteins that interact are predicted by integrating several computational methods. This tool takes advantage of a variety of types of data including ortholog interaction in other species (e.g., yeast, fruit fly, nematode and human), shared biological function and co-expression. It also incorporates data for protein fusions and ‘guilt by physical proximity’ in bacteria, where genes of similar function are often physically linked. For a specified protein, users can retrieve a list of predicted functional partners with confidence scores from each of the seven methods and a total confidence score. As with Arabidopsis Interaction Viewer, AtPID is user-friendly. Individual predictions from the seven methods and the likelihood ratios are available for download.
Besides Arabidopsis Interaction Viewer and AtPID, there are some ongoing projects, such as Plant Unknown-eome project and Arabidopsis Membrane Interactome Project (Table 3.2), aiming to determine the interactions of specific protein groups. The Plant Unknown-eome project was funded to integrate the “Unknowneome” with abiotic stress response networks in Arabidopsis. One of the aims of this project is to determine the relationship of genes of unknown function within a global protein-protein interaction network using a random yeast-two-hybrid screening strategy. The Arabidopsis Membrane Interactome Project was funded by NSF to determine the interactions of >5,000 integral membrane proteins and >1,000 proteins predicted to be involved in signaling or protein modification using a specialized yeast two hybrid system.
Table 3.2.
Protein-protein interaction databases
4. PHENOMICS
High-confidence predictions of complex biological networks require genome-wide analysis of mRNA and proteins, as well as the results from large-scale mutant analysis. While tools for genome-scale studies on transcripts and proteins advanced rapidly in recent years, phenotypic studies of mutant lines is moving slowly toward whole-genome level. This is becoming possible due to the availability of collections of sequenced insertion mutants and gene-silencing mutants or constructs, high-throughput phenotypic analyses (for example, metabolite profiling through Gas Chromatography-Mass Spectrometry or Liquid Chromatography-Mass Spectrometry) and rapid creation of laboratory information management systems. A few resources/projects that contain or will contain large-scale phenotypic data are listed below and in Table 4.
Table 4.
Phenomics
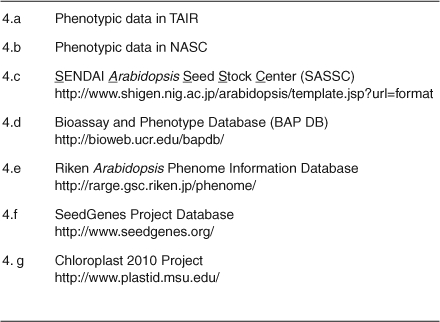
4.a. Phenotypic data in TAIR
TAIR displays the images and phenotypic descriptions of some characterized mutants. For example, if users do an ‘germplasm search’ for round leaves and restrict features with images, a list of germplasms with ‘round leaves’ and images will be shown in the same window. Detailed information about individual germplasm can be viewed by clicking the hot link for stock numbers). Images can be viewed by clicking camera icons. TAIR also allows researchers to submit phenotypic data for all mapped or sequenced Arabidopsis mutants.
4.b. Phenotypic data in NASC
NASC maintains phenotypic data including images of some characterized mutants. If users do a phenotype search for ‘white leaves’ at the stock catalogue search page, they will get a list of germplasms with white leaves. Clicking on the number in ‘Number of hits’ column opens up a new page showing names, donors, loci, stock types as well as phenotypes of the germplasms. As with TAIR, NASC accepts phenotypic data for donated seed stocks.
4.c. SENDAI Arabidopsis Seed Stock Center (SASSC)
As a stock center, SASSC also contains morphology and images of >1,000 lines of Arabidopsis and related species.
4.d. Bioassay and Phenotype Database (BAP DB)
BAP DB is a database for exploring gene functions based on available phenotype and for screening data from mutant, transgenic and wild-type organisms. It currently contains some projectspecific phenotypic data for mutants under various abiotic stresses. BAP DB also allows users to upload their own assay and phenotypic data.
4.e. Riken Arabidopsis Phenome Information Database (RAPID)
RAPID is a searchable database describing morphological phenotypes of ~4,000 Ds transposon mutant lines (Kuromori et al., 2006). Phenotypic descriptions of these lines were classified into eight primary categories, such as seedling, leaves, stems, flowers and siliques. Images for individual plants are also available.
4.f. SeedGenes Project Database
This is a resource describing ~600 embryo-defective mutants and the genes responsible for the phenotypes (Tzafrir et al., 2003). Users can query the database by gene information (such as AGI code, gene symbol and protein function keyword) or by mutant information (such as ecotype, seed color and embryo color). For example, if the user searches for mutants with available Nomarski images, he or she will retrieve a table of all mutants that meet this criterion. In the table, AGI codes are hyperlinked to TAIR gene pages, allele symbols are hyperlinked to phenotypic profiles, and terminal phenotypes are hyperlinked to embryo phenotype classes.
4.g. Chloroplast 2010 Project
The Chloroplast 2010 Project aims to connect individual chloroplast-targeted genes to function via an array of genomic and biochemical assays on several thousand homozygous T-DNA lines. These assays include plant, chloroplast and seed morphology, leaf and seed amino acid contents, seed carbon to nitrogen ratio, leaf fatty acid contents, leaf and seed starch level of these mutants (Lu et al., 2008), which will be made available to the public after they are subjected to quality control assays.
5. METABOLOMICS
5.1. Metabolomic databases
A comprehensive understanding of how metabolic networks and pathways are regulated is needed to develop approaches for predictive engineering of metabolism for fuels, food and fiber. Metabolomics and metabolite profiling technologies and databases are required to measure the products and intermediates of these pathways in response to genetic and environmental changes. We thereby list a few resources that are specifically for metabolomic data (Table 5.1).
Table 5.1.
Metabolomic databases
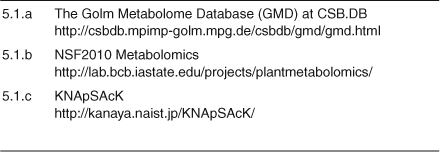
5.1.a. The Golm Metabolome Database (GMD) at CSB.DB
GMD provides public access to custom mass spectra libraries and data from a series of metabolite profiling experiments (Steinhauser et al., 2004). The navigation tabs, such as ‘GMD Page Tree’, ‘GMD Analytics’, ‘GMD MSRIs’, ‘GMD Profiles’ and ‘GMD Tools’, are located at the left side of the screen. ‘GMD Page Tree’ gives users an overview of what is available at GMD. ‘GMD Analytics’ contains information for analytical technologies, methods and protocols used by GMD. Users can access the query pages for compounds, spectra and libraries either from ‘GMD Page Tree’ or from ‘GMD Profiles’. ‘GMD MSRIs’ provides public access to download individual Mass Spectral and Retention Time Index Libraries (MSRIs). All libraries can be imported in the NIST 2 software and the import instructions are available at ‘GMD MSRIs’ page.
5.1.b. NSF2010 Metabolomics
The NSF2010 Metabolomics Project established metabolic platforms that detect ~1,800 metabolites, of which 900 are chemically defined. The consortium is currently profiling the metabolome of knockout lines for 50 – 60 Arabidopsis genes whose functions are not fully defined. The types of metabolites include ceramides, fatty acids, amino acids, cuticular waxes, phytosterols, isoprenoids and lipidomics. Users can browse and download the existing data, as well as submit and store their own metabolomics data at this database. This project also developed tools to analyze large sets of metabolomics data, such as exploRase and MetaOmGraph.
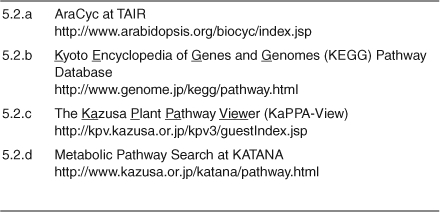
5.2. Databases for metabolic and regulatory pathways
To systematically uncover the interactions and pathways of genes and molecules, it is important to integrate three types of information: protein activities, gene annotations and metabolites into one database. Below are a few examples for this kind of database/resource.
5.2.a. AraCyc at TAIR
AraCyc is a user-friendly tool for visualizing biosynthetic pathways in Arabidopsis (Mueller et al., 2003). The database may be searched by protein, pathway, reaction, compound, gene or RNA. The pathways were computationally predicted and then manually validated and curated with a series of icons indicating the type of evidence used. AraCyc is released on a quarterly basis — as of this writing, it featured >280 pathways and >1,900 enzymatic reactions in Arabidopsis and E. coli.
5.2.b. Kyoto Encyclopedia of Genes and Genomes (KEGG) Pathway Database
KEGG is a collection of graphical diagrams representing molecular interactions, reactions, and relations in hundreds of organisms, including Arabidopsis (Kanehisa et al., 2006). Once a reference pathway is selected, users can choose to display the corresponding Arabidopsis-specific pathway and the Arabidopsis-specific steps will be highlighted in green. As with AraCyc, KEGG is a user-friendly set of tools.
Besides AraCyc and KEGG, there are many other databases designed for plant pathways (Table 5.2), for example, the Kazusa Plant Pathway Viewer (KaPPA-View). As of this writing, KaPPAView contains 1,400 reactions (Tokimatsu et al., 2005). In addition to >2,600 Arabidopsis genes, many rice, tomato (Solanum lycopersicum) and Lotus japonicus genes were assigned on the pathway maps.
Table 5.2.
Database for metabolic and regulatory pathways
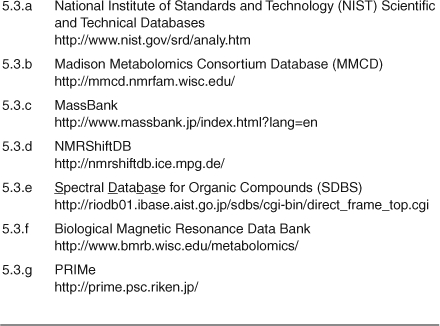
5.3. Spectral databases for small molecule analysis
The development of high-throughput measurements of large numbers of metabolites in plants is a result of rapid improvements in MS-based methods and in computer hardware and software (Last et al., 2007). Most metabolomics studies use MS, nuclear magnetic resonance (NMR) spectroscopy, as well as Fourier-transform infrared (FT-IR) spectroscopy. The ability to decipher the identity of individual metabolites depends on the existence of mass spectra databases from a wide range of compounds. The National Institute of Standards and Technology (NIST) Scientific and Technical Database (http://www.nist.gov/srd/analy.htm) is an example of such a database.
The NIST/EPA/NIH Mass Spectral Library is the largest mass spectral database, including >160,000 compounds with spectra. The library has been fully evaluated using a variety of techniques. It can be purchased from many distributors, such as Agilent Technologies. This library comes with NIST MS Search Program for Windows, which includes tools for GC/MS deconvolution, MS Interpretation and Chemical Substructure Analysis. The users' guide for the NIST library and software is available. Other spectral databases listed in Table 5.3 are openaccess. Among them, MMCD (Cui et al., 2008b), NMRShiftDB (Steinbeck and Kuhn, 2004) and SDBS contain large numbers of NMR spectra.
Table 5.3.
Spectral databases
5.5. Ionomic databases
Understanding ionic homeostasis and the role of ions in plant biology is important for a full understanding of plant physiology (Salt, 2004). The Arabidopsis Ionomics Project was initiated to profile nutrient and trace elements in Arabidopsis on a genomic scale. The Purdue Ionomics Information Management System (PiiMS; http://center.e-enterprise.purdue.edu/wps/portal/_s.155/4606) is the home of data from the Arabidopsis Ionomics Project. As of this writing, PiiMS contained data on shoot concentrations of P, Ca, K, Mg, Cu, Fe, Zn, Mn, Co, Ni, B, Se, Mo, Na, As and Cd in >1500 Arabidopsis lines (Lahner et al., 2003; Baxter et al., 2007). Users can query the database with AGI numbers, mutant names or tray numbers. Once the AGI number and tray numbers are selected, detailed information about selected trays will be shown in the next page. The user can then choose to generate z-score graphs, view z-score or normal values, or generate .csv or .pdf report for the selected pots. Users can also have ionomic analysis conducted on their germplasm of interest by filling out an order form and sending the seeds.
6. Seed stock databases
Before 1990, large collections of Arabidopsis lines were maintained by individual researchers (Scholl et al., 2000). After 1990, several Arabidopsis seed stock centers were established to collect, propagate, preserve and distribute seed lines that are useful to researchers. Insertional mutants in these stock centers are searchable through T-DNA Express, such as SALK T-DNA lines, GABI-Kat T-DNA lines, FLAG T-DNA lines, WiscDsLox T-DNA lines, SAIL T-DNA lines, RIKEN transposon lines, JIC SM transposon lines, CSHL transposon lines, and IMA Ds transposon lines.
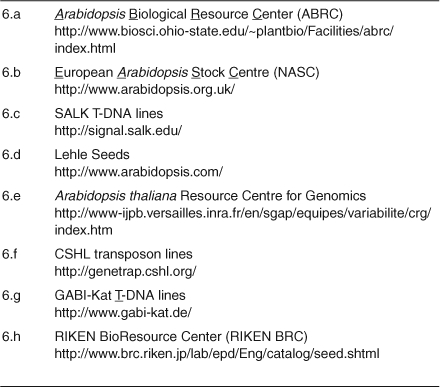
6.a. Arabidopsis Biological Resource Center (ABRC)
ABRC maintains and distributes hundreds of thousands of seed and DNA stocks. Seed stocks maintained at ABRC include mutants, mapping lines, transgenic lines, tilling lines, chromosomal variants, natural accessions and other related species. DNA stocks include libraries, clones, vectors, and pooled genomic DNA fromT-DNA insertional mutant populations and host strains. T-DNA lines distributed by ABRC include SALK lines, SAIL lines andWiscDsLox lines. The ABRC database is well integrated with TAIR, therefore searching, ordering and donating stocks can be conducted through TAIR.
6.b. European Arabidopsis Stock Centre (NASC)
NASC currently maintains and distributes >300,000 seed stocks, including characterized lines, mapping populations, insertion lines and other related species. Like TAIR, NASC accepts donations of seed stocks that are unique and will be useful to other researchers. ABRC and NASC have a distribution agreement. NASC distributes to Europe and ABRC distributes to North America. Laboratories in any other locations may establish their primary affiliation with either center.
6.c. SALK T-DNA lines
The SALK Institute Genomic Analysis Laboratory (SIGnAL) created >88,000 T-DNA lines (Alonso et al., 2003) and are currently in the process of generating a genome-wide collection of homozygous T-DNA lines (Alonso and Ecker, 2006). These T-DNA lines, including those that are homozygous, are available at ABRC and NASC.
6.d. Lehle Seeds
Lehle seeds distributes wild-type Arabidopsis seeds, gamma-ray and fast neutron M1 seeds, EMS and fast neutron M2 seeds, well as crop seeds.
6.e. Arabidopsis thaliana Resource Centre for Genomics
This facility contains 55,000 T-DNA lines in theWs ecotype, >500 ecotypes and nearly 30 recombinant inbred line populations with 450 lines each.
6.f. CSHL transposon lines
This collection of transposon lines (in the Ler ecotype) contains insertions in >1,500 unknown and hypothetical genes (Sundaresan et al., 1995). Many seed stocks were deposited at NASC and ABRC. Some lines are only available at CSHL. To order from CSHL, a Material Transfer Agreement (MTA) is not required although they charge $100 per line.
6.g. GABI-Kat T-DNA lines
GABI-Kat generated >64,000 T-DNA lines in the Col-0 ecotype Rosso et al., 2003; Li et al., 2007). GABI-Kat is currently in the process of confirming their T-DNA lines. Seeds of confirmed lines are available from NASC. Lines that not yet confirmed are available from GABI-Kat, although a MTA and a fee of 100 EUR are required to purchase seed stocks from GABI-Kat.
6.h. RIKEN BioResource Center (RIKEN BRC)
RIKEN BRC currently maintains and distributes >49,000 Arabidopsis seed stocks and >297,000 DNA stocks. Seed stocks include transposon-tagged lines (in the No-0 background) and activation-tagged lines (in the Col-0 background) developed RIKEN and wild-type and mutant seeds formally distributed from SASSC. DNA stocks include RIKEN Arabidopsis RAFL clones and CDNA or EST clones for other plant species. Although RIKEN FST lines (i.e., transposon-tagged lines) and RIKEN EST clones are listed in T-DNA Express, one has to order these stocks through RIKEN. These stocks are not available at ABRC or NASC.
Table 6.
Seed stock databases
Acknowledgments
The Chloroplast 2010 Project was supported by the National Science Foundation (grant no. MCB-0519740).
Footnotes
Citation: Lu Y., and Last R.L. (2008) Web-Based Arabidopsis Functional and Structural Genomics Resources. The Arabidopsis Book 6:e0118. doi:10.1199/tab.0118
elocation-id: e0118
Published on: October 28, 2008
REFERENCES
- Adai A., Johnson C., Mlotshwa S., Archer-Evans S., Manocha V., Vance V., Sundaresan V. Computational prediction of miRNAs in Arabidopsis thaliana. Genome Res. 2005;156(1):78–91. doi: 10.1101/gr.2908205. [DOI] [PMC free article] [PubMed] [Google Scholar]
- Alonso J. M., Ecker J. R. Moving forward in reverse: genetic technologies to enable genome-wide phenomic screens in Arabidopsis. Nat. Rev. Genet. 2006;76(1):524–536. doi: 10.1038/nrg1893. [DOI] [PubMed] [Google Scholar]
- Alonso J. M., Stepanova A. N., Leisse T. J., Kim C. J., Chen H. M., Shinn P., Stevenson D. K., Zimmerman J., Barajas P., Cheuk R., Gadrinab C., Heller C., Jeske A., Koesema E., Meyers C. C., Parker H., Prednis L., Ansari Y., Choy N., Deen H., Geralt M., Hazari N., Hom E., Karnes M., Mulholland C., Ndubaku R., Schmidt I., Guzman P., Aguilar-Henonin L., Schmid M., Weigel D., Carter D. E., Marchand T., Risseeuw E., Brogden D., Zeko A., Crosby W. L., Berry C. C., Ecker J. R. Genome-wide insertional mutagenesis of Arabidopsis thaliana. Science. 2003;3016(1):653–657. doi: 10.1126/science.1086391. [DOI] [PubMed] [Google Scholar]
- Arabidopsis Genome Initiative Analysis of the genome sequence of the flowering plant Arabidopsis thaliana. Nature. 2000;4086(1):796–815. doi: 10.1038/35048692. [DOI] [PubMed] [Google Scholar]
- Baerenfaller K., Grossmann J., Grobei M. A., Hull R., Hirsch-Hoffmann M., Yalovsky S., Zimmermann P., Grossniklaus U., Gruissem W., Baginsky S. Genome-scale proteomics reveals Arabidopsis thaliana gene models and proteome dynamics. Science. 2008;3206(1):938–941. doi: 10.1126/science.1157956. [DOI] [PubMed] [Google Scholar]
- Baginsky S., Siddique A., Gruissem W. Proteome analysis of tobacco bright yellow-2 (BY-2) cell culture plastids as a model for undifferentiated heterotrophic plastids. J. Proteome Res. 2004;36(1):1128–1137. doi: 10.1021/pr0499186. [DOI] [PubMed] [Google Scholar]
- Baginsky S., Kleffmann T., von Zychlinski A., Gruissem W. Analysis of shotgun proteomics and RNA profiling data from Arabidopsis thaliana chloroplasts. J. Proteome Res. 2005;46(1):637–640. doi: 10.1021/pr049764u. [DOI] [PubMed] [Google Scholar]
- Baxter I., Ouzzani M., Orcun S., Kennedy B., Jandhyala S. S., Salt D. E. Purdue Ionomics Information Management System. An integrated functional genomics platform. Plant Physiol. 2007;1436(1):600–611. doi: 10.1104/pp.106.092528. [DOI] [PMC free article] [PubMed] [Google Scholar]
- Borevitz J. O., Liang D., Plouffe D., Chang H. S., Zhu T., Weigel D., Berry C. C., Winzeler E., Chory J. Large-scale identification of single-feature polymorphisms in complex genomes. Genome Res. 2003;136(1):513–523. doi: 10.1101/gr.541303. [DOI] [PMC free article] [PubMed] [Google Scholar]
- Borevitz J. O., Hazen S. P., Michael T. P., Morris G. P., Baxter I. R., Hu T. T., Chen H., Werner J. D., Nordborg M., Salf D. E., Kay S. A., Chory J., Weigel D., Jones J. D. G., Ecker J. R. Genome-wide patterns of single-feature polymorphism in Arabidopsis thaliana. Proc. Nat. Acad. Sci. 2007;1046(1):12057–12062. doi: 10.1073/pnas.0705323104. [DOI] [PMC free article] [PubMed] [Google Scholar]
- Castelli V., Aury J-M., Jaillon O., Wincker P., Clepet C., Menard M., Cruaud C., Quetier F., Scarpelli C., Schachter V., Temple G., Caboche M., Weissenbach J., Salanoubat M. Whole genome sequence comparisons and “full-length” cDNA sequences: a combined approach to evaluate and improve Arabidopsis genome annotation. Genome Res. 2004;146(1):406–413. doi: 10.1101/gr.1515604. [DOI] [PMC free article] [PubMed] [Google Scholar]
- Clark R. M., Schweikert G., Toomajian C., Ossowski S., Zeller G., Shinn P., Warthmann N., Hu T. T., Fu G., Hinds D. A., Chen H. M., Frazer K. A., Huson D. H., Schölkopf B., Nordborg M., Räetsch G., Ecker J. R., Weigel D. Common sequence polymorphisms shaping genetic diversity in Arabidopsis thaliana. Science. 2007;3176(1):338–342. doi: 10.1126/science.1138632. [DOI] [PubMed] [Google Scholar]
- Cui J., Li P., Li G., Xu F., Zhao C., Li Y., Yang Z., Wang G., Yu Q., Li Y., Shi T. AtPID: Arabidopsis thaliana protein interactome database an integrative platform for plant systems biology. Nucleic Acids Res. 2008a;366(1):D999–D1008. doi: 10.1093/nar/gkm844. [DOI] [PMC free article] [PubMed] [Google Scholar]
- Cui Q., Lewis I. A., Hegeman A. D., Anderson M. E., Li J., Schulte C. F., Westler W. M., Eghbalnia H. R., Sussman M. R., Markley J. L. Metabolite identification via the Madison Metabolomics Consortium Database. Nat. Biotech. 2008b;266(1):162–164. doi: 10.1038/nbt0208-162. [DOI] [PubMed] [Google Scholar]
- Friso G., Giacomelli L., Ytterberg A. J., Peltier J-B., Rudella A., Sun Q., Wijk K. Jv. In-depth analysis of the thylakoid membrane proteome of Arabidopsis thaliana chloroplasts: new proteins, new functions, and a plastid proteome database. Plant Cell. 2004;166(1):478–499. doi: 10.1105/tpc.017814. [DOI] [PMC free article] [PubMed] [Google Scholar]
- Geisler-Lee J., O'Toole N., Ammar R., Provart N. J., Millar A. H., Geisler M. A predicted interactome for Arabidopsis. Plant Physiol. 2007;1456(1):317–329. doi: 10.1104/pp.107.103465. [DOI] [PMC free article] [PubMed] [Google Scholar]
- Giot L., Bader J. S., Brouwer C., Chaudhuri A., Kuang B., Li Y., Hao Y. L., Ooi C. E., Godwin B., Vitols E., Vijayadamodar G., Pochart P., Machineni H., Welsh M., Kong Y., Zerhusen B., Malcolm R., Varrone Z., Collis A., Minto M., Burgess S., McDaniel L., Stimpson E., Spriggs F., Williams J., Neurath K., Ioime N., Agee M., Voss E., Furtak K., Renzulli R., Aanensen N., Carrolla S., Bickelhaupt E., Lazovatsky Y., DaSilva A., Zhong J., Stanyon C. A., Finley R. L., Jr., White K. P., Braverman M., Jarvie T., Gold S., Leach M., Knight J., Shimkets R. A., McKenna M. P., Chant J., Rothberg J. M. A protein interaction map of Drosophila melanogaster. Science. 2003;3026(1):1727–1736. doi: 10.1126/science.1090289. [DOI] [PubMed] [Google Scholar]
- Hazen S. P., Borevitz J. O., Harmon F. G., Pruneda-Paz J. L., Schultz T. F., Yanovsky M. J., Liljegren S. J., Ecker J. R., Kay S. A. Rapid array mapping of circadian clock and developmental mutations in Arabidopsis. Plant Physiol. 2005;1386(1):990–997. doi: 10.1104/pp.105.061408. [DOI] [PMC free article] [PubMed] [Google Scholar]
- Heazlewood J. L., Tonti-Filippini J., Verboom R. E., Millar A. H. Combining experimental and predicted datasets for determination of the subcellular location of proteins in Arabidopsis. Plant Physiol. 2005;1396(1):598–609. doi: 10.1104/pp.105.065532. [DOI] [PMC free article] [PubMed] [Google Scholar]
- Heazlewood J. L., Verboom R. E., Tonti-Filippini J., Small I., Millar A. H. SUBA: the Arabidopsis Subcellular Database. Nucleic Acids Res. 2007;356(1):D213–218. doi: 10.1093/nar/gkl863. [DOI] [PMC free article] [PubMed] [Google Scholar]
- Hilson P., Allemeersch J., Altmann T., Aubourg S., Avon A., Beynon J., Bhalerao R. P., Bitton F., Caboche M., Cannoot B., Chardakov V., Cognet-Holliger C., Colot V., Crowe M., Darimont C., Durinck S., Eickhoff H., de Longevialle A. F., Farmer E. E., Grant M., Kuiper M. T. R., Lehrach H., Léon C., Leyva A., Lundeberg J., Lurin C., Moreau Y., Nietfeld W., Paz-Ares J., Reymond P., Rouzé P., Sandberg G., Segura M. D., Serizet C., Tabrett A., Taconnat L., Thareau V., Van Hummelen P., Vercruysse S., Vuylsteke M., Weingartner M., Weisbeek P. J., Wirta V., Wittink F. R. A., Zabeau M., Small I. Versatile gene-specific sequence tags for Arabidopsis functional genomics: Trancript profiling and reverse genetics applications. Genome Res. 2004;146(1):2176–2189. doi: 10.1101/gr.2544504. [DOI] [PMC free article] [PubMed] [Google Scholar]
- James N., Graham N., Clements D., Schildknecht B., May S. AtEnsEMBL: a post-genomic resource brower for Arabidopsis. In: Edwards D., editor. Plant Bioinformatics: Methods and Protocols. 1. Vol. 6. Totowa, NJ: Humana Press; 2007. pp. 213–227. [Google Scholar]
- Jander G., Norris S. R., Rounsley S. D., Bush D. F., Levin I. M., Last R. L. Arabidopsis map-based cloning in the post-genome era. Plant Physiol. 2002;1296(1):440–450. doi: 10.1104/pp.003533. [DOI] [PMC free article] [PubMed] [Google Scholar]
- Kanehisa M., Goto S., Hattori M., Aoki-Kinoshita K. F., Itoh M., Kawashima S., Katayama T., Araki M., Hirakawa M. From genomics to chemical genomics: new developments in KEGG. Nucleic Acids Res. 2006;346(1):D354–357. doi: 10.1093/nar/gkj102. [DOI] [PMC free article] [PubMed] [Google Scholar]
- Kilian J., Whitehead D., Horak J., Wanke D., Weinl S., Batistic O., D'Angelo C., Bornberg-Bauer E., Kudla J., Harter K. The AtGenExpress global stress expression data set: protocols, evaluation and model data analysis of UV-B light, drought and cold stress responses. Plant J. 2007;506(1):347–363. doi: 10.1111/j.1365-313X.2007.03052.x. [DOI] [PubMed] [Google Scholar]
- Kleffmann T., Hirsch-Hoffmann M., Gruissem W., Baginsky S. plprot: a comprehensive proteome database for different plastid types. Plant Cell Physiol. 2006;476(1):432–436. doi: 10.1093/pcp/pcj005. [DOI] [PubMed] [Google Scholar]
- Kleffmann T., Russenberger D., von Zychlinski A., Christopher W., Sjölander K., Gruissem W., Baginsky S. The Arabidopsis thaliana chloroplast proteome reveals pathway abundance and novel protein functions. Curr. Biol. 2004;146(1):354–362. doi: 10.1016/j.cub.2004.02.039. [DOI] [PubMed] [Google Scholar]
- Kuromori T., Wada T., Kamiya A., Yuguchi M., Yokouchi T., Imura Y., Takabe H., Sakurai T., Akiyama K., Hirayama T., Okada K., Shinozaki K. A trial of phenome analysis using 4000 Ds-insertional mutants in gene-coding regions of Arabidopsis. Plant J. 2006;476(1):640–651. doi: 10.1111/j.1365-313X.2006.02808.x. [DOI] [PubMed] [Google Scholar]
- Lahner B., Gong J. M., Mahmoudian M., Smith E. L., Abid K. B., Rogers E. E., Guerinot M. L., Harper J. F., Ward J. M., McIntyre L., Schroeder J. I., Salt D. E. Genomic scale profiling of nutrient and trace elements in Arabidopsis thaliana. Nat. Biotech. 2003;216(1):1215–1221. doi: 10.1038/nbt865. [DOI] [PubMed] [Google Scholar]
- Last R. L., Jones A. D., Shachar-Hill Y. Towards the plant metabolome and beyond. Nat. Rev. Mol. Cell Biol. 2007;86(1):167–174. doi: 10.1038/nrm2098. [DOI] [PubMed] [Google Scholar]
- Li S., Armstrong C. M., Bertin N., Ge H., Milstein S., Boxem M., Vidalain P-O., Han J-D. J., Chesneau A., Hao T., Goldberg D. S., Li N., Martinez M., Rual J-F., Lamesch P., Xu L., Tewari M., Wong S. L., Zhang L. V., Berriz G. F., Jacotot L., Vaglio P., Reboul J., Hirozane-Kishikawa T., Li Q., Gabel H. W., Elewa A., Baumgartner B., Rose D. J., Yu H., Bosak S., Sequerra R., Fraser A., Mango S. E., Saxton W. M., Strome S., van den Heuvel S., Piano F., Vandenhaute J., Sardet C., Gerstein M., Doucette-Stamm L., Gunsalus K. C., Harper J. W., Cusick M. E., Roth F. P., Hill D. E., Vidal M. A Map of the interactome network of the metazoan C. elegans. Science. 2004;3036(1):540–543. doi: 10.1126/science.1091403. [DOI] [PMC free article] [PubMed] [Google Scholar]
- Li Y., Rosso M. G., Viehoever P., Weisshaar B. GABI-Kat SimpleSearch: an Arabidopsis thaliana T-DNA mutant database with detailed information for confirmed insertions. Nucleic Acids Res. 2007;356(1):D874–D878. doi: 10.1093/nar/gkl753. [DOI] [PMC free article] [PubMed] [Google Scholar]
- Lu C., Tej S. S., Luo S., Haudenschild C. D., Meyers B. C., Green P. J. Elucidation of the small RNA component of the transcriptome. Science. 2005;3096(1):1567–1569. doi: 10.1126/science.1114112. [DOI] [PubMed] [Google Scholar]
- Lu C., Kulkarni K., Souret F. F., MuthuValliappan R., Tej S. S., Poethig R. S., Henderson I. R., Jacobsen S. E., Wang W., Green P. J., Meyers B. C. MicroRNAs and other small RNAs enriched in the Arabidopsis RNA-dependent RNA polymerase-2 mutant. Genome Res. 2006;166(1):1276–1288. doi: 10.1101/gr.5530106. [DOI] [PMC free article] [PubMed] [Google Scholar]
- Lu Y., Savage L. J., Ajjawi I., Imre K. M., Yoder D. W., Benning C., DellaPenna D., Ohlrogge J., Osteryoung K. W., Weber A. P. M., Wilkerson C. G., Last R. L. New connections across pathways and cellular processes: industrialized mutant screening reveals novel associations between diverse phenotypes in Arabidopsis. Plant Physiol. 2008;1466(1):1482–1500. doi: 10.1104/pp.107.115220. [DOI] [PMC free article] [PubMed] [Google Scholar]
- Manfield I. W., Jen C-H., Pinney J. W., Michalopoulos I., Bradford J. R., Gilmartin P. M., Westhead D. R. Arabidopsis Co-expression Tool (ACT): web server tools for microarray-based gene expression analysis. Nucleic Acids Res. 2006;346(1):W504–509. doi: 10.1093/nar/gkl204. [DOI] [PMC free article] [PubMed] [Google Scholar]
- Mueller L. A., Zhang P. F., Rhee S. Y. AraCyc: a biochemical pathway database for Arabidopsis. Plant Physiol. 2003;1326(1):453–460. doi: 10.1104/pp.102.017236. [DOI] [PMC free article] [PubMed] [Google Scholar]
- Nordborg M., Hu T. T., Ishino Y., Jhaveri J., Toomajian C., Zheng H. G., Bakker E., Calabrese P., Gladstone J., Goyal R., Jakobsson M., Kim S., Morozov Y., Padhukasahasram B., Plagnol V., Rosenberg N. A., Shah C., Wall J. D., Wang J., Zhao K. Y., Kalbfleisch T., Schulz V., Kreitman M., Bergelson J. The pattern of polymorphism in Arabidopsis thaliana. Plos Biology. 2005;36(1):1289–1299. doi: 10.1371/journal.pbio.0030196. [DOI] [PMC free article] [PubMed] [Google Scholar]
- Ogata Y., Sakurai N., Provart N. J., Steinhauser D., Krall L. Bioinformatics tools to discover co-expressed genes in plants. In: Kahl G., Meksem K., editors. The Handbook of Plant Functional Genomics: Concepts and Protocols. 1. Vol. 6. Weinheim, Germany: Wiley-Blackwell; 2008. pp. 309–336. [Google Scholar]
- Pan X., Liu H., Clarke J., Jones J., Bevan M., Stein L. ATIDB: Arabidopsis thaliana insertion database. Nucleic Acids Res. 2003;316(1):1245–1251. doi: 10.1093/nar/gkg222. [DOI] [PMC free article] [PubMed] [Google Scholar]
- Popescu S. C., Popescu G. V., Bachan S., Zhang Z., Seay M., Gerstein M., Snyder M., Dinesh-Kumar S. P. Differential binding of calmodulin-related proteins to their targets revealed through high-density Arabidopsis protein microarrays. Proc. Nat. Acad. Sci. 2007;1046(1):4730–4735. doi: 10.1073/pnas.0611615104. [DOI] [PMC free article] [PubMed] [Google Scholar]
- Rhee S. Y., Crosby B. Biological databases for plant research. Plant Physiol. 2005;1386(1):1–3. doi: 10.1104/pp.104.900158. [DOI] [PMC free article] [PubMed] [Google Scholar]
- Riaño-Pachón D. M., Dreyer I., Mueller-Roeber B. Orphan transcripts in Arabidopsis thaliana: identification of several hundred previously unrecognized genes. Plant J. 2005;436(1):205–212. doi: 10.1111/j.1365-313X.2005.02438.x. [DOI] [PubMed] [Google Scholar]
- Rosso M. G., Li Y., Strizhov N., Reiss B., Dekker K., Weisshaar B. An Arabidopsis thaliana T-DNA mutagenized population (GABIKat) for flanking sequence tag-based reverse genetics. Plant Mol. Biol. 2003;536(1):247–259. doi: 10.1023/B:PLAN.0000009297.37235.4a. [DOI] [PubMed] [Google Scholar]
- Rual J. F., Venkatesan K., Hao T., Hirozane-Kishikawa T., Dricot A., Li N., Berriz G. F., Gibbons F. D., Dreze M., Ayivi-Guedehoussou N., Klitgord N., Simon C., Boxem M., Milstein S., Rosenberg J., Goldberg D. S., Zhang L. V., Wong S. L., Franklin G., Li S. M., Albala J. S., Lim J. H., Fraughton C., Llamosas E., Cevik S., Bex C., Lamesch P., Sikorski R. S., Vandenhaute J., Zoghbi H. Y., Smolyar A., Bosak S., Sequerra R., Doucette-Stamm L., Cusick M. E., Hill D. E., Roth F. P., Vidal M. Towards a proteome-scale map of the human protein-protein interaction network. Nature. 2005;4376(1):1173–1178. doi: 10.1038/nature04209. [DOI] [PubMed] [Google Scholar]
- Salt D. E. Update on plant ionomics. Plant Physiol. 2004;1366(1):2451–2456. doi: 10.1104/pp.104.047753. [DOI] [PMC free article] [PubMed] [Google Scholar]
- Schmid M., Davison T. S., Henz S. R., Pape U. J., Demar M., Vingron M., Scholkopf B., Weigel D., Lohmann J. U. A gene expression map of Arabidopsis thaliana development. Nat. Genet. 2005;376(1):501–506. doi: 10.1038/ng1543. [DOI] [PubMed] [Google Scholar]
- Scholl R. L., May S. T., Ware D. H. Seed and molecular resources for Arabidopsis. Plant Physiol. 2000;1246(1):1477–1480. doi: 10.1104/pp.124.4.1477. [DOI] [PMC free article] [PubMed] [Google Scholar]
- Seki M., Narusaka M., Kamiya A., Ishida J., Satou M., Sakurai T., Nakajima M., Enju A., Akiyama K., Oono Y., Muramatsu M., Hayashizaki Y., Kawai J., Carninci P., Itoh M., Ishii Y., Arakawa T., Shibata K., Shinagawa A., Shinozaki K. Functional Annotation of a Full-Length Arabidopsis cDNA Collection. Science. 2002;2966(1):141–145. doi: 10.1126/science.1071006. [DOI] [PubMed] [Google Scholar]
- Siddique M. A., Grossmann J., Gruissem W., Baginsky S. Proteome analysis of bell pepper (Capsicum annuum L.) chromoplasts. Plant Cell Physiol. 2006;476(1):1663–1673. doi: 10.1093/pcp/pcl033. [DOI] [PubMed] [Google Scholar]
- Spannagl M., Noubibou O., Haase D., Yang L., Gundlach H., Hindemitt T., Klee K., Haberer G., Schoof H., Mayer K. F. X. MIPSPlantsDB—plant database resource for integrative and comparative plant genome research. Nucleic Acids Res. 2007;356(1):D834–840. doi: 10.1093/nar/gkl945. [DOI] [PMC free article] [PubMed] [Google Scholar]
- Steinbeck C., Kuhn S. NMRShiftDB - compound identification and structure elucidation support through a free community-built web database. Phytochemistry. 2004;656(1):2711–2717. doi: 10.1016/j.phytochem.2004.08.027. [DOI] [PubMed] [Google Scholar]
- Steinhauser D., Usadel B., Luedemann A., Thimm O., Kopka J. CSB.DB: a comprehensive systems-biology database. Bioinformatics. 2004;206(1):3647–3651. doi: 10.1093/bioinformatics/bth398. [DOI] [PubMed] [Google Scholar]
- Sundaresan V., Springer P., Volpe T., Haward S., Jones J. D., Dean C., Ma H., Martienssen R. Patterns of gene action in plant development revealed by enhancer trap and gene trap transposable elements. Genes Dev. 1995;96(1):1797–1810. doi: 10.1101/gad.9.14.1797. [DOI] [PubMed] [Google Scholar]
- Swarbreck D., Wilks C., Lamesch P., Berardini T. Z., Garcia-Hernandez M., Foerster H., Li D., Meyer T., Muller R., Ploetz L., Radenbaugh A., Singh S., Swing V., Tissier C., Zhang P., Huala E. The Arabidopsis Information Resource (TAIR): gene structure and function annotation. Nucleic Acids Res. 2008;366(1):D1009–D1014. doi: 10.1093/nar/gkm965. [DOI] [PMC free article] [PubMed] [Google Scholar]
- Till B. J., Reynolds S. H., Greene E. A., Codomo C. A., Enns L. C., Johnson J. E., Burtner C., Odden A. R., Young K., Taylor N. E., Henikoff J. G., Comai L., Henikoff S. Large-scale discovery of induced point mutations with high-throughput TILLING. Genome Res. 2003;136(1):524–530. doi: 10.1101/gr.977903. [DOI] [PMC free article] [PubMed] [Google Scholar]
- Tokimatsu T., Sakurai N., Suzuki H., Ohta H., Nishitani K., Koyama T., Umezawa T., Misawa N., Saito K., Shibata D. KaPPAView. a web-based analysis tool for integration of transcript and metabolite data on plant metabolic pathway maps. Plant Physiol. 2005;1386(1):1289–1300. doi: 10.1104/pp.105.060525. [DOI] [PMC free article] [PubMed] [Google Scholar]
- Törjék O., Berger D., Meyer R. C., Müssig C., Schmid K. J., Sörensen T. R., Weisshaar B., Mitchell-Olds T., Altmann T. Establishment of a high-efficiency SNP-based framework marker set for Arabidopsis. Plant J. 2003;366(1):122–140. doi: 10.1046/j.1365-313x.2003.01861.x. [DOI] [PubMed] [Google Scholar]
- Toufighi K., Brady S. M., Austin R., Ly E., Provart N. J. The Botany Array Resource: e-northerns, expression angling, and promoter analyses. Plant J. 2005;436(1):153–163. doi: 10.1111/j.1365-313X.2005.02437.x. [DOI] [PubMed] [Google Scholar]
- Tzafrir I., Dickerman A., Brazhnik O., Nguyen Q., McElver J., Frye C., Patton D., Meinke D. The Arabidopsis SeedGenes Project. Nucleic Acids Res. 2003;316(1):90–93. doi: 10.1093/nar/gkg028. [DOI] [PMC free article] [PubMed] [Google Scholar]
- Uetz P., Giot L., Cagney G., Mansfield T. A., Judson R. S., Knight J. R., Lockshon D., Narayan V., Srinivasan M., Pochart P., Qureshi-Emili A., Li Y., Godwin B., Conover D., Kalbfleisch T., Vijayadamodar G., Yang M. J., Johnston M., Fields S., Rothberg J. M. A comprehensive analysis of protein-protein interactions in Saccharomyces cerevisiae. Nature. 2000;4036(1):623–627. doi: 10.1038/35001009. [DOI] [PubMed] [Google Scholar]
- Vaughn M. W., Martienssen R. It's a small RNA world, after all. Science. 2005;3096(1):1525–1526. doi: 10.1126/science.1117805. [DOI] [PubMed] [Google Scholar]
- von Zychlinski A., Kleffmann T., Krishnamurthy N., Sjolander K., Baginsky S., Gruissem W. Proteome analysis of the rice etioplast: metabolic and regulatory networks and novel protein functions. Mol. Cell. Proteomics. 2005;46(1):1072–1084. doi: 10.1074/mcp.M500018-MCP200. [DOI] [PubMed] [Google Scholar]
- Warthmann N., Fitz J., Weigel D. MSQT for choosing SNP assays from multiple DNA alignments. Bioinformatics. 2007;236(1):2784–2787. doi: 10.1093/bioinformatics/btm428. [DOI] [PubMed] [Google Scholar]
- Wei H., Persson S., Mehta T., Srinivasasainagendra V., Chen L., Page G. P., Somerville C., Loraine A. Transcriptional coordination of the metabolic network in Arabidopsis. Plant Physiol. 2006;1426(1):762–774. doi: 10.1104/pp.106.080358. [DOI] [PMC free article] [PubMed] [Google Scholar]
- Winter D., Vinegar B., Nahal H., Ammar R., Wilson G. V., Provart N. J. An “Electronic Fluorescent Pictograph” browser for exploring and analyzing large-scale biological data sets. PLoS ONE. 2007;26(1):e718. doi: 10.1371/journal.pone.0000718. [DOI] [PMC free article] [PubMed] [Google Scholar]
- Yamada K., Lim J., Dale J. M., Chen H., Shinn P., Palm C. J., Southwick A. M., Wu H. C., Kim C., Nguyen M., Pham P., Cheuk R., Karlin-Newmann G., Liu S. X., Lam B., Sakano H., Wu T., Yu G., Miranda M., Quach H. L., Tripp M., Chang C. H., Lee J. M., Toriumi M., Chan M. M. H., Tang C. C., Onodera C. S., Deng J. M., Akiyama K., Ansari Y., Arakawa T., Banh J., Banno F., Bowser L., Brooks S., Carninci P., Chao Q., Choy N., Enju A., Goldsmith A. D., Gurjal M., Hansen N. F., Hayashizaki Y., Johnson-Hopson C., Hsuan V. W., Iida K., Karnes M., Khan S., Koesema E., Ishida J., Jiang P. X., Jones T., Kawai J., Kamiya A., Meyers C., Nakajima M., Narusaka M., Seki M., Sakurai T., Satou M., Tamse R., Vaysberg M., Wallender E. K., Wong C., Yamamura Y., Yuan S., Shinozaki K., Davis R. W., Theologis A., Ecker J. R. Empirical analysis of transcriptional activity in the Arabidopsis genome. Science. 2003;3026(1):842–846. doi: 10.1126/science.1088305. [DOI] [PubMed] [Google Scholar]
- Zeller G., Clark R. M., Schneeberger K., Bohlen A., Weigel D., Ratsch G. Detecting polymorphic regions in Arabidopsis thaliana with resequencing microarrays. Genome Res. 2008;186(1):918–929. doi: 10.1101/gr.070169.107. [DOI] [PMC free article] [PubMed] [Google Scholar]
- Zimmermann P., Hennig L., Gruissem W. Gene-expression analysis and network discovery using Genevestigator. Trens Plant Sci. 2005;106(1):407–409. doi: 10.1016/j.tplants.2005.07.003. [DOI] [PubMed] [Google Scholar]
- Zimmermann P., Hirsch-Hoffmann M., Hennig L., Gruissem W. GENEVESTIGATOR. Arabidopsis microarray database and analysis toolbox. Plant Physiol. 2004;1366(1):2621–2632. doi: 10.1104/pp.104.046367. [DOI] [PMC free article] [PubMed] [Google Scholar]