Abstract
Many small passerines regularly fly slowly when catching prey, flying in cluttered environments or landing on a perch or nest. While flying slowly, passerines generate most of the flight forces during the downstroke, and have a ‘feathered upstroke’ during which they make their wing inactive by retracting it close to the body and by spreading the primary wing feathers. How this flight mode relates aerodynamically to the cruising flight and so-called ‘normal hovering’ as used in hummingbirds is not yet known. Here, we present time-resolved fluid dynamics data in combination with wingbeat kinematics data for three pied flycatchers flying across a range of speeds from near hovering to their calculated minimum power speed. Flycatchers are adapted to low speed flight, which they habitually use when catching insects on the wing. From the wake dynamics data, we constructed average wingbeat wakes and determined the time-resolved flight forces, the time-resolved downwash distributions and the resulting lift-to-drag ratios, span efficiencies and flap efficiencies. During the downstroke, slow-flying flycatchers generate a single-vortex loop wake, which is much more similar to that generated by birds at cruising flight speeds than it is to the double loop vortex wake in hovering hummingbirds. This wake structure results in a relatively high downwash behind the body, which can be explained by the relatively active tail in flycatchers. As a result of this, slow-flying flycatchers have a span efficiency which is similar to that of the birds in cruising flight and which can be assumed to be higher than in hovering hummingbirds. During the upstroke, the wings of slowly flying flycatchers generated no significant forces, but the body–tail configuration added 23 per cent to weight support. This is strikingly similar to the 25 per cent weight support generated by the wing upstroke in hovering hummingbirds. Thus, for slow-flying passerines, the upstroke cannot be regarded as inactive, and the tail may be of importance for flight efficiency and possibly manoeuvrability.
Keywords: bird Ficedula hypoleuca, aerodynamic flight performance, inclined stroke plane hovering, slow flight, wind tunnel, PIV
1. Introduction
When commuting or migrating, birds are assumed to fly near the speed yielding minimum energetic costs per unit distance travelled (called maximum range speed, Umr) [1,2]. Therefore, the majority of bird flight research has focused on flight performance around this flight speed [3–7]. Many small birds, however, often fly much slower, particularly those that hunt or feed on the wing or live in cluttered environments [8,9], although not much is known about flight speed distributions in the wild. Still, it can be assumed that natural selection has resulted in efficient and controlled flight at low speeds for birds that often fly at these speeds, just as it has resulted in efficient flight at migratory flight speeds for migratory birds.
Most research on hovering and slow flight in birds has been done on small specialized hoverers, such as hummingbirds [10–12]. Hummingbirds are considered specialized hoverers because they have a relatively stiff wing that turns upside down during the upstroke, much like the wings of insects. This type of hovering is commonly called ‘normal’ hovering, and results in lift production throughout the entire wingbeat [13]. The wake topology for hovering hummingbirds is described as a collection of vortex loops, where each wing generates a separate vortex loop at each wing stroke (upstroke and downstroke) [11]. The tail is relatively inactive in lift production. Also, hummingbirds generate a leading edge vortex (LEV) on the wing for enhancing lift production at low flight speeds [14].
Compared with hummingbirds, little research has been done on the slow flight of more conventional birds, which use a type of hovering known as asymmetric or inclined stroke plane hovering [15,16]. Asymmetric hoverers have much more flexible wings; these wings are made inactive during the upstroke. This is done by retracting the wings and spreading the primary feathers in such a way that the air can flow through the gaps in between the feathers, resulting in low flight forces during the ‘feathered upstroke’ [17,18]. The tail, however, can still be active during the upstroke [17].
Basic aerodynamic measurements on the slow flight of more conventional birds (pigeon, Columba livia at 2.5 m s−1 [19]; and Jackdaw, Corvus monedula at 2.5 m s−1 [20]) describe the wake as a single-vortex loop generated during the active downstroke, while no distinct vortex structure is found during the upstroke. More detailed aerodynamic measurements on the flapping flight of birds at higher flight speeds (near Umr) have found a similar wake structure during the downstroke, where the whole animal generates a single-vortex loop, although smaller wake structures could also be distinguished [6,7]. During the upstroke, a second vortex structure is generally found; this structure is also generated by the wings and results in aerodynamic forces that contribute to weight support, but which also generate negative thrust, hence adding to the drag [3,5,21].
Based on these aerodynamic data, we hypothesize that during slow flight asymmetric hoverers should generate wake patterns that are more similar to the wake for birds at cruising flight speeds than to wake patterns found in normal hoverers, such as hummingbirds. We tested this hypothesis by studying the aerodynamic flight performance of an asymmetric hoverer, the pied flycatcher (Ficedula hypoleuca), at a flight speed ranging from near hovering (2 m s−1) to an intermediate flight speed of 7 m s−1. The 7 m s−1 flight speed is called intermediate because it is close to the estimated minimum power speed Ump for flycatchers (table 1) [1]. The pied flycatcher is a small (14 g) insectivorous passerine which hunts insects mainly on the wing [8]. We estimated the aerodynamic flight performance of three flycatchers based on stereoscopic flight kinematics measurements in combination with aerodynamic wake data, measured using stereoscopic time-resolved particle image velocimetry (PIV). This technique enables us to determine the vortex wake pattern and induced downwash distribution behind the flying animal, which is used to estimate the temporal flight forces and flight performance values such as the lift-to-drag ratio (L/D) [22], the span efficiency (ei) [23] and the flap efficiency (ef) throughout the measured flight speed range.
Table 1.
Morphological data and ecologically important flight speeds for the pied flycatchers used in this study. The morphological data consist of Mass M, wing span b, wing surface area S, mean chord length c = S/b, aspect ratio AR = b2/S and wing loading Q = Mg/S, where g is the gravitational constant. The ecologically important flight speeds are the minimum power speed Ump and the maximum range speed Umr.
| individual | M (kg) | b (m) | S (m2) | c (m) | AR (—) | Q (N m−2) | Ump (m s−1)a | Umr (m s−1)a |
|---|---|---|---|---|---|---|---|---|
| flycatcher no. 1 | 0.0148 | 0.235 | 0.0106 | 0.045 | 5.2 | 13.7 | 7.2 | 13.5 |
| flycatcher no. 2 | 0.0141 | 0.235 | 0.0105 | 0.045 | 5.3 | 13.2 | 7.1 | 13.3 |
| flycatcher no. 3 | 0.0137 | 0.236 | 0.0107 | 0.045 | 5.2 | 12.6 | 7.0 | 13.2 |
aEstimated based on M, b, S and body drag coefficient CDb = 0.10 using the program Flight 1.22 (25).
2. Material and methods
2.1. Pied flycatchers
The pied flycatcher is a small (14 g) passerine. It is a long-distance migrant, with breeding sites in northern Europe and Asia and wintering grounds in western and central Africa. Flycatchers are insectivorous and commonly catch insects on the wing, by taking off from a perch to catch an insect in mid-air before returning to the perch [8,9]. Therefore, they are likely to be adapted to hovering and slow flight.
Three juvenile pied flycatchers (from here on called flycatchers) were used for the experiments. The mass of each flycatcher was determined before and after each experimental session, while the wing area S and wing span b were determined following the study of Bowlin [24], except that Pennycuick's ‘body box’ [25] was added. Based on these data, we estimated their minimum power speed and maximum range speeds [25] (table 1).
2.2. Experimental setup and procedure
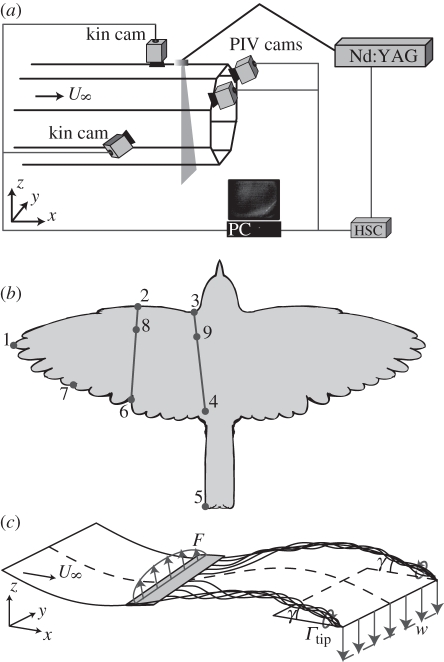
The experiments were performed in the Lund University low-speed low-turbulence wind tunnel [26], using a high-speed (200 Hz) stereoscopic PIV system (LaVision) for wake analysis and a stereoscopic high-speed (250 Hz) video camera setup for kinematics analysis (figure 1a), similar to the setup described by Hedenström et al. [27].
Figure 1.
(a) The experimental setup, consisting of a low-turbulence low-speed wind tunnel, a high-speed stereoscopic PIV system for airflow visualization, and a high-speed stereoscopic video system for flight kinematics analysis. (b) Top view of a flycatcher with the seven natural markers, being (1) the wing tip; (2) the wrist; (3) the shoulder; (4) the side of the rump; (5) the tip of the tail; (6) the indentation between the innermost primary and the outermost secondary feather; and (7) the tip of the third primary. Also, the wing chord behind the wrist and at the wing–body intersection are shown, together with the quarter chord points (point (8) and (9), respectively). (c) A hypothetical heaving wing with an elliptical spanwise force distribution F, two tip vortices with circulation Γtip and spanwise angle (γ), and spanwise uniform downwash w.
The PIV setup consists of a 200 Hz pulsed 50 mJ Laser (Litron LPY732 series, Nd : YAG, 532 nm) and two synchronized, double-frame, CMOS-cameras (HighSpeedStar3; 1024 × 1024 pixels) in stereo setup. The PIV image plane is 20 × 20 cm in size and is positioned in the {y,z} plane (figure 1). The PIV system was controlled by the LaVision PIV software package DaVis (LaVision, DaVis 7.2.2.110). The kinematics camera setup consists of two synchronized CCD-cameras (Redlake MotionScope PCI 500) operating at 250 Hz and infrared lights (VDI-IR60F, Video Security Inc.) for illumination. Infrared lights were used to reduce interference with the PIV system, although in this study, PIV and kinematics measurements were done separately.
During the experiments, each bird was trained separately to perch on a hand-held perch in the test section of the wind tunnel. When the perch was lowered, the bird took off. When the flycatcher flew steadily in the desired position (directly upstream from the PIV laser sheet), 100 PIV measurements or 1024 kinematics measurements were obtained, after which the perch was presented again to the bird.
For each measured kinematics or PIV sequence, the flight behaviour of the bird was visually inspected. The sequences in which the animal was manoeuvring or not flying at the wind tunnel speed were discarded for analysis.
2.3. Wingbeat kinematics analysis
The wingbeat kinematics were analysed for flycatchers no. 1 and no. 3 at flight speeds of 2, 4 and 7 m s−1. For each individual and flight speed combination, at least five sequences (each consisting of at least two steady wingbeats) were filmed and analysed using a custom-made Matlab program (Matlab 7.7.0.471 R2008a). For the analysis, seven natural wing and body markers (figure 1b) were manually digitized and converted into three-dimensional positions {x,y,z} using direct linear transformation (Christoph Reinschmidt Matlab routines). For each marker and flight speed combination, the average wingbeat track was constructed from all the analysed wingbeats at that flight speed using a nested ANOVA (Matlab, ANOVAN).
From the average wingbeat kinematics tracks, the following kinematics variables were estimated: wingbeat frequency f; downstroke ratio Rds (defined as the ratio of the temporal downstroke period and the upstroke period of a wingbeat); span ratio SR (defined as the ratio between the lateral extension of the wing tip at mid-upstroke and at mid-downstroke); effective Reynolds number during the downstroke, defined as
| 2.1 |
where c is the mean wing chord length, ν is the kinematic viscosity of air and  is the mean effective wing velocity.
  is a product of the forward flight speed and flapping motion of the wing, and is defined as
 |
2.2 |
where  is the downstroke mean velocity vector of the wing. Induced air movements are ignored. The Strouhal number during the downstroke is defined as [28]
 |
2.3 |
Reeff and Stds are based on  at two wing positions, being
  at the shoulder joint and
  at the wingtip (figure 1b).
  is solely based on the downstroke movements, as we can assume that the wings are mainly active during this part of the wingbeat [17].
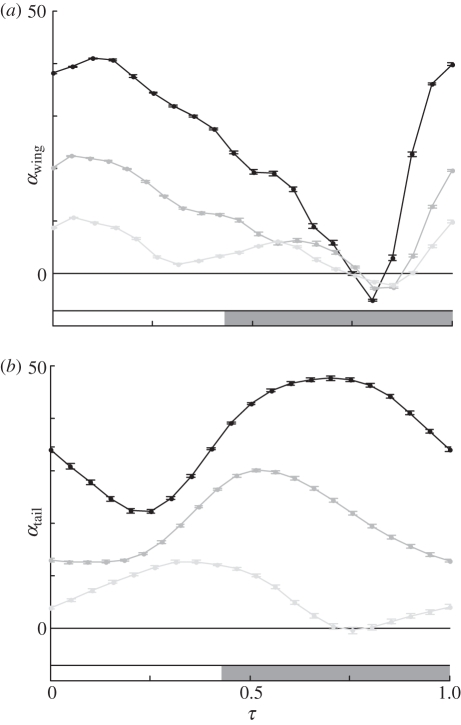
The angle-of-attack is determined for the wing (αwing) and for the tail (αtail). αwing is defined as the angle between the wing chord from the wrist marker to the marker at the indentation between the innermost primary and the outermost secondary feather, and the local velocity vector  at the quarter chord point (figure 2a). αtail is determined as the angle between the horizontal and the tail chord from the rump marker to the tail tip marker (figure 1b). Using the same markers, we determined the tail spread angle ϕ throughout the wingbeat.
Figure 2.
Effective angle-of-attack (mean ± s.e.) of the quarter chord point behind the wrist (a) and of the tail (b), at flight speeds of 2 (black), 4 (dark grey) and 7 m s−1 (light grey). The grey bar at the bottom of each panel indicates the upstroke part of the wingbeat.
The relative vertical body movement amplitude  is defined as [22]
 |
2.4 |
where Abody is the vertical wingbeat amplitude of the quarter chord point at the wing–body intersection (point 9 in figure 1b), determined using the vertical movement of markers 3 and 4. Atip is the vertical wingtip amplitude (marker 1 in figure 1b).  is used in the vortex wake analysis, as described below.
2.4. Particle image velocimetry analysis
PIV measurements were performed for flycatcher no. 3 at a flight speed of 2, 4 and 7 m s−1, and for flycatchers no. 1 and no. 2 at all measured flight speeds (2–7 m s−1, in increments of 1 m s−1). We did not sample at speeds below 2 m s−1 because the PIV setup required a higher convection speed to capture the wake. For each measured individual and flight speed combination, at least five sequences (each consisting of at least two steady wingbeats) were measured and analysed. Each PIV sequence, consisting of 100 PIV measurements, was analysed with DaVis (LaVision, DaVis 7.2.2.110) using a multi-pass normalized second-order stereo cross-correlation {64 × 64 and 32 × 32, 50% overlap} with Whittaker reconstruction, followed by a {3 × 3} smoothing. This results in a {y,z} matrix with corresponding velocity vectors {u,v,w} for each PIV frame. The PIV frames were given a frame number n, a normalized time stamp τ and streamwise location stamp x. The frame number range is n = [1 − N], with n = 1 for the PIV frame representing the wake at the start of the downstroke, and n = N for the PIV frame at the end of the upstroke. The normalized time stamp is defined as
| 2.5 |
where t is the time at which the PIV frame was recorded with t = 0 for the PIV frame representing the wake at the start of the downstroke. Π is the wingbeat period, so the PIV frame with τ = 1 represents the wake at the start of the next downstroke. Using n and τ, the PIV sequences are divided into separate wingbeats.
When assuming that the wake convects statically downstream with the forward flight speed U∞, one can estimate the streamwise position of each PIV frame within a wingbeat as
| 2.6 |
where x ranges from 0 at the start of the downstroke to x = λ at the end of the upstroke, where λ (=U∞Π) is the wingbeat wavelength. The assumption that the wake convects statically downstream is an approximation of the true wake dynamics, but the x variable is only used to qualitatively visualize the three-dimensional wake topology, and is not used for any quantitative analysis.
The PIV data for each wingbeat are stored as a four-dimensional matrix with spatial and temporal variables {x,y,z,τ}. For each node point {x,y,z,τ}, the three-dimensional velocity vectors {u,v,w} are also stored, from which the streamwise vorticity is calculated as {ωx}. The resulting wake matrices are analysed using a custom-made Matlab program, where two main wake characteristics were measured: the streamwise vortex wake and the spanwise downwash distributions.
For the vortex wake analysis, the different PIV frames were visualized separately, and the main wake vortices were identified (e.g. the tip vortex, figure 1c). For each of these main vortex structures, the location and time stamp {x,y,z,τ}, streamwise peak vorticity {ωx,max} and streamwise circulation {Γx} were measured and stored. The vortex area was defined as the area, where ωx > ωx,min with ωx,min = 60 s−1. This minimum value is larger than 95 per cent of the vorticity noise as a result of the PIV calculation routine for the worst-case scenario of U∞ = 7 m s−1, determined from PIV measurements from an empty wind tunnel. The vortex circulation is determined by integrating the vorticity throughout the vortex area. When assuming a normal Gaussian distribution of the vorticity outside the vortex area (ωx < ωx,min), the total streamwise circulation of a vortex is estimated as [5]
 |
2.7 |
where Γx′ is the streamwise circulation measured within the vortex area. In the wake of a common swift Apus apus, three types of main vortex structures were identified [7]: tip vortex, root vortex and tail vortex. These were also found in the wake of the flycatchers, so these vortex structures were measured and saved if present in a PIV frame.
For the spanwise downwash distribution analysis, the different PIV frames were visualized separately. In each PIV frame n, the spanwise downwash distribution was measured along a spanwise downwash line, which was defined as a straight line from the position behind the bird body to the centre of the most distally positioned vortex structure (figure 1c). This structure was generally the tip vortex, but if the tip vortex was not present, the tail vortex was the most distal one, as in Henningsson et al. [7]. The vertically induced velocities w in each node point {y,z} along this line were stored for further analysis. The collection of spanwise downwash lines in all frames within one wingbeat (x = [0 − λ]) can be used to describe a downwash wake surface within the {x,y,z} matrix, showing the downwash distribution {w} along the span {y} and throughout the wingbeat (along {x} or {τ}).
The resolution of the four-dimensional wake matrix {x,y,z,τ} is equal to the PIV node point resolution (5.1 mm) in the y- and z-directions. The temporal resolution is equal to the inverse of the frame rate of the PIV system (Δt = 1/200), resulting in a streamwise resolution of Δx = U∞Δt = U∞/200. Thus, Δx scales with the flight speed, ranging from Δx = 10 mm at 2 m s−1 to Δx = 35 mm at 7 m s−1. To compensate for the low streamwise resolution at high flight speeds, an interpolation scheme was used, where the number of interpolation steps was equal to the flight speed. This results in an interpolated wake matrix {x′,y,z} with a constant Δx′ = 5 mm throughout the complete measured flight speed range. These interpolated wake matrices are used only for qualitative analyses, as is described below.
3. Wake model for flapping bird flight
3.1. Wake topology
The wake topology for one wingbeat was visualized using the interpolated spatial wake matrix {x′,y,z} with the interpolated variables {w′} and {ωx′}. The vortex wake was visualized using iso-surfaces of constant spanwise vorticity {ωx′} within the wake matrix. The induced velocity distribution in the wake was visualized using the downwash wake surface, where the surface is colour-coded with the local vertical velocity {w′}.
3.2. Vortex wake forces
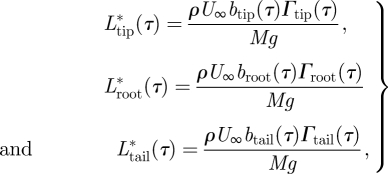
The normalized aerodynamic lift forces corresponding to the different vortex wake structures (tip vortex, root vortex and tail vortex) at τ can be estimated using Kelvin's theorem and inviscid vortex theory as follows [7,22,29]
 |
3.1 |
where ρ is the air density; btip(τ), broot(τ) and btail(τ) are the vortex span of the tip vortex, the root vortex and the tail vortex, respectively. The forces are normalized using the weight of the flycatcher (Mg, where M is body mass and g is the gravitational constant). For each vortex structure, the total normalized vortex force F*(τ) and the equivalent thrust component T*(τ) are (figure 1c):
 |
3.2 |
where  is the mean spanwise vortex sheet angle of the current vortex system (tip, root or tail vortex system). For the tail vortex system, the vortex sheet angle is assumed to be constant along the span, so
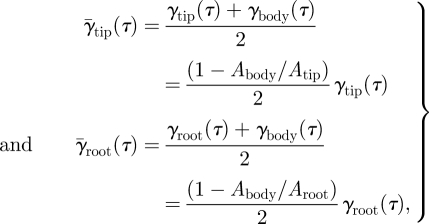
  , where γtail (τ) is the tail vortex angle at τ. For the tip and the root vortex systems, the mean angle is estimated as the average of the angle at the vortex (γtip or γroot) and the vortex sheet angle at the body (γbody) as [22]:
 |
3.3 |
where Abody/Atip is the ratio between the vertical wingbeat amplitude at the body and at the wingtip, which is determined in kinematics analysis (A*body = Abody/Atip). The ratio between the body and the root amplitude is determined by Abody/Aroot = A*body · Atip/Aroot. As the root vortex cannot directly be linked to a specific wing marker, Atip/Aroot is estimated using the vertical movement of the tip vortex and the root vortex, respectively [22]. There is a minus sign in front of the amplitude ratio because the body movement is in anti-phase with the wingtip and root vortex movement (the body moves up when the wings move down). The angle for each vortex structure at τ can be estimated from the horizontal vortex path as
 |
3.4 |
The total temporal lift and thrust distributions are defined as:
 |
3.5 |
The corresponding total temporal force distribution is  . By integrating these throughout the wingbeat (τ = [0–1]), the average normalized lift
  , thrust
  and total force
  produced within one wingbeat were determined. As the birds were flying steadily in the wind tunnel,
  should be equal to 1 (L/W = 1) and
  is equal to the total normalized drag of the animal (
 ). The lift-to-drag ratio was determined by
  /
/ [22].
[22].
Note that lift and thrust were defined as the vertical and streamwise components of the flight forces, respectively. They can therefore be considered as the effective L* and T* of the whole flying animal, and L* should not be confused with the local lift force vector at a certain wing section, which can have a different direction from L*.
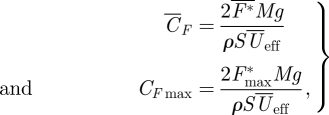
The mean and maximum force coefficients produced by the animal can be determined by
 |
3.6 |
where  is the downstroke average normalized flight force and F*max is the maximum flight force produced. The relative contribution of the tail vortex forces to the total lift and thrust production was defined as
  and
and  , respectively.
3.3. Average wingbeat wake
For each measured flight speed, an average wingbeat wake was defined, based on all the measured wingbeats at the specific flight speed [22]. This procedure is equivalent to phase-averaging of PIV data, and it is performed to filter out noise resulting from the PIV calculations and to remove variations in the wake dynamics owing to small manoeuvres by the flying birds.
The average wingbeat wake consists of the average vortex wake and the average downwash distribution. The average vortex wake was defined as the average temporal lift distribution (L*(τ)) and normalized vertical movement (z*(τ) = z(τ)/(b/2)) for each main vortex structure. The average downwash distribution was defined as a collection of  mean spanwise downwash distributions, where
  is the mean amount of frames per wingbeat for all the measured wingbeats at a certain flight speed. All averages were determined by fitting a smoothing spline (Matlab, csaps, smoothing parameter = 1–10−3) through the data point distributions of all PIV measurements of a certain variable (e.g. L*(τ) of the tip vortex) at a certain flight speed. The vortex wake splines were made periodic by copying the data points twice and distributing them across three wingbeat periods (τ = [(−1) − 2]). The middle section of the resulting smoothing spline (τ = [0–1]) defines the average vortex wake. The relative deviation of the data points from the average spline was estimated by calculating a sliding 95% confidence interval from a sliding window of I local data points, where I is the number of wingbeats analysed at that flight speed.
3.4. Downwash distribution, span efficiency and flap efficiency
The average spanwise downwash distributions determined for each mean PIV frame n = [1− ] were used to determine the span efficiency ei [23], which is a measure for the efficiency of lift production and is defined as [30]
| 3.7 |
where Pi is the induced power required to generate a lift force L based on spanwise downwash distribution w(y). Pi,ideal is the minimum required induced power to generate L based on a uniform spanwise downwash  , which is the case for an elliptical spanwise lift distribution (figure 1c).
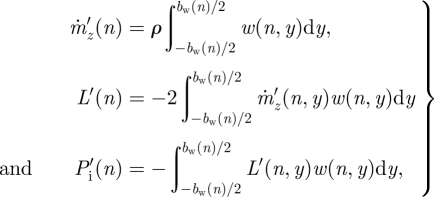
The induced power per distance travelled (P′) required to generate the spanwise downwash distribution w(y) for PIV frame n can be estimated by Muijres et al. [23]
 |
3.8 |
where  is the vertical mass flux per distance travelled associated with w(n,y), L′(n) is the associated lift per distance travelled,
  is the resulting induced power per distance travelled and bw(n) is the wake span at PIV frame n, which is equal to the width (in y-direction) of the local spanwise downwash line. The minimum required induced power per distance travelled is defined as
| 3.9 |
where  is the spanwise uniform downwash resulting in the same L′(n) as in equation (3.8), which is determined by
 |
3.10 |
By summing the induced power per distance travelled for all PIV frames for a wingbeat (n = [1 −  ]), the total Pi and total Pi,ideal for one wingbeat was determined [23]. From these, the wingbeat mean span efficiency for flapping flight was determined using equation (3.7).
Note that ei is based only on the deviation from a spanwise uniform downwash [23,30], while the downwash can still vary throughout the wingbeat. The absolute minimum power required for weight support would be for the case, where the downwash is uniform both along the wingspan and throughout the wingbeat. The efficiency factor based on the deviation from a wingbeat uniform downwash is defined as flap efficiency
| 3.11 |
where Pi,min is the minimum power required to generate the wingbeat average lift L* and which is based on a wingbeat uniform downwash w*. w* is determined by
 |
3.12 |
where A is the total downwash wake area defined as:
 |
3.13 |
One should be careful in distinguishing ef from ei. For example, Pennycuick's flight model (Flight 1.22) [1,25], which can be used to estimate power curves for flapping flight in birds, uses the flap efficiency rather than the span efficiency to estimate the induced power. Equivalent to Pennycuick's flight model, one can estimate the effective induced drag coefficient for flapping flight by [1,25,30]
 |
3.14 |
where AR is the aspect ratio of the wing (table 1). As  is particularly high at low flight speeds (equation (3.6)), CDi and thus also ef have relatively large influences on flight efficiency at low flight speeds.
4. Results
4.1. Kinematics
The kinematics variables are summarized in table 2. Both flapping frequency and downstroke ratio decreased slightly with flight speed (table 2). The span ratio was low and relatively constant throughout the measured flight speed range (SR = 0.091 ± 0.003, mean ± s.d.). The Reynolds number varied from Reeff = 6.9×10³ (based on  at U∞ = 2 m s−1) to Reeff = 25.7×10³ (based on
  at U∞ = 7 m s−1). The wingtip-based Strouhal number varied from Stds = 0.42 at 2 m s−1 to Stds = 0.23 at 7 m s−1.
Table 2.
Wingbeat kinematics variables (mean ± s.d.) for flycatcher no. 1 and no. 3 flying at U∞ = 2, 4 and 7 m s−1. The variables are flap frequency f; downstroke ratio Rds; span ratio SR; mean effective wing speed during the downstroke  of wrist and wingtip; effective Reynolds number Reeff of wrist and wingtip; downstroke-based Strouhal number Stds of wrist and wingtip; mean angle-of-attack (
 ), maximum angle-of-attack (αmax) and angle-of-attack amplitude (Aα) of both wing and tail; mean tail spread angle
  ; maximum tail spread angle ϕmax; normalized vertical body movement amplitude
  .
.
| U∞ (m s−1) | 2 | 4 | 7 |
|---|---|---|---|
| f (s−1) | 12.6 ± 0.8 | 12.0 ± 0.4 | 12.1 ± 0.7 |
| Rds (–) | 0.45 | 0.42 | 0.42 |
| SR (–) | 0.087 | 0.092 | 0.093 |
 1 (m s−1) 1 (m s−1) |
2.42 | 4.28 | 7.20 |
 1 (m s−1) 1 (m s−1) |
5.7 | 6.7 | 9.0 |
| Reeff wrist (–)a | 6.9×10³ | 12.3×10³ | 20.7×10³ |
| Reeff tip (–)a | 16.3×10³ | 19.1×10³ | 25.7×10³ |
| Stds wrist (–)a | 0.11 | 0.06 | 0.04 |
| Stds tip (–)a | 0.42 | 0.31 | 0.23 |
 (°) (°) |
34.3 ± 3.8 | 17.3 ± 2.3 | 6.0 ± 2.7 |
| αwing max (°) | 40.9 ± 3.0 | 22.3 ± 1.3 | 10.6 ± 2.5 |
| Aα wing (°) | 46.1 | 25.2 | 12.9 |
 (°) (°) |
36.6 ± 7.9 | 19.6 ± 5.1 | 6.2 ± 7.1 |
| αtail max (°) | 39.0 ± 4.4 | 26.4 ± 4.2 | 12.6 ± 4.2 |
| Aα tail (°) | 25.3 | 17.5 | 13.1 |
 (°) (°) |
33.0 ± 10.6 | 32.5 ± 8.9 | 28.1 ± 11.2 |
| ϕmax (°) | 42.9 ± 12.6 | 40.2 ± 7.9 | 33.9 ± 18.9 |
 (–) (–) |
0.063 | 0.068 | 0.082 |
aBased on the downstroke part of the wingbeat, as it is assumed that the upstroke is inactive.
The average angle-of-attack, maximum angle-of-attack and the angle-of-attack amplitude of both the wing and the tail were all largest at the lowest flight speed (table 2 and figure 2). In the temporal occurrence of αmax,tail, a phase shift with flight speed was present. At the lowest flight speed, αtail,max occurred at mid-upstroke, at 4 m s−1 it occurred at the transition between downstroke and upstroke, whereas for the highest flight speed αtail,max occurred during the second half of the downstroke (figure 2). The tail spread angle was highest at the lowest flight speed (table 2).
The relative body movement  increased only slightly with flight speed, so the average value was used in the vortex wake analysis (
 = 0.07 ± 0.01, equation (3.3)).
4.2. Wake topology
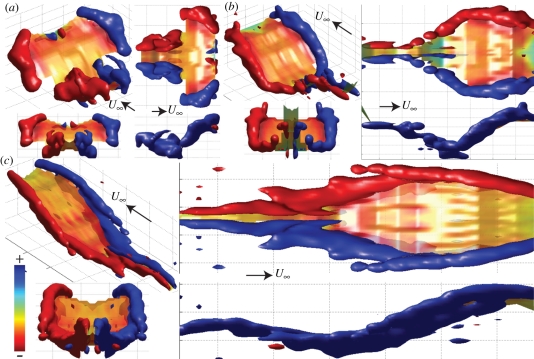
The wake topology for the flycatchers consisted of a tip vortex, root vortex and tail vortex throughout the complete measured flight speed range (figure 3). For low flight speeds, at the start of the downstroke, a tip vortex and a root vortex were generated behind each wing (figure 3a). Shortly after the start of the downstroke, the root vortex disappeared (its vorticity drops below the iso-surface threshold), while the tip vortex is visible until the end of the downstroke. During the upstroke, a relatively strong tail vortex with a complex shape was present.
Figure 3.
Isosurfaces of constant streamwise vorticity (red: +ωiso; blue: −ωiso) and the colour-coded downwash distribution (see colour bar at the bottom left corner) in the wake of a flycatcher flying at (a) U∞ = 3 m s−1; (b) 5 m s−1; and (c) 7 m s−1. The variables for the different panels are: (a) flycatcher no. 2, isovalue: ωiso = 100 s−1, downwash scale: wmax = 3.8 m s−1; (b) flycatcher no. 2, ωiso = 100 s−1, wmax = 2.7 m s−1; (c) flycatcher no. 1, ωiso = 50 s−1, wmax = 1.7 m s−1. Each panel consists of four views: perspective view (NW); top view (NE); front view (SW); side view (SE). Scaled wind tunnel velocity vectors U∞ are shown in the perspective view, and in between the top and the side views.
At a flight speed of 5 m s−1 (figure 3b), the same vortex structures were present as at low flight speeds, although they differed in relative strength. The main differences were that, at 5 m s−1, the root vortices and tail vortices were weaker, the tail vortices were simpler in shape and the tip vortex was still present during the first part of the upstroke. At the highest measured flight speed (7 m s−1, figure 3c), the wake was similar to that at intermediate flight speeds, although at 7 m s−1 no root vortices could be distinguished and the wake was more drawn out owing to the larger convection speed.
4.3. Vortex wake force dynamics
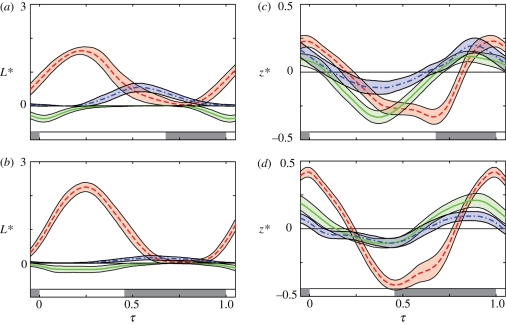
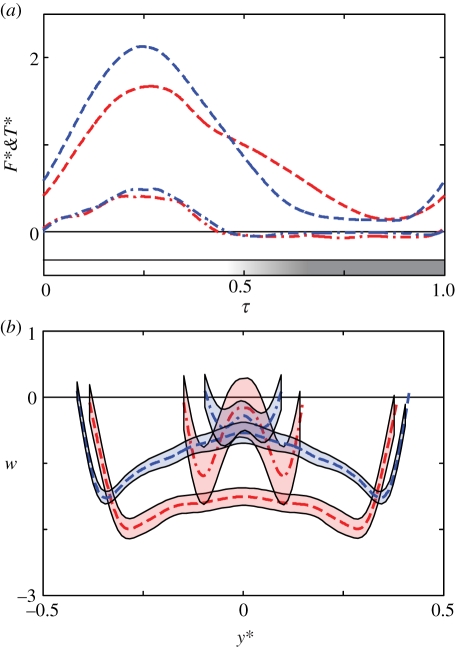
In the vortex force analysis, we will focus on the wakes at low flight speeds (approx. 3 m s−1) and intermediate flight speeds (approx. 7 m s−1). At low flight speeds, the tip vortex generated the majority of the lift forces, although lift generated by root and tail vortices were not negligible (figure 4a).  was highest during the first part of the downstroke,
  was highest during the transition from downstroke to upstroke, and
  was highest during the transition from upstroke to downstroke. At intermediate flight speeds, the root and the tail vortex lift were much lower than
  (figure 4b). At low flight speeds, the vertical movement of the root vortex followed that of the tip vortex closely (figure 4c), while at intermediate flight speeds this connection is largely lost (figure 4d). The tail vortex movement amplitude was lower than that of the other vortices.
Figure 4.
Normalized vortex lift ( L*(τ)) and vertical position (z*(τ)) throughout the wingbeat for the different wake structures, consisting of the average spline and 95% confidence interval. The left panels show the L*(τ) at 3 m s−1 (a) and at 7 m s−1 (b), while the right panels (c,d) show the corresponding z*(τ) distributions. The different wake structures are tip vortex (red), root vortex (green) and tail vortex (blue). The grey colour bar at the bottom of each panel illustrates the upstroke section of the wingstroke.
Comparing the amplitude of the vortex lift force and of the vertical path at the different flight speeds (figure 4), we observed that both increased with flight speed for the tip vortex, while they decreased with flight speed for the tail and root vortices. The total force distribution (F*(τ)) followed the same trend with flight speed as the tip vortex did (figure 5a).
Figure 5.
(a) The normalized vortex force F*(τ) (dashed lines) and corresponding thrust component T*(τ) (dashed-dotted lines) throughout the wingbeat, and (b) the downwash distribution at mid-downstroke (dashed lines) and at mid-upstroke (dashed-dotted lines), consisting of average splines and 95% confidence intervals. The red data are for 3 m s−1, while the blue results are for 7 m s−1. The grey colour bar at the bottom of panel (a) illustrates the upstroke section of the wingbeat, where the gradient indicates the difference between the two flight speeds as the one at 7 m s−1 has an earlier transition.
4.4. Downwash distribution
For all flight speeds, the vertical-induced velocities were negative throughout almost the complete wake area (downwash wake surface in figure 3). An upwash was present only between the root vortices, and for U∞ = 5 m s−1 at the start of the upstroke (figure 3b). Downwash velocities were largest at mid-downstroke and at low flight speeds (figure 5b). Also, at lower flight speeds, the spanwise downwash at mid-downstroke was more evenly distributed than at higher flight speeds. The downwash distribution at mid-upstroke varied more between measurements than the downwash at mid-downstroke, as illustrated by the larger 95% confidence interval at mid-upstroke (figure 5b).
4.5. Performance estimates
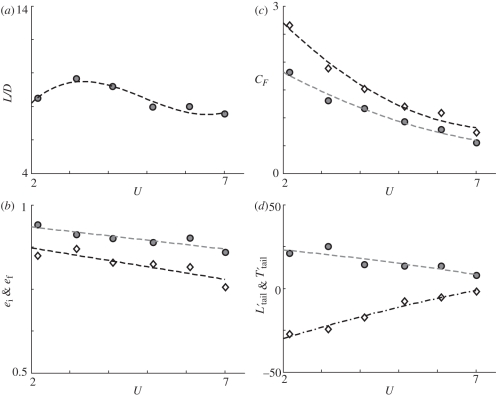
The lift-to-weight ratio based on the vortex forces was, on average, smaller than 1 (L/W = 0.93 ± 0.10). L/D was highest at 3 m s−1, while it was relatively constant for the range of U∞ = 5–7 m s−1 (figure 6a). Both the maximum and average CF were highest at the lowest flight speeds (figure 6c). The tail vortex generated positive lift and negative thrust (resulting in drag, figure 6d). Both varied almost linearly with flight speed, and were highest at the lowest flight speeds (L′tail = 23% at 2 m s−1 and L′tail = 8% at 7 m s−1). Both the span efficiency and flap efficiency had a weak negative linear trend with flight speed, and the flap efficiency was consistently lower than the span efficiency (figure 6b).
Figure 6.
Aerodynamic measures in relation to forward flight speed. (a) The lift-to-drag ratio L/D; (b) the wingbeat average span efficiency ei (filled circles) and the flap efficiency ef (open diamonds); (c) the mean (filled circles) and maximum (open diamonds) force coefficient based on Ueff at the wrist; (d) the relative contribution of the tail vortices on lift (L′tail, filled circles) and thrust (T′tail, open diamonds).
5. Discussion
5.1. Wake topology
The wake topology for the flycatchers at low flight speeds (figure 3a) consisted of tip vortices throughout the complete downstroke and weak root vortices, which were present only at the start of the downstroke. This slow flight downstroke wake topology is similar to that near Ump, and to the downstroke wake of blackcaps Sylvia atricapilla [6] and of a common swift [7] flying near Ump and Umr, which were determined using similar techniques and setups as used here. Thus, during the downstroke, slow-flying flycatchers generate a single-vortex loop structure similar to that in cruising flight of birds, and not a double-vortex loop system as in hovering hummingbirds [11]. This is consistent with our initial hypothesis. During the upstroke, slow-flying flycatchers generated strong tail vortices, while the wings were inactive. This is similar to the upstroke wakes of blackcaps [6] and swifts [7] at the lowest flight speeds at which they were measured.
5.2. Forces and downwash by the wings
As root vortices were mainly present at the start of the downstroke, and were almost completely absent at the highest measured flight speeds (figures 3 and 4a,b), the wings of the flycatcher appear to operate as a single wing configuration during the majority of the downstroke. This idea is also supported by the almost uniform spanwise downwash at mid-downstroke (figure 5b), and is very different from hovering hummingbirds, where the wings operate independently.
During the upstroke, the wings produced almost no significant lift force (figure 4) because the animals retracted their wings during the upstroke (SR = 0.091 ± 0.003) and spread the primary feathers so that air could flow through the gaps [16–18]. This mechanism appears to be very efficient in making the wings aerodynamically inactive, as hardly any streamwise vorticity is produced by the wings during the upstroke. Only at the highest flight speed, we found weak traces of vorticity behind the wings at the end of the upstroke (figure 3c).
5.3. Force and downwash by the body–tail configuration
Although the vortex shed at the upstroke is called the tail vortex, it is probably more a result of force production by the complete body–tail configuration, as a tail-less blackcap also generates vortices similar to the tail vortices we observed [6]. We still call these vortices tail vortices as they are probably shed from the tip of the delta-wing-like tail [7,31,32].
During the first part of the downstroke no tail vortices were present, but during this part of the wingbeat, the body–tail configuration probably continues to generate lift [32]. This idea is supported by the fact that αtail is positive during the downstroke (figure 2), and because no strong root vortices were present during the downstroke, as was found in the hummingbirds (inner part of the vortex loops [11]). Thus, the fact that the wing–body–tail configuration of flycatchers operates more as a single wing than that of hummingbirds is a result of the relatively active body–tail configuration in flycatchers.
As the wings are aerodynamically inactive during the upstroke [18], most of the lift at this point in the wingbeat cycle was generated by the body–tail configuration. This lift was highest at low flight speeds (figure 6d). At low flight speeds, the tail was also more spread (higher ϕ), operated at a higher αtail and flapped more (higher Aα,tail) than at intermediate flight speeds (table 2). At the lowest measured flight speed, the tail vortex system contributed 23 per cent of weight support. This is strikingly similar to the 25 per cent lift production of the wings of hovering hummingbirds during the upstroke. Hence, although slow-flying flycatchers have an inactive wing during the upstroke, the body–tail configuration mostly compensates for this, when compared with hovering hummingbirds.
The fact that the variation in both  and αtail, max was relatively large (table 2), as was the 95% confidence interval of the downwash distribution during the upstroke, could also indicate that the tail is actively used for flight control [31].
5.4. Performance estimates
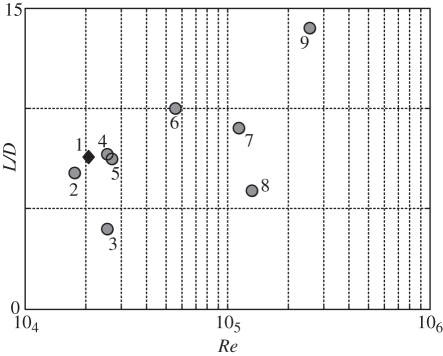
L/W was close to 1, so we almost completely resolved the flight forces in our vortex wake model. The lift-to-drag estimates for the flycatchers near Ump (L/D = 7.5 at U∞ = 7 m s−1) can be compared with L/D estimates of other bird species (figure 7; see [3] for detailed calculations). There is an expected positive correlation between maximum L/D and Re, as friction drag should reduce with Re [38]. L/D for the flycatchers is similar to that of other birds operating at the same Re range; thus, these flycatchers can be assumed to be adapted to low speed flight.
Figure 7.
Maximum lift-to-drag ratio L/D for the flapping flight of birds versus the Reynolds number Re = U∞c/ν. The different data points are: (1) the pied flycatchers in the current study at 7 m s−1; (2) blackcap Sylvia atricapilla [6]; (3) budgerigar Melopsittacus undulatus [33]; (4) common swift Apus apus [7]; (5) European robin Erithacus rubecula [3]; (6) black-billed magpie Pica pica [34]; (7) European starling Sturnus vulgaris [35]; (8) pigeon Columba livia [36]; (9) bar-headed goose Anser indicus [37].
At the lowest flight speed, both the force coefficients (CF,max = 2.7 and  = 1.8) and angles-of-attack of the wing (αmax,wing = 40.9° and
  = 34.3°) for these flycatchers were well above values expected based on quasi-steady aerodynamics at this Re [39]. Thus, we can assume that at low flight speeds, the flycatchers use some kind of unsteady aerodynamic mechanism [40], which has already been predicted for hovering flycatchers [17]. One likely candidate could be an LEV, which is also found in hovering hummingbirds [14] and in slow flight for similarly sized bats [41].
The fact that ei and ef are higher at low flight speeds (figure 6b) can be explained by the more uniformly distributed spanwise downwash (figure 5b) and the more active tail (figure 2b) at low flight speeds compared with intermediate flight speeds. To the best of our knowledge, this is the first empirical study showing span efficiency or flap efficiency of flapping flight in birds. The average flap efficiency throughout the measured flight speed range (ef = 0.82 ± 0.04) is similar to the ef = 0.83 assumed in bird flight models [1]. The average span efficiency (ei = 0.90 ± 0.03) is lower than the ei = 0.96 estimated for a gliding kestrel [42], although it is much higher than the highest estimate for a steady model wing at a similar Re (ei = 0.76 for an Eppler 387) [30]. Two other studies have estimated ei for flapping animal flight using a method similar to the one used here. The parameter ei was determined for a desert locust at mid-downstroke (ei = 0.85–0.89) [43], and for two bat species at the same flight speed range as in this study (ei = 0.81 ± 0.03 for Glossophaga soricina and ei = 0.79 ± 0.03 for Leptonycteris yerbabuenae) [23]. The value of ei for the flycatcher is similar to that of the desert locust, but it is higher than the ei for the bats. The difference in ei between bats and flycatchers can be ascribed to the relatively strong root vortices in bats, resulting in a more independent vortex structure for each wing [22,23,44,45]. These vortex structures are similar to the double-vortex loop structures in hummingbirds [11], so one can assume that hovering hummingbirds have lower ei than the slow-flying flycatchers. Hence, slow-flying flycatchers have ef similar to that assumed in cruising flight of birds, and have among the highest ei known in the animal kingdom; the relatively high body–tail lift production may be responsible for this high span efficiency [46,47].
6. Concluding remarks
Here, we studied the aerodynamics of flycatchers at flight speeds from near hovering to intermediate flight speeds. The wake topology at slow flight speeds consisted of a single-vortex loop structure during the downstroke, which is more similar to that of conventional birds at cruising flight speeds than it is to the double loop vortex wake of hovering hummingbirds. This is mainly because of the aerodynamically active tail of the slow-flying flycatchers, which results in relatively high body–tail lift, a relatively uniform spanwise downwash, and a flap efficiency similar to that in cruising flight.
The fact that, during the upstroke, the flycatcher tail generates almost the same percentage of total lift force as for the wing upstroke in hovering hummingbird, suggests that for slow-flying passerines the tail is very important, and that the upstroke cannot be called inactive, although the wings certainly are.
Acknowledgements
We would like to thank Per Henningsson and Geoff Spedding for their valuable input during discussions concerning the method and analysis, and the Falsterbo bird observatory for providing the birds. The Lavision stereo PIV system was acquired through a generous grant from the Knut and Alice Wallenberg foundation. The research was funded by the Swedish Research Council to A.H. and L.C.J. M.S.B. was supported by a Marie Curie Incoming International Fellowship. This report received support from the Centre for Animal Movement Research (CAnMove) financed by a Linnaeus grant (349-2007-8690) from the Swedish Research Council and Lund University.
References
- 1.Pennycuick C. J. 2008. Modelling the flying bird. Amsterdam, The Netherlands: Elsevier [Google Scholar]
- 2.Hedenström A., Alerstam T. 1995. Optimal flight speed of birds. Phil. Trans. R. Soc. Lond. B 348, 471–487 10.1098/rstb.1995.0082 (doi:10.1098/rstb.1995.0082) [DOI] [Google Scholar]
- 3.Hedenström A., Rosén M., Spedding G. R. 2006. Vortex wakes generated by robins Erithacus rubecula during free flight in a wind tunnel. J. R. Soc. Interface 3, 263–276 10.1098/rsif.2005.0091 (doi:10.1098/rsif.2005.0091) [DOI] [PMC free article] [PubMed] [Google Scholar]
- 4.Hedenström A., Spedding G. 2008. Beyond robins: aerodynamic analyses of animal flight. J. R. Soc. Interface 5, 595–601 10.1098/rsif.2008.0027 (doi:10.1098/rsif.2008.0027) [DOI] [PMC free article] [PubMed] [Google Scholar]
- 5.Spedding G. R., Rosén M., Hedenström A. 2003. A family of vortex wakes generated by a thrush nightingale in free flight in a wind tunnel over its entire natural range of flight speeds. J. Exp. Biol. 206, 2313–2344 10.1242/jeb.00423 (doi:10.1242/jeb.00423) [DOI] [PubMed] [Google Scholar]
- 6.Johansson L. C., Hedenström A. 2009. The vortex wake of blackcaps (Sylvia atricapilla L.) measured using high-speed digital particle image velocimetry (DPIV). J. Exp. Biol. 212, 3365–3376 10.1242/jeb.034454 (doi:10.1242/jeb.034454) [DOI] [PubMed] [Google Scholar]
- 7.Henningsson P., Muijres F. T., Hedenström A. 2010. Time-resolved vortex wake of a common swift flying over a range of flight speeds. J. R. Soc. Interface 8, 807–816 10.1098/rsif.2010.0533 (doi:10.1098/rsif.2010.0533) [DOI] [PMC free article] [PubMed] [Google Scholar]
- 8.Davies N. B. 1977. Prey selection and the search strategy of the spotted flycatcher (Muscicapa striata): a field study on optimal foraging. Anim. Behav. 25, 1016–1033 10.1016/0003-3472(77)90053-7 (doi:10.1016/0003-3472(77)90053-7) [DOI] [Google Scholar]
- 9.Fitzpatrick J. W. 1981. Search strategies of tyrant flycatchers. Anim. Behav. 29, 810–821 10.1016/S0003-3472(81)80015-2 (doi:10.1016/S0003-3472(81)80015-2) [DOI] [Google Scholar]
- 10.Altshuler D. L., Dudley R. 2003. Kinematics of hovering hummingbird flight along simulated and natural elevational gradients. J. Exp. Biol. 206, 3139–3147 10.1242/jeb.00540 (doi:10.1242/jeb.00540) [DOI] [PubMed] [Google Scholar]
- 11.Altshuler D., Princevac M., Pan H., Lozano J. 2009. Wake patterns of the wings and tail of hovering hummingbirds. Exp. Fluids 46, 835–846 10.1007/s00348-008-0602-5 (doi:10.1007/s00348-008-0602-5) [DOI] [Google Scholar]
- 12.Tobalske B. W., Warrick D. R., Clark C. J., Powers D. R., Hedrick T. L., Hyder G. A., Biewener A. A. 2007. Three-dimensional kinematics of hummingbird flight. J. Exp. Biol. 210, 2368–2382 10.1242/jeb.005686 (doi:10.1242/jeb.005686) [DOI] [PubMed] [Google Scholar]
- 13.Warrick D. R., Tobalske B. W., Powers D. R. 2005. Aerodynamics of the hovering hummingbird. Nature 435, 1094–1097 10.1038/nature03647 (doi:10.1038/nature03647) [DOI] [PubMed] [Google Scholar]
- 14.Warrick D. R., Tobalske B. W., Powers D. R. 2009. Lift production in the hovering hummingbird. Proc. R. Soc. B 276, 3747–3752 10.1098/rspb.2009.1003 (doi:10.1098/rspb.2009.1003) [DOI] [PMC free article] [PubMed] [Google Scholar]
- 15.Alexander D. E. 2004. Nature's flyers: birds, insects, and the biomechanics of flight. Baltimore, MD: JHU Press [Google Scholar]
- 16.Norberg U. M. 1990. Vertebrate flight: mechanics, physiology, morphology, ecology and evolution. Berlin, Germany: Springer [Google Scholar]
- 17.Norberg U. M. 1975. Hovering flight in the pied flycatcher (Ficedula hypoleuca). Swim. Flying Nat. 2, 869–888 [Google Scholar]
- 18.Norberg R. A. 1985. Function of vane asymmetry and shaft curvature in bird flight feathers: inference on flight ability of Archaeopteryx. In The beginnings of birds (eds Hecht M. K., Ostrom J. H., Viohl G., Wellnhofer P.), pp. 303–318 Eichstatt, Germany: Freunde des Jura-Museums. [Google Scholar]
- 19.Spedding G. R., Rayner J. M. V., Pennycuick C. J. 1984. Momentum and energy in the wake of a pigeon (Columba livia) in slow flight. J. Exp. Biol. 111, 81–102 [Google Scholar]
- 20.Spedding G. R. 1986. The wake of a jackdaw (Corvus monedula) in slow flight. J. Exp. Biol. 125, 287–307 [Google Scholar]
- 21.Rosén M., Spedding G. R., Hedenström A. 2007. Wake structure and wingbeat kinematics of a house-martin Delichon urbica. J. R. Soc. Interface 4, 659–668 10.1098/rsif.2007.0215 (doi:10.1098/rsif.2007.0215) [DOI] [PMC free article] [PubMed] [Google Scholar]
- 22.Muijres F. T., Johansson L. C., Winter Y., Hedenström A. 2011. Comparative aerodynamic performance of flapping flight in two bat species using time-resolved wake visualization. J. R. Soc. Interface 8, 1418–1428 10.1098/rsif.2011.0015 (doi:10.1098/rsif.2011.0015) [DOI] [PMC free article] [PubMed] [Google Scholar]
- 23.Muijres F. T., Spedding G. R., Winter Y., Hedenström A. 2011. Actuator disk model and span efficiency of flapping flight in bats based on time-resolved PIV measurements. Exp. Fluids. 10.1007/s00348-011-1067-5 (doi:10.1007/s00348-011-1067-5) [DOI] [Google Scholar]
- 24.Bowlin M. S. 2007. Sex, wingtip shape, and wing-loading predict arrival date at a stopover site in the Swainson's thrush (Catharus ustulatus). Auk 124, 1388–1396 10.1642/0004-8038(2007)124[1388:SWSAWP]2.0.CO;2 (doi:10.1642/0004-8038(2007)124[1388:SWSAWP]2.0.CO;2) [DOI] [Google Scholar]
- 25.Pennycuick C. J. 1989. Bird flight performance: a practical calculation manual. Oxford, UK: Oxford University Press [Google Scholar]
- 26.Pennycuick C. J., Alerstam T., Hedenström A. 1997. A new low-turbulence wind tunnel for bird flight experiments at Lund University, Sweden. J. Exp. Biol. 200, 1441–1449 [DOI] [PubMed] [Google Scholar]
- 27.Hedenström A., Muijres F., von Busse R., Johansson L., Winter Y., Spedding G. 2009. High-speed stereo DPIV measurement of wakes of two bat species flying freely in a wind tunnel. Exp. Fluids 46, 923–932 10.1007/s00348-009-0634-5 (doi:10.1007/s00348-009-0634-5) [DOI] [Google Scholar]
- 28.Wolf M., Johansson L. C., von Busse R., Winter Y., Hedenström A. 2010. Kinematics of flight and the relationship to the vortex wake of a Pallas' long tongued bat (Glossophaga soricina). J. Exp. Biol. 213, 2142–2153 10.1242/jeb.029777 (doi:10.1242/jeb.029777) [DOI] [PubMed] [Google Scholar]
- 29.Anderson J. D. 1991. Fundamentals of aerodynamics. New York, NY: McGraw-Hill [Google Scholar]
- 30.Spedding G. R., McArthur J. 2010. Span efficiencies of wings at low Reynolds numbers. J. Aircraft 47, 120–128 10.2514/1.44247 (doi:10.2514/1.44247) [DOI] [Google Scholar]
- 31.Thomas A. L. R. 1993. On the aerodynamics of birds' tails. Phil. Trans. R. Soc. Lond. B 340, 361–380 10.1098/rstb.1993.0079 (doi:10.1098/rstb.1993.0079) [DOI] [Google Scholar]
- 32.Tobalske B., Hearn J., Warrick D. 2009. Aerodynamics of intermittent bounds in flying birds. Exp. Fluids 46, 963–973 10.1007/s00348-009-0614-9 (doi:10.1007/s00348-009-0614-9) [DOI] [Google Scholar]
- 33.Tucker V. A. 1968. Respiratory exchange and evaporative water loss in the flying budgerigar. J. Exp. Biol. 48, 67–87 [Google Scholar]
- 34.Boggs D., Jenkins F., Dial K. 1997. The effects of the wingbeat cycle on respiration in black-billed magpies (Pica pica). J. Exp. Biol. 200, 1403–1412 [DOI] [PubMed] [Google Scholar]
- 35.Biewener A. A., Dial K. P., Goslow G. E. 1992. Pectoralis muscle force and power output during flight in the starling. J. Exp. Biol. 164, 1–18 10.1016/0022-0981(92)90132-T (doi:10.1016/0022-0981(92)90132-T) [DOI] [Google Scholar]
- 36.Pennycuick C. J. 1968. Power requirements for horizontal flight in the pigeon Columba livia. J. Exp. Biol. 49, 527–555 [Google Scholar]
- 37.Ward S., Bishop C. M., Woakes A. J., Butler P. J. 2002. Heart rate and the rate of oxygen consumption of flying and walking barnacle geese (Branta leucopsis) and bar-headed geese (Anser indicus). J. Exp. Biol. 205, 3347–3356 [DOI] [PubMed] [Google Scholar]
- 38.Hoerner S. F. 1965. Fluid-dynamic drag; practical information on aerodynamic drag and hydrodynamic resistance. Bakersfield, CA: Hoerner Fluid Dynamics [Google Scholar]
- 39.Laitone E. V. 1997. Wind tunnel tests of wings at Reynolds numbers below 70 000. Exp. Fluids 23, 405–409 10.1007/s003480050128 (doi:10.1007/s003480050128) [DOI] [Google Scholar]
- 40.Sane S. P. 2003. The aerodynamics of insect flight. J. Exp. Biol. 206, 4191–4208 10.1242/jeb.00663 (doi:10.1242/jeb.00663) [DOI] [PubMed] [Google Scholar]
- 41.Muijres F. T., Johansson L. C., Barfield R., Wolf M., Spedding G. R., Hedenström A. 2008. Leading-edge vortex improves lift in slow-flying bats. Science 319, 1250–1253 10.1126/science.1153019 (doi:10.1126/science.1153019) [DOI] [PubMed] [Google Scholar]
- 42.Spedding G. R. 1987. The wake of a Kestrel (Falco Tinnunculus) in gliding flight. J. Exp. Biol. 127, 45–57 [Google Scholar]
- 43.Bomphrey R. J., Taylor G. K., Lawson N. J., Thomas A. L. R. 2006. Digital particle image velocimetry measurements of the downwash distribution of a desert locust Schistocerca gregaria. J. R. Soc. Interface 3, 311–317 10.1098/rsif.2005.0090 (doi:10.1098/rsif.2005.0090) [DOI] [PMC free article] [PubMed] [Google Scholar]
- 44.Hedenström A., Johansson L. C., Wolf M., von Busse R., Winter Y., Spedding G. R. 2007. Bat flight generates complex aerodynamic tracks. Science 316, 894–897 10.1126/science.1142281 (doi:10.1126/science.1142281) [DOI] [PubMed] [Google Scholar]
- 45.Johansson L. C., Wolf M., von Busse R., Winter Y., Spedding G. R., Hedenström A. 2008. The near and far wake of Pallas' long tongued bat (Glossophaga soricina). J. Exp. Biol. 211, 2909–2918 10.1242/jeb.018192 (doi:10.1242/jeb.018192) [DOI] [PubMed] [Google Scholar]
- 46.Csicsáky M. J. 1977. Body-gliding in the zebra finch. Fortschr. Zool. 24, 275–286 [Google Scholar]
- 47.Tobalske B. W., Peacock W. L., Dial K. P. 1999. Kinematics of flap-bounding flight in the zebra finch over a wide range of speeds. J. Exp. Biol. 202, 1725–1739 [DOI] [PubMed] [Google Scholar]


