

Abstract
Red blood cells infected by the malaria parasite Plasmodium falciparum express variant surface antigens (VSAs) that evade host immunity and allow the parasites to persist in the human population. There exist many different VSAs and the differential expression of these VSAs is associated with the virulence (damage to the host) of the parasites. The aim of this study is to unravel the differences in the effect key selection forces have on parasites expressing different VSAs such that we can better understand how VSAs enable the parasites to adapt to changes in their environment (like control measures) and how this may impact the virulence of the circulating parasites. To this end, we have built an individual-based model that captures the main selective forces on malaria parasites, namely parasite competition, host immunity, host death and mosquito abundance at both the within- and between-host levels. VSAs are defined by the net growth rates they infer to the parasites and the model keeps track of the expression of, and antibody build-up against, each VSA in all hosts. Our results show an ordered acquisition of VSA-specific antibodies with host age, which causes a dichotomy between the more virulent VSAs that reach high parasitaemias but are restricted to young relatively non-immune hosts, and less virulent VSAs that do not reach such high parasitaemias but can infect a wider range of hosts. The outcome of a change in the parasite's environment in terms of parasite virulence depends on the exact balance between the selection forces, which sets the limiting factor for parasite survival. Parasites will evolve towards expressing more virulent VSAs when the limiting factor for parasite survival is the within-host parasite growth and the parasites are able to minimize this limitation by expressing more virulent VSAs.
Keywords: within- and between-host model, malaria evolution, variant surface antigens, immune evasion, selection forces
1. Introduction
Malaria parasites are subject to a diverse range of selection pressures. Key selection pressures, as reviewed in Mackinnon & Marsh [1], are parasite competition, host immunity, host death, mosquito abundance and human interventions (such as the use of antimalarial drugs). Malaria parasites have a complex life cycle, with a variety of life stages within two different hosts, which allows them to adapt and survive when changes occur in these selection pressures. It is due to this adaptability that malaria still causes the death of over one million children each year despite continuous efforts of prevention, control and eradication [1]. One trait the parasites can adapt, which is of key importance to public health, is the parasites' virulence, i.e. the harm they cause their hosts. Theoretical studies have shown that some seemingly sensible measures for control, for example vaccines that lower the growth rate of the parasites, can cause the parasites to increase their virulence to such extent that host mortality even increases [2]. Understanding how parasites adapt to changes in their environment is, therefore, important to develop safe and effective control measures [3].
Parasite virulence is considered to be an unavoidable consequence of host exploitation required for parasite reproduction [4,5]. Parasites cannot exploit their hosts limitlessly in order to increase their reproduction and transmission because increased virulence also reduces the host life expectancy and consequently can reduce parasite transmission. Classical virulence theory predicts that due to this trade-off between costs and benefits of virulence, parasites evolve towards intermediate levels of virulence [4–7]. The outcome of this virulence trade-off is influenced by several host–pathogen interactions that need to be taken into account when predicting how a pathogen's virulence will change in response to changes in its environment. Examples of these are infections that allow for multiple- or superinfection [8–10], infections where immunity to the pathogen is built up gradually [11,12], and infections where there exists a reciprocal interaction between the within-host and between-host dynamics [13]. Understanding and predicting virulence adaptation in malaria is difficult because the parasite's life cycle is so complex and all the above-mentioned host–pathogen interactions apply to malaria infections.
A substantial part of the parasites adaptability and survival in humans arises from the parasite's so-called variant surface antigens (VSAs). The best-studied VSAs in malaria, and the ones we will focus on in this paper, are Plasmodium falciparum erythrocyte membrane proteins 1 (PfEMP1s) [14–16]. These VSAs are expressed on the surface of infected red blood cells (RBC), and the immune system builds effective antibody responses against them [17,18]. In addition to being strong antigens, these VSAs have cytoadhesive properties and depending on which VSA is expressed, infected RBC can adhere to different host tissues obstructing local blood flow, which is an important virulence determinant of infection [15,19–21]. For example, VSAs have been associated with various life-threatening clinical manifestations of disease, such as cerebral malaria, pregnancy malaria and the formation of the so-called RBC ‘rosettes’ [21–24].
Each parasite carries approximately 60 genes coding for different VSAs [25,26] of which only one is expressed at a time [27,28]. When an antibody response against a particular VSA has grown strong, the small number of parasites that express a different VSA have a benefit allowing growth of parasites expressing another VSA. This causes ongoing VSA changes which evade immune recognition and allow for persistent and frequent (re)infections. In endemic areas with high exposure to infection, individuals gradually build up a repertoire of antibodies against a large set of these VSAs [18,29,30]. In concurrence to the build-up of antibodies against PfEMP1 VSAs, individuals become resistant, first to severe malaria, then to mild malaria and eventually to all clinical malaria [31,32]. The number of different VSAs in the entire parasite population is unknown, but is presumably very large [33] which is why infections remain common even at old age. Owing to these VSAs that potentially form an important link between the parasites' virulence and host immunity, understanding virulence adaptation for malaria parasites is a major challenge.
To increase our understanding of virulence adaptation in P. falciparum infections, we have developed an individual-based computational model that includes the key selective forces on malaria parasites at both the within- and between-host levels and explicitly takes feedback between these levels into account. The model keeps track of parasitaemia, VSA expression and immunity within all individual hosts of the population. We make no other assumption on the differences between the VSAs other than that parasites expressing different VSAs have different net growth rates. This assumption is based on the argument that parasites expressing VSAs with stronger cytoadhesive power are better at avoiding clearance by the spleen [34,35]. Under this assumption, we find that the model yields realistic infection dynamics and reproduces key features of the epidemiological characteristics of P. falciparum malaria.
Which VSA a parasite expresses determines how parasites perceive the pressure of selection on them. For example, the pressure of immune selection on a parasite expressing a VSA for which the host has formed antibodies will be different than on a parasite expressing a VSA for which the host has no antibodies. Also, the pressure of selection through competition between a parasite expressing a very virulent VSA and a parasite expressing a very mild VSA will be different. The first of two aims of this study is to unravel these differences in the effect key selection forces have on parasites expressing different VSAs such that we can better understand how VSAs enable P. falciparum parasites to adapt to changes in their environment. During a real-life infection, parasites switch between VSAs, which makes it very difficult to gauge the relative effect of each of the parasite's VSAs on, for example, its within-host infection duration, transmission success and its survival in general. Because parasites express only one VSA at a time we can, as a first approximation for this problem, limit the parasites to carry only one VSA while still keeping the environment in which the parasites experience competition and interact as diverse as in a scenario where parasites are able to switch VSAs. This allows us to assess the effect on a parasite of expressing one specific VSA relative to the expression of other VSAs.
The second aim of this study is to understand how alterations in the parasites' living conditions may impact the virulence of the circulating parasites. The implementation of measures to prevent and control malaria, such as drugs, vaccination and extensive use of bed nets, imposes a strong selection pressure on the parasites. Owing to the wide variety of VSAs and existing genetic recombination mechanisms that generate both new VSAs and parasites with new sets of VSAs, it is likely that virulence adaptation will affect the population-wide repertoire of VSAs available to individual parasites. To understand the effect of different alterations in the parasite's environment on parasite virulence and host mortality we run, under varying parameter and model conditions, a wide range of simulations where each parasite has a repertoire of five VSA from a much larger set of possible VSAs.
2. Model and methods
The model functions by keeping track of the individual parasitaemia of every host specifying how many RBC are infected by each infecting parasite and which VSA these RBC express. For every host, the model also keeps track of the host's antibody repertoire against specific VSAs. At the between-host level, the model keeps track of the prevalence and transmission success of every individual parasite and in addition, the degree of host immunity against every parasite at host population level. To accomplish this, the model is equipped with actors, processes, variables, parameters and iterators. The actors in our model are VSAs, parasites and hosts. The actors carry variables (the most important of these being parasite prevalence, parasitaemia, host antibodies and parasite within-host growth rate) which are under the influence of regularly executed model processes. The model processes are transmission, parasite within-host growth and competition, malaria-caused host mortality, specific host immune response, parasite extinction and recombination and host demography. The model parameters are used to set the context of the model environment and remain constant during simulation. Iterators are used to identify or denote a specific instance of an actor. An overview of the model structure is given in figure 1.
Figure 1.

Model processes: the main model processes are shown inside the numbered boxes. Within each time step (day), the processes are executed in numerical order although not every process is executed each day. The left-hand side shows how often every process takes place. Model structure: model actors are visualized with boxes. Numbered white process circles indicate on which actors the process directly acts, shaded process circles are linked to arrows. Arrows indicate either actor displacement by a process (solid) or how a process is influenced by actors or their variables (dashed).
The numbers of actors remain constant during simulation. The size of the host population is 1000. A parasite consists of a set of five different VSAs chosen at random from a pool of 1500 unique VSAs. We introduce the term parasite ‘type’ to denote parasites with a specific subset of VSAs. These parasite types bear no relation to possible ‘real-life’ strains. We allow 75 different parasite types to circulate in the model at a time.
The VSAs in the pool are ranked and their rank reflects how strong their binding is to the receptors lining the host's blood vessels. We assume that this difference in binding strength causes differences in the net growth rate because stronger binding VSAs are better at avoiding splenic clearance of the infected RBC on which they are expressed [35]. We, therefore, refer to high ranking VSAs as ‘strong’ and lower ranking VSAs as ‘weak’.
We have coded the model in the C++ programming language. Model simulations run with time steps t that are equivalent to days in real life. During a ‘day’, the processes are executed in a fixed order, although not every process is executed each day, as shown on the left-hand side of figure 1. Below we describe the model processes in detail, using lower case notation for parameters and capitals for the variables. We use iterator i to denote the ith host in the host population, iterator n to denote the nth type in the parasite type population and iterator v to denote the vth VSA in the VSA pool which is equal to its rank or ‘strength’. We use iterator j to denote the jth parasite type infecting a particular host, and iterator k to denote the expression of the kth VSA of an infecting parasite type.
2.1. Between-host infection and transmission
In real-life, a parasite can transmit to mosquitoes when a proportion of the infecting parasites differentiates into gametocytes, the life stage of the parasite that is taken up by the mosquitoes [36]. Although the exact relation between parasitaemia and gametocyte abundance is unclear [37], there is a robust relationship between parasitaemia and transmission [38,39].
The model's transmission process is executed every day and involves two steps: first, host to mosquito transmission and second, mosquito to host transmission. During the first step a pool of parasites is created that represents all parasites that have been taken up by mosquitoes. During the second step, hosts are infected with a parasite from that pool and at the end of this step the pool is deleted.
During the first step every parasite infecting a host has a probability to be added to the pool. Sij(t) is the probability of the jth parasite infecting host i to be included in the pool on day t. To take into account the time it takes parasites to form gametocytes, we impose a delay between infection and admission to the pool regulated by parameter d. Before d days of infection, Sij(t) = 0. After d days of infection, the probability of being added to the pool depends on the parasitaemia of the parasite. The parasitaemia of a parasite in a host is calculated by summing all the infected RBC expressing one of the VSAs of the parasite  (see §2.2 for details). We also introduce parameter p0 , between zero and one, that reflects how much gametocyte formation depends on parasitaemia. When, p0 = 0 (default), transmission is fully dependent on parasitaemia (implying that a fixed proportion of parasites differentiates into gametocytes), and when p0 = 1, transmission is fully independent of parasitaemia (implying that there are always enough parasites that differentiate into gametocytes to infect a mosquito regardless of parasitaemia). The probability to be added to the pool for each infecting parasite that has formed gametocytes then becomes
  . At the end of the first step, a pool has been created of parasites that are chosen through a random process but where weighed by their relative prevalence in the parasite population, i.e. they proportionally represent the parasite types in the host population. We assume that the mosquito population is large enough such that stochastic variation in the proportion of types transmitted can be neglected.
During the second step, each host is infected with probability l, the so-called transmission intensity or force of infection. The infecting parasite is randomly selected from all the parasites in the pool. To allow new parasite types (see §2.5) to enter the host population, there exists a very small probability (set at 0.0001) that a host is not infected with one of the parasites from the pool but with one of the 75 parasite types at random.
In some malaria endemic areas, the number of mosquitoes drops substantially during the yearly dry season. In the simulations where this seasonality is taken into account, we introduce a lower force of infection, ls, during a yearly recurring season of 122 days.
2.2. Within-host parasite growth
During the blood stage of malaria, the parasites infect RBC in repeated 2 day cycles [33,40]. The parasites multiply inside the RBC and at the end of the cycle the infected RBC rupture, releasing a new generation of parasites into the blood stream [40]. In the model, the parasite growth and competition process explicitly simulate the within-host dynamics of the infected RBC and VSAs expressed on their surface. Liver-stage parasite proliferation is implicitly taken into account by letting parasites enter the general bloodstream in the order of magnitude in which they are released from the liver, which is approximately 10 000 parasites (0.002 µl−1 blood) [41]. We assume that RBC homeostasis ensures that for every new generation of free parasites, there is a fixed number, r, of RBC available for infection per microlitre of blood. We set r, regardless of infection and host age, to 100 000 RBC which is approximately 20 per cent of RBC in a microlitre of blood. This 20 per cent lies in the order of magnitude of the observed maximum parasitaemia per microlitre of blood in patients [41,42]. In the model, parasitaemia is defined as the infected fraction of the r available RBC.
Each parasite infecting an RBC expresses only one of its VSAs and epigenetic mechanisms within the parasites ensure that new generations of parasites, originating from that infected RBC, remember the VSA that was expressed by its parental parasite [43]. Supported by findings of Lavstsen et al. [44], we assume that the first generation of new parasites in a host expresses each one of the VSAs they carry on an equal fraction of the RBC they infect.
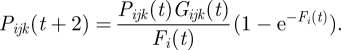
Let Pijk(t) be the fraction of r RBC that is infected and expressing VSA k of parasite type j inside host i at time t. This fraction is updated every other day. The parasitaemia caused by parasite type j is defined as the sum of the fractions corresponding to all the VSAs of that type,  . The total host parasitaemia is defined as the sum of the parasitaemias of all parasite types infecting host
 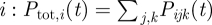 .
.
Each Pijk(t) infected RBC fraction has its own per generation multiplication, or growth, factor Gijk(t). The growth factor sets the average net number of free parasites (merozoites) released in host i per ruptured RBC expressing VSA k at the end of an infection cycle. The core of the growth factor is defined as: 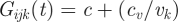 . It is composed from: c, an intrinsic, non-VSA associated, growth component; cv, a VSA-associated growth component; and vk which is how the kth VSA of parasite j ranks in the overall VSA pool (see start of §2). The VSA rank influences the growth factor in such a way that higher ranking VSAs allow for relatively fast growth (strong VSA) and lower ranking VSAs allow for relatively slower growth (weak VSA). In addition, the growth factor is influenced by the host's non-specific immune response, regulated by parameter mn, and cross-immunity through the hosts VSA-specific antibody repertoire (Ai(t)), regulated by parameter mc, explained in detail in §3.3.2. The resulting growth factor is
In each host i, the total number of free parasites (merozoites) per microlitre of blood at the end of an infection cycle is obtained by multiplying the fraction of RBC infected with parasite j expressing VSA k, with the growth factor of that fraction, then adding these products for all VSAs of all infecting types, and finally multiplying by the total number of RBC 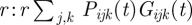 . These free parasites compete with each other for infection of the available RBC in the new infection cycle. The mean number of free parasites, Fi(t), that compete with each other for one RBC is given by:
 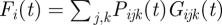 . We assume that the number of parasites each RBC encounters is Poisson-distributed with mean Fi(t). That means that a proportion
  of the r RBC will be infected in the next cycle. The fraction of RBC in host i infected by the host's jth infecting parasite expressing its kth VSA in the new infection cycle then becomes:
 |
A very small fraction (1 × 10⁻⁴%) of the most dominantly expressed VSA of an infecting parasite is allowed to switch its VSA expression evenly to the other VSAs of the parasite. We assume that each infecting parasite type j, infecting a fraction smaller than 0.013 of the r RBC available for infection per microlitre blood (i.e. if 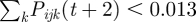 ), does not survive and is cleared from the host.
2.3. Host immunity
The model implements VSA-specific host antibodies, cross-immunity between these antibodies and non-specific, or general, immunity. Maternal immunity that is thought to protect infants in the first few months of life is ignored in our model [45,46] (see §4).
Specific host immunity of host i against VSA v is denoted by 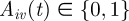 . If
. If  , the host is ‘susceptible’ for that VSA whereas if
  , the host is immune. Newborn hosts are assumed to be susceptible to all VSAs
  for all v. The total size of the antibody repertoire of host i at time t is denoted by
 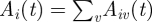 . An infected host i is triggered to start to build a specific antibody response against the kth VSA of one of its infecting parasite types j from the moment that
  . This relative antibody threshold value, ma, ensures that hosts only mount specific immunity to dominantly expressed VSA. It takes time to build an immune response and, therefore, antibodies become effective
  days after the specific response is triggered (default md = 18 days, which is within the range suggested by Collins & Jeffery [42,47]). We assume that antibody binding to a VSA clears all the infected RBC expressing that VSA and as a result the fraction of available RBC infected and expressing this VSA is set to zero from that moment. When a host has built up effective antibodies against all the VSAs of a parasite type, the type can no longer survive in the host and is cleared. Because we assume life-long antibody immunity, only parasites that carry at least one VSA for which the host has no antibodies can infect the host.
We implement cross-immunity between VSA antibodies [48,49] by letting the growth factors of the different VSA-expressing RBC fractions, Gijk(t), be affected by the total size of the host's antibody repertoire, Ai(t). In the simulations that are used to study the effect of cross-immunity, we use a parameter, mc, to regulate the degree in which the host's antibody repertoire influences the core of the parasite's net growth factor:  . When mc is zero, there is no cross-immunity and with increasing values of mc the effect of cross-immunity becomes larger.
Non-specific immunity, or general immunity, is assumed to effect the net growth of the parasites proportional to the host's total parasitaemia. This reduction in net growth is implemented like:  . Here, parameter mn (default 0.7) sets the strength of general immunity. The smaller mn is the smaller the strength of general immunity. When mn = 0, there is no general immunity.
2.4. Malaria mortality and host demography
In the model, there is malaria-induced host mortality (executed after every parasite growth process) and non-malaria-related mortality executed yearly. The probability of dying from malaria depends on the parasitaemia in the host and is scaled by a factor fm. We set factor fm to 0.0001 such that malaria mortality is slightly higher than in the demographic study by Bawah & Binka [50] to simulate a host population without any medical intervention (see electronic supplementary material, figure S3). Thus, the daily probability of dying from malaria of a host i is:  . The probability of dying of other causes than malaria is age-dependent, and adopted from the same demographic study in a high-transmission malaria area that specifies mortality rates owing to malaria and non-malaria-related causes [50]. When a host dies, it is replaced by an uninfected newborn host, with age zero and no antibodies.
2.5. Parasite recombination
Parasite types can end up not infecting any hosts owing to host immunity, parasite competition or, when at low prevalence already, owing to the model's stochasticity. Every 10 days all parasite types that are not infecting any hosts are removed, i.e. we assume they become extinct. These types are replaced by new parasites types which we assume arise from parasite recombination. In real-life, malaria parasites are known to undergo frequent recombination of their VSA set [51–53]. Most recombination takes place during sexual reproduction of the parasite inside the mosquitoes. The new parasite types in our model are assigned a set of 5VSA drawn at random from the pool of VSAs. This means not only that parasite types with new combinations of VSAs enter the host population but also that VSA's which where not represented in one of the parasite types previously, and thus unseen by the hosts, can enter the host population.
2.6. Model simulations
2.6.1. Default simulation settings
Simulations last the equivalent of 200 years. Hosts are initially assigned a random age between 0 and 75, and initially have no antibodies. The first 100 years of each simulation are regarded as a transient period for which no output is recorded to allow for the host demography and antibody repertoires to stabilize.
The default parameter values for the simulations is given in table 1. In the default simulations, there is no seasonality. The force of infection, l, is derived from infective mosquito biting rates measured in high-transmission areas [54]. For the first aim of the study, we perform simulations where the parasites carry only one VSA per parasite (1VSA simulations) and for the second aim of the study, we perform simulations where the parasites carry five VSA per parasite (5VSA simulations).
Table 1.
Default model parameter values and the variations in these parameters simulated.
| parameter | default value | variations |
|||
|---|---|---|---|---|---|
| r | 100 000 | ||||
| l | 0.7 | 0.1 | 0.2 | 0.3 | 0.9 |
| ls | — | 0.5 | 0.1 | 0.01 | 0 |
| p0 | 0 | 0.5 | 0.25 | 0.1 | 0.01 |
| d | 10 | 0 | 5 | 15 | 25 |
| fm | 0.0001 | 5× 0−5 | 1.25× 10⁻⁴ | 1.5× 10⁻⁴ | 2.5× 10⁻⁴ |
| c | 1 | 0.1 | 0.25 | 0.5 | 0.75 |
| cv | 500 | 100 | 250 | 750 | 1500 |
| mc | 1 | 0 | 0.1 | 0.5 | 1.5 |
| ma | 0.25 | 0.1 | 0.2 | 0.5 | 0.6 |
| md | 18 | 7 | 14 | 21 | 28 |
| mn | 0.7 | 0 | 0.1 | 0.5 | 0.9 |
2.6.2. Model behaviour
To determine if the model gives realistic infection dynamics, we study a 5VSA simulation with default parameter settings. In this simulation, we look at the daily parasitaemia of the hosts of which one typical host is plotted. We sample all 1000 hosts at yearly intervals to study the average parasitaemia, average number of co-infecting parasite types, average strength of the expressed VSAs and, the average size of the hosts VSA-specific antibody repertoires at all host ages.
2.6.3. First aim simulations
As part of the first aim of our study, we perform several within-host experiments to study the selection forces of parasite competition and host immunity within-host for parasites expressing different VSAs. In these experiments, we look at one isolated host of which we can manually set the size and repertoire of its VSA-specific antibodies and also all other immune functions. Under pre-defined static immune conditions, we allow one or two parasites, expressing a VSA of our choice to which the host has no antibodies to grow inside the host. For the other part of the first aim of our study, we look at several life-history traits of the parasite types from a 1VSA simulation with default parameter settings. One of those traits is the yearly number of transmission events of a parasite type. A transmission event is registered when a parasite type is selected from the parasite pool, created during the transmission process, to infect a host. A successful transmission event is registered when a transmission event results in infection of the host that happens when the parasite type selected for infection carries at least one VSA to which the host has no antibodies. The life-history trait ‘host immunity’ of a parasite type is defined as the average number of hosts that have VSA antibodies against one of its VSA during the existence of the type. We distinguish between two ways an infecting parasite can be cleared from the host, namely clearance through the build-up of specific VSA antibodies (‘immune clearance’) or clearance because parasitaemia drops below the threshold level (‘competition clearance’). The latter mostly occurs through competition with co-infecting parasites or to a lesser extent though cross-immunity. Another life-history trait we define is the fraction of all clearances of a parasite type that was due to competition clearance.
2.6.4. Second aim simulations
For the second aim of our study, we perform many 5VSA simulations in which we change one parameter value from the default value. After each simulation, we evaluate the average yearly host mortality and compare these results. We also evaluate the average rank of the VSAs dominantly expressed in infants (hosts under age one) for every simulation as a proxy for the virulence of the parasites that infect the most vulnerable hosts. The parameter values used in the simulations are shown in table 1.
3. Results and conclusions
3.1. Model behaviour
To determine if the model gives realistic infection dynamics, we study the hosts' infection burden and immunity with age. Figure 2 shows results of a 5VSA simulation with default parameter values. This same figure for a 1VSA simulation is shown in the electronic supplementary material, figure S1. The parasitaemia ( ) during the lifetime of a typical host, depicted in figure 2a, shows that parasitaemia is highest in early childhood after which parasite levels drop in between occasional peaks. Even in elderly hosts, infections still frequently occur albeit at much lower levels of parasitaemia than in younger hosts (figure 2b). Because transmission is related to parasitaemia, it is the youngest hosts that are the most infectious.
Figure 2.

Results from a 5VSA simulation under default model and parameter conditions. (a) Lifetime parasitaemia of a typical host. (Please note that a parasitaemia of 1 means only 20% of RBC are infected.) (b–d) Averages by host age from yearly samples taken of all hosts during 60 years of the simulation. (b) Average host parasitaemia. (c) Average number of co-infecting parasite types. (d) Average rank of the dominantly expressed VSA. (e) Average size of the hosts VSA-specific antibody repertoires.
Co-infections with multiple parasite types are common in the simulations and vary on average between one and five co-infecting types (figure 2c), although infections with over 10 types do occur. Despite the presence of multiple parasite types in one host, we find that infection is mostly dominated by only one VSA, especially in younger hosts. Switches in VSA dominance occur after VSA antibody build-up or through parasite competition. Because the hosts only build up specific immunity against VSAs that cross a relative infection threshold, the time it takes from infection to the build-up of specific antibodies varies depending on the competition between infecting parasite types and the infection history of the host.
The hosts' VSA antibody repertoire gradually increases with age as shown in figure 2e. We find that, owing to the differences in growth rate inferred by the VSAs expressed by the parasites, a hierarchy in VSA expression with host age arises naturally through the infection dynamics (figure 2d). Younger hosts are infected with parasites expressing stronger VSAs and as the hosts grow older and their VSA antibody repertoire increases they are infected with parasites expressing weaker VSAs as hypothesized by Hviid [35].
3.2. First aim simulations
3.2.1. Within-host competition and immunity
As part of the first aim of our study, i.e. understanding the effect of key selection forces on parasites expressing different VSAs, we show the results of several within-host experiments (figure 3) as described in §2.6.3. Figure 3a shows that, without competition, the rate at which parasitaemia increases and the maximum parasitaemia a parasite can reach is determined by the VSA expressed by the parasite and the amount of cross-immunity in the host (Ai(t)). Figure 3b shows that when two parasite types compete the parasite expressing the strongest VSA will dominate the infection and suppress the parasite expressing the weaker VSA. In the absence of specific immunity against the stronger VSA, the parasite expressing this stronger VSA will eventually out-compete the parasite with a weaker VSA.
Figure 3.

Results from within-host experiments. (a) Parasite growth is compared in three naive hosts (Ai(t) = 0, black lines) and three hosts with an antibody repertoire of size 100 (Ai(t) = 100, grey lines) infected at day = 0 with a parasite expressing a VSA with rank 5 (solid lines), 250 (dashed lines) or 750 (dotted lines). The hosts are not allowed to build any immune response during simulations. (b–d) Parasite growth is compared in naive hosts that are infected with two different parasite types. (b) Both hosts are infected at day = 0 with one parasite type expressing a VSA with rank 10 (solid lines) and the other VSA with rank 11 (dashed lines). Host 1 is allowed to build up VSA-specific antibodies during the simulation (black lines), host 2 is not (grey lines). (c) The hosts are infected with a parasite type expressing a VSA with rank 10 (solid lines) and one expressing a VSA with rank 11 (dashed lines). In host 1, both parasite types start infecting the host at day = 0 (black lines), in host 2, the parasite expressing the VSA with rank 11 does not super-infect until day = 2 (grey lines). (d) Both hosts are infected at day = 0 with a parasite type expressing a VSA with rank 100 (solid lines). At day = 2, host 1 is super-infected with a parasite type expressing a VSA with rank 75 (black dashed line), host 2 is super-infected with a parasite strain expressing a VSA with rank 125 (grey dashed line).
Under some circumstances, parasites expressing a weaker VSA do better in the within-host competition than parasites expressing a stronger VSA. Figure 3c shows that parasites entering a host later can have a benefit over resident parasites, even if the parasite that enters the host later expresses a weaker VSA. This occurs when the parasite that infects later grows slow enough to stay below the threshold for the build-up of specific immunity (i.e. it ‘hides’ from the immune system) without being pushed under the clearance threshold by the resident parasite. Figure 3d shows that parasites expressing weaker VSA can be better at hiding from specific immunity than parasites expressing stronger VSA.
Gametocyte formation takes 10 days and the time it takes to build up antibodies from the moment the immune threshold is crossed is 18 days. Therefore, any parasite that is not cleared by competition can transmit for at least 8 days. The results from the within-host experiments shows that parasites expressing strong VSAs can reach high parasitaemia quickly, hereby maximizing transmission during the time before specific immunity clears infection. During this period, they can also out-compete parasites expressing weaker VSAs. Parasites expressing weaker VSAs, in co-infections, are better at hiding from specific immunity, which allows them to stretch the period in which they can transmit long beyond 8 days, albeit at lower parasitaemia and thus smaller transmission probability per day.
To further understand the effect of the key selection forces on parasites expressing different VSAs, we also run a full 1VSA simulation with default parameter settings and study several life-history traits of the parasites (figure 4). The electronic supplementary material has the same figure (electronic supplementary material, figure S2) for a 5VSA simulation that shows how difficult it is to gauge the effect on a parasite of carrying a specific VSA when the parasites carry 5 VSA because the results are diluted and distorted by the other VSAs of the parasite.
Figure 4.

Results from a 1VSA simulation under default parameter conditions. Panels show averages from all parasite types that existed during the simulation (approx. 18 000) and carried the specified VSA. (a) Daily number of transmission events, i.e. how many times a day the parasite is selected to infect a host. (b) Proportion of successful transmission, i.e. transmission events to hosts without protecting VSA-specific immunity. (c) Number of hosts with specific antibodies against the VSA carried. (d) Proportion of clearances from the host owing to competition (opposed to immunity clearance). (e) Lifetime of the parasite types in years. (f) Yearly number of hosts dying from malaria while infected by the parasite type.
3.2.2. Mosquito abundance
Mosquito abundance is an important selective force that acts on the boundary of the within- and between-host levels. It is most important to parasites that have a low frequency of transmission because when the number of mosquitoes drops, the total number of transmission events drops and parasites that have a lower frequency of transmission will be more likely to become extinct. Although the model does not take the mosquito population explicitly into account, it does keep track of the number of transmission events for each parasite type. Figure 4a shows that parasites carrying weaker VSAs experience much fewer transmission events than parasites carrying a stronger VSA, meaning that the parasites that carry weaker VSAs are more vulnerable to drops in mosquito abundance.
3.2.3. Competition and immunity
Confirming what we would expect from the within-host experiments, the parasites that carry strong VSAs are mostly cleared from hosts by specific immunity while the parasites that carry weak VSAs are more often cleared by competition (figure 4d). We also find that at the host population level, there are many more hosts that have specific immunity against stronger VSAs than against weaker VSAs (figure 4c). Consequently, the fraction of transmission events that result in infection, i.e. a successful transmission event is very low for parasites that carry a strong VSA (figure 4b).
Figure 4e shows the resulting average lifetime of parasite types carrying a specific VSA. This result does not imply that there is an ‘optimal’ VSA for the parasites. The benefit to a parasite of expressing a certain VSA is always relative to the other VSAs expressed in the host and to the VSA-specific antibodies that exist in the host and the host population at the time of expression. These other VSAs expressed and the anti-VSA antibodies in the population are continually fluctuating, as such, an optimal VSA does not really exist.
3.2.4. Host mortality
Host death is a selective force that is experienced by the parasite types both at the within- and between-host levels. Within-host, host death stops infection and transmission of all infecting parasite types; at the between-host level, it removes a host from the population that was susceptible for some VSAs and immune for others. Parasites expressing strong VSAs can reach the highest parasitaemias, mainly in children, and therefore cause more host death, than weaker VSAs (figure 4f). The loss of transmission owing to host death is hence more important for parasites expressing a stronger VSA.
3.2.5. First aim conclusions
In conclusion, the differences in the effect that key selection forces have on parasites expressing different VSAs result in differences in the contribution the VSAs have to the survival of the parasites carrying them as follows.
Strong VSAs allow for high parasitaemia in the infected host which means that per day of infection the parasite can infect more mosquitoes. Strong VSAs also contribute to the survival of the parasite by suppressing or even clearing other co-infecting parasites. A high proportion of the host population has specific immunity against strong VSAs; therefore strong VSAs hardly contribute to the number of hosts the parasite can infect. Because they allow for high parasitaemia strong VSAs contribute to loss of infection and transmission of the parasiteowing to host death.
Weak VSAs contribute little to transmission per day but in some cases allow for a longer infection time because they do not trigger a specific immune response so quickly. Their largest contribution to parasite survival is in terms of the number of hosts the parasite can infect since the proportion of hosts with specific immunity against the weaker VSAs is very small. Weak VSAs hardly contribute to loss of infection and transmission owing to host death.
3.3. Second aim simulations
The second aim of this study is to understand how alterations in the parasites' living conditions may impact the virulence of the circulating parasites. For this purpose, we run a wide range of 5VSA simulations with different parameter settings and look at both host mortality and the rank, i.e. strength of the VSAs expressed in infants (figure 5). The strength of expressed VSAs is used as a proxy for parasite virulence.
Figure 5.

Results from 5VSA simulations. Effect of within- and between-host parameter variations on the yearly host mortality rate and the average dominantly expressed VSA in infants (hosts under the age of one). The horizontal axes indicate an increase in the effects of one of the variations, values are as follows (asterisks indicate the default values): VSA-related growth factor, cv (1: 100, 2: 250, 3: 500*, 4: 750, 5: 1500), intrinsic growth factor, c (1: 0.1, 2: 0.25, 3: 0.5, 4: 0.75, 5: 1*), malaria mortality probability, fm (1: 5 × 10⁻⁵, 2: 1 × 10⁻⁴*, 3: 1.25 × 10⁻⁴, 4: 1.5 × 10⁻⁴, 5: 2.5 × 10⁻⁴), cross-immunity, mc (1: 0, 2: 0.1, 3: 0.5, 4: 1*, 5: 1.5), relative antibody threshold, ma (1: 0.1, 2: 0.2, 3: 0.4*, 4: 0.5, 5: 0.6), general immunity, mn (1: 0, 2: 0.1, 3: 0.5, 4: 0.7*, 5: 0.9), antibody building time, md (1: 7, 2: 14, 3: 18*, 4: 21, 5: 28), force of infection, l (1: 0.1, 2: 0.2, 3: 0.3, 4: 0.7*, 5: 0.9), seasonality, ls (1: 0.7*, 2: 0.5, 3: 0.1, 4: 0.01, 5: 0), gametocyte formation time, d (1: 0, 2: 5, 3: 10*, 4: 15, 5: 25), parasitaemia dependant transmission and, p0 (1: 0.5, 2: 0.25, 3: 0.1, 4: 0.01, 5: 0*).
3.3.1. Parasite growth and host mortality
Decreasing parasite growth either by the intrinsic component, c, or by the VSA-specific component, cv, decreases host mortality (figure 5a) but increases the strength of the VSAs expressed in infants (figure 5b) because the parasites compensate for the loss in growth potential. Increasing the probability of malaria-induced host death increases host mortality yet has a minimal effect on the VSAs expressed in infants. That the parasite population does not move towards expressing weaker VSAs even though parasites expressing strong VSAs are most affected by host mortality might be because these parasites are instantly compensated when a deceased host is replaced by a non-immune new host which are mostly infected by parasites expressing strong VSAs.
3.3.2. Host immunity
A general observation from model simulations with different immune parameter values is that any change that improves the performance of the host's immune system lowers host mortality (figure 5c). Even though an increase in general immunity lowers the growth potential of the parasites, they do not move towards expressing stronger VSAs as we found when we decreased the growth rate of the parasites (figure 5d). We believe this is because expressing stronger VSAs cannot compensate for the loss of growth since it is the parasites expressing the stronger VSAs that are most suppressed by general immunity owing to its relation with host parasitaemia. Changes in the time it takes to build up antibodies do not affect the strength of the VSAs expressed in infants (figure 5d). This could be because these changes are equally beneficial or detrimental to parasites expressing any VSA. With increasing cross-immunity the parasites move towards expressing stronger VSAs. An increase in cross-immunity mostly affects parasites expressing weaker VSA because they are expressed in older hosts with a larger VSA antibody repertoire and hence more cross-immunity.
3.3.3. Transmission
Decreasing the transmission intensity, whether all year round, l, or during a yearly recurring season, ls, decreases the strength of the VSAs expressed in infants (figure 5f). Thus at lower transmission intensity, it becomes more beneficial for the parasites to express a VSA to which very few hosts have specific immunity than to express a VSA that can reach higher parasitaemia. This means that the limiting factor to parasite survival is finding enough hosts without specific immunity to infect, rather than the within-host growth rate of the parasites or within-host competition. Notably, only when the transmission intensity is decreased all year round does it decrease host mortality (figure 5e).
Changes in the time it takes to form gametocytes had no effect on either host mortality or the VSA expressed in infants (figure 5e,f), which suggests that the gametocyte formation time is not the limiting factor to parasite transmission and survival. A small increase in the probability of parasite transmission independent of parasitaemia increases host mortality and the strength of the expressed VSAs. This is likely owing to an increase in transmission and we saw the same effect when the transmission intensity was increased. When the parasitaemia independent transmission is increased even further, host mortality decreases again and so does the strength of the expressed VSAs. We argue that this is because now all infecting parasites transmit with almost equal probability and thus there is much less need to reach high parasitaemia and express strong VSAs.
3.3.4. Second aim conclusions
The second aim of this study is to understand when and how alterations in the parasites' living conditions may impact the VSAs, and thus the virulence, of the circulating parasites, in particular those expressed in infants. When the parasites' environment does not change the interplay of the selective forces on the parasites will reach an equilibrium at which there is an average VSA strength expressed in infants that is most optimal for parasite survival. We learned from our first aim simulations that the different VSAs contribute differently to the parasites' survival. Changes in virulence owing to parameter changes are an indication to what the limiting factors are to parasite survival. Parasites will evolve towards expressing stronger VSAs when (one of) the limiting factor(s) for parasite survival is the within-host parasite growth and the parasites are able to minimize this limitation by expressing stronger VSAs.
4. Discussion
In this study, we have built an individual-based computational model to better understand how VSAs enable P. falciparum parasites to adapt to changes in their environment and how this adaptability can affect the success of malaria prevention and control measures. Malaria prevention and control measures are aimed to reduce host morbidity and mortality. From the parasites' perspective, these measures are yet another force of selection that interacts with the existing selective forces. Because these forces are connected across the within- and between-host infection levels to fully understand how these selective forces interact, it is crucial to model these forces at both levels explicitly. Our model does this and as a result it reproduces key features of the epidemiological characteristics of P. falciparum infections and VSA-specific immunity.
Our results show how parasites expressing different VSAs perceive the pressure of the selection forces differently at both the within- and between-host levels. We also show the effect of a wide range of changes to the parasites' living conditions on host mortality and parasite virulence in infants. From the simulations, we learn that the outcome of a change in the parasite's environment in terms of parasite virulence depends on the balance between the selection forces which sets the limiting factor for parasite survival.
Owing to limitations in existing data, computational restrictions and to maintain transparency, our model is a simplification of reality and not designed to mimic the exact balance between the forces of selection. In addition, this balance in reality is likely to differ between communities owing to regional differences. Therefore, while our results can be used as an indication to show how the virulence of parasites may change in response to certain measures they should not be interpreted as accurate predictions.
In our 5VSA default simulations, the limiting factor for parasite survival is finding a non-immune host; therefore, when the transmission intensity is decreased the virulence of the parasites decreases. However, when the limiting factor to survival is, e.g. the within-host competition between parasites, the virulence of the parasites would increase when the transmission intensity is decreased.
There are a few parameter changes for which we can compare our results with findings from other theoretical or experimental studies. That a decrease in growth rate of the parasites leads to an increase in virulence has also been found by Gandon et al. [2] and Mackinnon et al. [55]. The virulence of circulating parasites in regions with different transmission intensities (i.e. the number of infective bites per day) has been studied and shows that with decreasing transmission intensity the proportion of severe malaria cases that are caused by malarial anaemia decreases while the proportion of cases owing to cerebral malaria increases [56,57]. Because in our model, we do not specify the location in the body where the VSAs preferentially adhere these findings are not easily comparable. However, a decrease in malarial anaemia could indicate that there are less strong VSAs to cause ongoing high parasitaemia.
Below we discuss some of the simplifications and assumptions that were made in order to create the model and the implications these may have on our results.
4.1. Growth rate differences related to variant surface antigen expression
The expression of VSAs gives infected RBC the capacity to sequester in body tissues and reduce their passage through the spleen where infected RBC are recognized and cleared from the blood. Following Hviid [35], we assume that the strength of the binding between a VSA and its host receptor is a measure for how well infected RBC can avoid splenic clearance and consequently we envisage different VSAs as conferring different net growth rates to parasites.
Classical work on VSAs in African Trypanosomas parasites [58] shows that the observed differences in growth rates alone, between parasites expressing different VSAs cannot account for the ordered appearance of dominant VSAs during Trypanosoma infection as reported in the literature. This work is often referred to in the context of malaria VSA models. However, Trypanosomas differ from malaria parasites in many ways. For our analysis, notably, the observed differences in growth rate between Trypanosomas parasites expressing different VSA are very small compared with those of P. falciparum parasites [59]. In addition, Trypanosomas VSAs do not have adhesion properties like the VSAs of P. falciparum do.
In our model, the differences in growth rate allow for dominant VSA expression and regular changes in this dominance owing to the build-up of antibodies against the dominant VSA or competition with a newly infecting parasite. Because every host has a different history of infection, every host also has a unique order in which it builds up antibodies against the VSA. However, on the host population level, we find that on average there is a generic order in dominant VSA expression and host age, where antibodies against the stronger VSAs are acquired earlier in life. A recent study indeed shows that there appears to be such a generic order in which antibodies against VSAs are acquired [34]. The transmission intensity does not influence this order in antibody acquisition but merely dictates its pace.
It is, however, likely that dominant VSA expression and the antigenic variation as seen in malaria infections are not dictated by differences in growth rate alone, especially in elderly hosts where the differences in growth rate between the VSA is much smaller. Various other mechanisms have been suggested in the literature [60–62]. A model by Recker et al. [63] has shown that, e.g., transient cross-reactive immune responses are able to orchestrate realistic within-host antigenic variation. However, this mechanism on its own does not generate a generic order of antibody acquisition at host population level which is what makes parasites expressing different VSA experience selection pressures such as competition and immunity differently. For this, we believe that a feedback mechanism through the population as incorporated in our model is required.
4.2. Disease and immunity
Malaria mortality in the model depends only on host parasitaemia while in reality disease and disease outcome is more complex. For example, the location of infected RBC sequestration and the formations of rosettes by infected RBC are important factors in disease outcome [24]. Consequently, VSAs that have disease-exacerbating properties will cause more host mortality than other VSAs that infer the same growth rate but do not have these properties. In our model, we do not take into account maternal antibodies which are thought to protect infants the first few months of life. Because of these antibodies, from the parasites' perspective, infants behave like adults for a few months after which they become non-immune again until they build up their own antibodies. Therefore, apart from a somewhat reduced infant death (which would then happen at a slightly older age), the overall dynamics will largely stay the same. It is not clear whether immunity against malaria, in particular, VSA-specific antibodies, is life long. Here, we assume that VSA-specific immunity is effectively life long owing to frequent re-infections that cause sufficient antibody boosting. If future studies find that specific VSA antibodies cannot be assumed to effectively provide life-long protection, this can be implemented in the model. In that case also older hosts could be infected by parasites expressing strong VSAs which would change the balance of the selection forces as we present here considerably. We have assumed that the gametocytes of a parasite are cleared when the parasite is cleared from a host, however, there could be a delay in gametocyte clearance as they carry different VSAs and are relatively long-lived [64]. Depending on the extend of the delay, this may have a significant impact on transmission.
4.3. Peripheral blood compartment
We have made a few assumptions regarding the RBC in the model. Firstly, the blood volume of the hosts in our model is equal for hosts of all ages, whereas, in reality, blood volume increases with age until adulthood. Secondly, all parasite types in our model are equal except for their VSAs, while in reality some parasite types specialize in infecting RBC of specific ages [65]. Thirdly, in the model, every within-host infection cycle, a fixed amount of new uninfected RBC becomes available for infection. In reality, at very high parasitaemia, new RBC production is not able to keep up the formation of new RBC, hence patients become anaemic. We argue that in all these cases, parasite types have fewer RBC to infect than in the model which would imply that the within-host competition in reality is likely to be stronger than in our model.
4.4. Antigenically distinct groups of variant surface antigen
From serological and genomic data, there is evidence that the immense VSA pool is organized into specific groups of VSAs [66–70]. It is unclear how the VSAs from the different groups are represented in individual parasite genomes, but it seems that all parasites carry at least a few members from each group [68]. Antibodies against VSAs from the so-called group A VSAs seem to be more cross-reactive than antibodies against VSAs from other groups [71]. Also, group A VSAs have been associated with more severe disease and appear to be mostly expressed at young age [23,71].
In our model, we only assume one difference between the VSAs, namely the difference in growth rate inferred by different VSAs to fully understand the consequence of that assumption. We expect that the effect on our results, of adding antigenically distinct groups of VSAs to the model, depends on the order in which antibodies against VSAs from each of the groups is acquired by the hosts. In our model, all VSAs experience equal inhibition from cross-immunity which, on average, is also the case if antibodies against VSA from all groups are acquired at equal pace. However, if e.g. antibodies against group A VSAs are acquired earlier in life, on average, VSAs from this group will experience more inhibition from cross-immunity than VSAs from other groups. We predict that this will enhance the dichotomy we find in our model between strong VSA that allow for high parasitaemia only in young relatively non-immune hosts, and weaker VSAs that allow for infection of a wider range of hosts but lower parasitaemia. However, implementation of such grouping into the model is necessary to fully understand the effect of this extra level of organization on the dynamics of the VSAs.
4.5. Conclusion
The first aim of this study was to unravel the differences in the effect key selection forces have on parasites expressing different VSAs such that we can better understand how VSAs enable P. falciparum parasites to adapt to changes in their environment. We find distinct differences in the perception of the key selection forces by parasites expressing strong VSAs and weak VSAs. With this background, we continued to the second aim of our study that was to understand how alterations in the parasites' environment may impact the virulence of the circulating parasites. We find that an increase in virulence only occurs when (one of) the limiting factor(s) for parasite survival is the within-host parasite growth, and a change to the environment strengthens this limiting factor. To be able to make predictions on whether implementation of control measures in a community will increase the virulence of the circulating parasites, a thorough understanding is needed of the interactions and balance between the selective forces on the parasites in this community.
References
- 1.Mackinnon M. J., Marsh K. 2010. The selection landscape of malaria parasites. Science 328, 866–871 10.1126/science.1185410 (doi:10.1126/science.1185410) [DOI] [PubMed] [Google Scholar]
- 2.Gandon S., Mackinnon M. J., Nee S., Read A. F. 2001. Imperfect vaccines and the evolution of pathogen virulence. Nature 414, 751–756 10.1038/414751a (doi:10.1038/414751a) [DOI] [PubMed] [Google Scholar]
- 3.Mackinnon M. J., Read A. F. 2004. Virulence in malaria: an evolutionary viewpoint. Phil. Trans. R. Soc. Lond. B 359, 965–986 10.1098/rstb.2003.1414 (doi:10.1098/rstb.2003.1414) [DOI] [PMC free article] [PubMed] [Google Scholar]
- 4.Anderson R. M., May R. M. 1982. Coevolution of hosts and parasites. Parasitology 85, 411–426 10.1017/S0031182000055360 (doi:10.1017/S0031182000055360) [DOI] [PubMed] [Google Scholar]
- 5.May R. M., Anderson R. M. 1983. Epidemiology and genetics in the coevolution of parasites and hosts. Proc. R. Soc. Lond. B 219, 281–313 10.1098/rspb.1983.0075 (doi:10.1098/rspb.1983.0075) [DOI] [PubMed] [Google Scholar]
- 6.Ewald P. W. 1983. Host-parasite relations, vectors, and the evolution of disease severity. Annu. Rev. Ecol. Syst. 14, 465–485 10.1146/annurev.es.14.110183.002341 (doi:10.1146/annurev.es.14.110183.002341) [DOI] [Google Scholar]
- 7.Read A. F. 1994. The evolution of virulence. Trends Microbiol. 2, 73–76 10.1016/0966-842X(94)90537-1 (doi:10.1016/0966-842X(94)90537-1) [DOI] [PubMed] [Google Scholar]
- 8.Gandon S., Jansen V. A., van Baalen M. 2001. Host life history and the evolution of parasite virulence. Evolution 55, 1056–1062 10.1554/0014-3820(2001)055[1056:HLHATE]2.0.CO;2 (doi:10.1554/0014-3820(2001)055[1056:HLHATE]2.0.CO;2) [DOI] [PubMed] [Google Scholar]
- 9.Gandon S., van Baalen M., Jansen V. A. A. 2002. The evolution of parasite virulence, superinfection, and host resistance. Am. Nat. 159, 658–669 10.1086/339993 (doi:10.1086/339993) [DOI] [PubMed] [Google Scholar]
- 10.Bell A. S., de Roode J. C., Sim D., Read A. F. 2006. Within-host competition in genetically diverse malaria infections: parasite virulence and competitive success. Evolution 60, 1358–1371 10.1554/05-611.1 (doi:10.1554/05-611.1) [DOI] [PubMed] [Google Scholar]
- 11.Mackinnon M. J., Read A. F. 2004. Immunity promotes virulence evolution in a malaria model. PLoS Biol. 2, e230. 10.1371/journal.pbio.0020230 (doi:10.1371/journal.pbio.0020230) [DOI] [PMC free article] [PubMed] [Google Scholar]
- 12.Alizon S., van Baalen M. 2008. Acute or chronic? within-host models with immune dynamics, infection outcome, and parasite evolution. Am. Nat. 172, E244–E256 10.1086/592404 (doi:10.1086/592404) [DOI] [PubMed] [Google Scholar]
- 13.Mideo N., Alizon S., Day T. 2008. Linking within- and between-host dynamics in the evolutionary epidemiology of infectious diseases. Trends Ecol. Evol. 23, 511–517 10.1016/j.tree.2008.05.009 (doi:10.1016/j.tree.2008.05.009) [DOI] [PubMed] [Google Scholar]
- 14.Howard R. J., Barnwell J. W., Rock E. P., Neequaye J., Ofori-Adjei D., Maloy W. L., Lyon J. A., Saul A. 1988. Two approximately 300 kilodalton Plasmodium falciparum proteins at the surface membrane of infected erythrocytes. Mol. Biochem. Parasitol. 27, 207–223 10.1016/0166-6851(88)90040-0 (doi:10.1016/0166-6851(88)90040-0) [DOI] [PubMed] [Google Scholar]
- 15.Biggs B. A., Anders R. F., Dillon H. E., Davern K. M., Martin M., Petersen C., Brown G. V. 1992. Adherence of infected erythrocytes to venular endothelium selects for antigenic variants of Plasmodium falciparum. J. Immunol. 149, 2047–2054 [PubMed] [Google Scholar]
- 16.Craig A., Scherf A. 2001. Molecules on the surface of the Plasmodium falciparum infected erythrocyte and their role in malaria pathogenesis and immune evasion. Mol. Biochem. Parasitol. 115, 129–143 10.1016/S0166-6851(01)00275-4 (doi:10.1016/S0166-6851(01)00275-4) [DOI] [PubMed] [Google Scholar]
- 17.Bull P. C., Marsh K. 2002. The role of antibodies to Plasmodium falciparum-infected-erythrocyte surface antigens in naturally acquired immunity to malaria. Trends Microbiol. 10, 55–58 10.1016/S0966-842X(01)02278-8 (doi:10.1016/S0966-842X(01)02278-8) [DOI] [PubMed] [Google Scholar]
- 18.Ofori M. F., Dodoo D., Staalsoe T., Kurtzhals J. A. L., Koram K., Theander T. G., Akanmori B. D., Hviid L. 2002. Malaria-induced acquisition of antibodies to Plasmodium falciparum variant surface antigens. Infect. Immunol. 70, 2982–2988 10.1128/IAI.70.6.2982-2988.2002 (doi:10.1128/IAI.70.6.2982-2988.2002) [DOI] [PMC free article] [PubMed] [Google Scholar]
- 19.Magowan C., Wollish W., Anderson L., Leech J. 1988. Cytoadherence by Plasmodium falciparum-infected erythrocytes is correlated with the expression of a family of variable proteins on infected erythrocytes. J. Exp. Med. 168, 1307–1320 10.1084/jem.168.4.1307 (doi:10.1084/jem.168.4.1307) [DOI] [PMC free article] [PubMed] [Google Scholar]
- 20.Newbold C. I., Craig A. G., Kyes S., Berendt A. R., Snow R. W., Peshu N., Marsh K. 1997. Pfemp1, polymorphism and pathogenesis. Ann. Trop. Med. Parasitol. 91, 551–557 10.1080/00034989760923 (doi:10.1080/00034989760923) [DOI] [PubMed] [Google Scholar]
- 21.Pasternak N. D., Dzikowski R. 2009. Pfemp1: an antigen that plays a key role in the pathogenicity and immune evasion of the malaria parasite Plasmodium falciparum. Int. J. Biochem. Cell Biol. 41, 1463–1466 10.1016/j.biocel.2008.12.012 (doi:10.1016/j.biocel.2008.12.012) [DOI] [PubMed] [Google Scholar]
- 22.Miller L. H., Good M. F., Milon G. 1994. Malaria pathogenesis. Science 264, 1878–1883 10.1126/science.8009217 (doi:10.1126/science.8009217) [DOI] [PubMed] [Google Scholar]
- 23.Rottmann M., Lavstsen T., Mugasa J. P., Kaestli M., Jensen A. T. R., Müller D., Theander T., Beck H.-P. 2006. Differential expression of var gene groups is associated with morbidity caused by Plasmodium falciparum infection in tanzanian children. Infect. Immun. 74, 3904–3911 10.1128/IAI.02073-05 (doi:10.1128/IAI.02073-05) [DOI] [PMC free article] [PubMed] [Google Scholar]
- 24.Kaestli M., Cockburn I. A., Cortés A., Baea K., Rowe J. A., Beck H.-P. 2006. Virulence of malaria is associated with differential expression of Plasmodium falciparum var gene subgroups in a case-control study. J. Infect. Dis. 193, 1567–1574 10.1086/503776 (doi:10.1086/503776) [DOI] [PMC free article] [PubMed] [Google Scholar]
- 25.Baruch D. I., Pasloske B. L., Singh H. B., Bi X., Ma X. C., Feldman M., Taraschi T. F., Howard R. J. 1995. Cloning the P. falciparum gene encoding PfEMP1, a malarial variant antigen and adherence receptor on the surface of parasitized human erythrocytes. Cell 82, 77–87 10.1016/0092-8674(95)90054-3 (doi:10.1016/0092-8674(95)90054-3) [DOI] [PubMed] [Google Scholar]
- 26.Templeton T. J. 2009. The varieties of gene amplification, diversification and hypervariability in the human malaria parasite, Plasmodium falciparum. Mol. Biochem. Parasitol. 166, 109–116 10.1016/j.molbiopara.2009.04.003 (doi:10.1016/j.molbiopara.2009.04.003) [DOI] [PubMed] [Google Scholar]
- 27.Chen Q., Fernandez V., Sundström A., Schlichtherle M., Datta S., Hagblom P., Wahlgren M. 1998. Developmental selection of var gene expression in Plasmodium falciparum. Nature 394, 392–395 10.1038/28660 (doi:10.1038/28660) [DOI] [PubMed] [Google Scholar]
- 28.Dzikowski R., Li F., Amulic B., Eisberg A., Frank M., Patel S., Wellems T. E., Deitsch K. W. 2007. Mechanisms underlying mutually exclusive expression of virulence genes by malaria parasites. EMBO Rep. 8, 959–965 10.1038/sj.embor.7401063 (doi:10.1038/sj.embor.7401063) [DOI] [PMC free article] [PubMed] [Google Scholar]
- 29.Kyes S. A., Kraemer S. M., Smith J. D. 2007. Antigenic variation in Plasmodium falciparum: gene organization and regulation of the var multigene family. Eukaryot. Cell 6, 1511–1520 10.1128/EC.00173-07 (doi:10.1128/EC.00173-07) [DOI] [PMC free article] [PubMed] [Google Scholar]
- 30.Vestergaard L. S., et al. 2008. Differences in human antibody reactivity to Plasmodium falciparum variant surface antigens are dependent on age and malaria transmission intensity in northeastern tanzania. Infect. Immun. 76, 2706–2714 10.1128/IAI.01401-06 (doi:10.1128/IAI.01401-06) [DOI] [PMC free article] [PubMed] [Google Scholar]
- 31.Chen Q. 2007. The naturally acquired immunity in severe malaria and its implication for a PfEMP-1 based vaccine. Microbes Infect. 9, 777–783 10.1016/j.micinf.2007.02.009 (doi:10.1016/j.micinf.2007.02.009) [DOI] [PubMed] [Google Scholar]
- 32.Mackintosh C., Christodoulou Z., Mwangi T., Kortok M., Pinches R., Williams T., Marsh K., Newbold C. 2008. Acquisition of naturally occurring antibody responses to recombinant protein domains of Plasmodium falciparum erythrocyte membrane protein 1. Malar. J. 7, 155. 10.1186/1475-2875-7-155 (doi:10.1186/1475-2875-7-155) [DOI] [PMC free article] [PubMed] [Google Scholar]
- 33.Ferreira M. U., Zilversmit M., Wunderlic G. 2007. Origins and evolution of antigenic diversity in malaria parasites. Curr. Mol. Med. 7, 588–602 10.2174/156652407781695756 (doi:10.2174/156652407781695756) [DOI] [PubMed] [Google Scholar]
- 34.Cham G. K. K., et al. 2009. Sequential, ordered acquisition of antibodies to Plasmodium falciparum erythrocyte membrane protein 1 domains. J. Immunol. 183, 3356–3363 10.4049/jimmunol.0901331 (doi:10.4049/jimmunol.0901331) [DOI] [PubMed] [Google Scholar]
- 35.Hviid L. 2010. The role of Plasmodium falciparum variant surface antigens in protective immunity and vaccine development. Hum. Vaccin. 6, 84–89 [DOI] [PubMed] [Google Scholar]
- 36.Dixon M. W. A., Thompson J., Gardiner D. L., Trenholme K. R. 2008. Sex in plasmodium: a sign of commitment. Trends Parasitol. 24, 168–175 10.1016/j.pt.2008.01.004 (doi:10.1016/j.pt.2008.01.004) [DOI] [PubMed] [Google Scholar]
- 37.Mideo N., Day T. 2008. On the evolution of reproductive restraint in malaria. Proc. R. Soc. B 275, 1217–1224 10.1098/rspb.2007.1545 (doi:10.1098/rspb.2007.1545) [DOI] [PMC free article] [PubMed] [Google Scholar]
- 38.Ross A., Killeen G., Smith T. 2006. Relationships between host infectivity to mosquitoes and asexual parasite density in Plasmodium falciparum. Am. J. Trop. Med. Hyg. 75, 32–37 [DOI] [PubMed] [Google Scholar]
- 39.Drakeley C., Sutherland C., Bousema J. T., Sauerwein R. W., Targett G. A. T. 2006. The epidemiology of Plasmodium falciparum gametocytes: weapons of mass dispersion. Trends Parasitol. 22, 424–430 10.1016/j.pt.2006.07.001 (doi:10.1016/j.pt.2006.07.001) [DOI] [PubMed] [Google Scholar]
- 40.Miller L. H., Baruch D. I., Marsh K., Doumbo O. K. 2002. The pathogenic basis of malaria. Nature 415, 673–679 10.1038/415673a (doi:10.1038/415673a) [DOI] [PubMed] [Google Scholar]
- 41.Wang C. W., Hermsen C. C., Sauerwein R. W., Arnot D. E., Theander T. G., Lavstsen T. 2009. The Plasmodium falciparum var gene transcription strategy at the onset of blood stage infection in a human volunteer. Parasitol. Int. 58, 478–480 10.1016/j.parint.2009.07.004 (doi:10.1016/j.parint.2009.07.004) [DOI] [PubMed] [Google Scholar]
- 42.Collins W. E., Jeffery G. M. 1999. A retrospective examination of sporozoite- and trophozoite-induced infections with Plasmodium falciparum: development of parasitologic and clinical immunity during primary infection. Am. J. Trop. Med. Hyg. 61, 4–19 [DOI] [PubMed] [Google Scholar]
- 43.Chookajorn T., Dzikowski R., Frank M., Li F., Jiwani A. Z., Hartl D. L., Deitsch K. W. 2007. Epigenetic memory at malaria virulence genes. Proc. Natl Acad. Sci. USA 104, 899–902 10.1073/pnas.0609084103 (doi:10.1073/pnas.0609084103) [DOI] [PMC free article] [PubMed] [Google Scholar]
- 44.Lavstsen T., Magistrado P., Hermsen C. C., Salanti A., Jensen A. T. R., Sauerwein R., Hviid L., Theander T. G., Staalsoe T. 2005. Expression of Plasmodium falciparum erythrocyte membrane protein 1 in experimentally infected humans. Malar. J. 4, 21. 10.1186/1475-2875-4-21 (doi:10.1186/1475-2875-4-21). [DOI] [PMC free article] [PubMed] [Google Scholar]
- 45.Riley E. M., Wagner G. E., Akanmori B. D., Koram K. A. 2001. Do maternally acquired antibodies protect infants from malaria infection? Parasite Immunol. 23, 51–59 10.1046/j.1365-3024.2001.00364.x (doi:10.1046/j.1365-3024.2001.00364.x) [DOI] [PubMed] [Google Scholar]
- 46.Hviid L., Staalsoe T. 2004. Malaria immunity in infants: a special case of a general phenomenon? Trends Parasitol. 20, 66–72 10.1016/j.pt.2003.11.009 (doi:10.1016/j.pt.2003.11.009) [DOI] [PubMed] [Google Scholar]
- 47.Collins W. E., Jeffery G. M. 1999. A retrospective examination of the patterns of recrudescence in patients infected with Plasmodium falciparum. Am. J. Trop. Med. Hyg. 61, 44–48 [DOI] [PubMed] [Google Scholar]
- 48.Elliott S. R., Payne P. D., Duffy M. F., Byrne T. J., Tham W.-H., Rogerson S. J., Brown G. V., Eisen D. P. 2007. Antibody recognition of heterologous variant surface antigens after a single Plasmodium falciparum infection in previously naive adults. Am. J. Trop. Med. Hyg. 76, 860–864 [PubMed] [Google Scholar]
- 49.Langhorne J., Ndungu F. M., Sponaas A.-M., Marsh K. 2008. Immunity to malaria: more questions than answers. Nat. Immunol. 9, 725–732 10.1038/ni.f.205 (doi:10.1038/ni.f.205) [DOI] [PubMed] [Google Scholar]
- 50.Bawah A. A., Binka F. N. 2007. How many years of life could be saved if malaria were eliminated from a hyperendemic area of northern ghana? Am. J. Trop. Med. Hyg. 77, 145–152 [PubMed] [Google Scholar]
- 51.Taylor H. M., Kyes S. A., Newbold C. I. 2000. Var gene diversity in Plasmodium falciparum is generated by frequent recombination events. Mol. Biochem. Parasitol. 110, 391–397 10.1016/S0166-6851(00)00286-3 (doi:10.1016/S0166-6851(00)00286-3) [DOI] [PubMed] [Google Scholar]
- 52.Barry A. E., Leliwa-Sytek A., Tavul L., Imrie H., Migot-Nabias F., Brown S. M., McVean G. A. V., Day K. P. 2007. Population genomics of the immune evasion (var) genes of Plasmodium falciparum. PLoS Pathog. 3, e34. 10.1371/journal.ppat.0030034 (doi:10.1371/journal.ppat.0030034) [DOI] [PMC free article] [PubMed] [Google Scholar]
- 53.Frank M., Kirkman L., Costantini D., Sanyal S., Lavazec C., Templeton T. J., Deitsch K. W. 2008. Frequent recombination events generate diversity within the multi-copy variant antigen gene families of Plasmodium falciparum. Int J Parasitol 38, 1099–1109 10.1016/j.ijpara.2008.01.010 (doi:10.1016/j.ijpara.2008.01.010) [DOI] [PMC free article] [PubMed] [Google Scholar]
- 54.Bødker R., Akida J., Shayo D., Kisinza W., Msangeni H. A., Pedersen E. M., Lindsay S. W. 2003. Relationship between altitude and intensity of malaria transmission in the Usambara mountains, tanzania. J. Med. Entomol. 40, 706–717 10.1603/0022-2585-40.5.706 (doi:10.1603/0022-2585-40.5.706) [DOI] [PubMed] [Google Scholar]
- 55.Mackinnon M. J., Gandon S., Read A. F. 2008. Virulence evolution in response to vaccination: the case of malaria. Vaccine 26, C42–C52 10.1016/j.vaccine.2008.04.012 (doi:10.1016/j.vaccine.2008.04.012) [DOI] [PMC free article] [PubMed] [Google Scholar]
- 56.Snow R. W., Marsh K. 2002. The consequences of reducing transmission of Plasmodium falciparum in Africa. Adv. Parasitol. 52, 235–264 10.1016/S0065-308X(02)52013-3 (doi:10.1016/S0065-308X(02)52013-3) [DOI] [PubMed] [Google Scholar]
- 57.Okiro E. A., Al-Taiar A., Reyburn H., Idro R., Berkley J. A., Snow R. W. 2009. Age patterns of severe paediatric malaria and their relationship to Plasmodium falciparum transmission intensity. Malar. J. 8, 4. 10.1186/1475-2875-8-4 (doi:10.1186/1475-2875-8-4) [DOI] [PMC free article] [PubMed] [Google Scholar]
- 58.Kosinski R. J. 1980. Antigenic variation in trypanosomes: a computer analysis of variant order. Parasitology 80, 343–357 10.1017/S0031182000000809 (doi:10.1017/S0031182000000809) [DOI] [PubMed] [Google Scholar]
- 59.Aslam N., Turner C. M. 1992. The relationship of variable antigen expression and population growth rates in Trypanosoma brucei. Parasitol. Res. 78, 661–664 10.1007/BF00931517 (doi:10.1007/BF00931517) [DOI] [PubMed] [Google Scholar]
- 60.Agur Z., Abiri D., der Ploeg L. H. V. 1989. Ordered appearance of antigenic variants of African trypanosomes explained in a mathematical model based on a stochastic switch process and immune-selection against putative switch intermediates. Proc. Natl Acad. Sci. USA 86, 9626–9630 10.1073/pnas.86.23.9626 (doi:10.1073/pnas.86.23.9626) [DOI] [PMC free article] [PubMed] [Google Scholar]
- 61.Frank M., Deitsch K. 2006. Activation, silencing and mutually exclusive expression within the var gene family of Plasmodium falciparum. Int. J. Parasitol. 36, 975–985 10.1016/j.ijpara.2006.05.007 (doi:10.1016/j.ijpara.2006.05.007) [DOI] [PubMed] [Google Scholar]
- 62.Lythgoe K. A., Morrison L. J., Read A. F., Barry J. D. 2007. Parasite-intrinsic factors can explain ordered progression of trypanosome antigenic variation. Proc. Natl Acad. Sci. USA 104, 8095–8100 10.1073/pnas.0606206104 (doi:10.1073/pnas.0606206104) [DOI] [PMC free article] [PubMed] [Google Scholar]
- 63.Recker M., Nee S., Bull P. C., Kinyanjui S., Marsh K., Newbold C., Gupta S. 2004. Transient cross-reactive immune responses can orchestrate antigenic variation in malaria. Nature 429, 555–558 10.1038/nature02486 (doi:10.1038/nature02486) [DOI] [PubMed] [Google Scholar]
- 64.Bousema T., et al. 2010. Revisiting the circulation time of Plasmodium falciparum gametocytes: molecular detection methods to estimate the duration of gametocyte carriage and the effect of gametocytocidal drugs. Malar. J. 9, 136. 10.1186/1475-2875-9-136 (doi:10.1186/1475-2875-9-136) [DOI] [PMC free article] [PubMed] [Google Scholar]
- 65.Mideo N., Barclay V. C., Chan B. H. K., Savill N. J., Read A. F., Day T. 2008. Understanding and predicting strain-specific patterns of pathogenesis in the rodent malaria Plasmodium chabaudi. Am. Nat. 172, 214–238 10.1086/591684 (doi:10.1086/591684) [DOI] [PubMed] [Google Scholar]
- 66.Bull P. C., Lowe B. S., Kortok M., Marsh K. 1999. Antibody recognition of Plasmodium falciparum erythrocyte surface antigens in kenya: evidence for rare and prevalent variants. Infect. Immun. 67, 733–739 [DOI] [PMC free article] [PubMed] [Google Scholar]
- 67.Kraemer S. M., Smith J. D. 2006. A family affair: var genes, pfemp1 binding, and malaria disease. Curr. Opin. Microbiol. 9, 374–380 10.1016/j.mib.2006.06.006 (doi:10.1016/j.mib.2006.06.006) [DOI] [PubMed] [Google Scholar]
- 68.Kraemer S. M., et al. 2007. Patterns of gene recombination shape var gene repertoires in Plasmodium falciparum: comparisons of geographically diverse isolates. BMC Genomics 8, 45. 10.1186/1471-2164-8-45 (doi:10.1186/1471-2164-8-45) [DOI] [PMC free article] [PubMed] [Google Scholar]
- 69.Bull P. C., Buckee C. O., Kyes S., Kortok M. M., Thathy V., Guyah B., Stoute J. A., Newbold C. I., Marsh K. 2008. Plasmodium falciparum antigenic variation. mapping mosaic var gene sequences onto a network of shared, highly polymorphic sequence blocks. Mol. Microbiol. 68, 1519–1534 10.1111/j.1365-2958.2008.06248.x (doi:10.1111/j.1365-2958.2008.06248.x) [DOI] [PMC free article] [PubMed] [Google Scholar]
- 70.Buckee C. O., Bull P. C., Gupta S. 2009. Inferring malaria parasite population structure from serological networks. Proc. R. Soc. B 276, 477–485 10.1098/rspb.2008.1122 (doi:10.1098/rspb.2008.1122) [DOI] [PMC free article] [PubMed] [Google Scholar]
- 71.Jensen A. T. R., et al. 2004. Plasmodium falciparum associated with severe childhood malaria preferentially expresses pfemp1 encoded by group a var genes. J. Exp. Med. 199, 1179–1190 10.1084/jem.20040274 (doi:10.1084/jem.20040274) [DOI] [PMC free article] [PubMed] [Google Scholar]