Abstract
Choline kinase catalyzes the phosphorylation of choline, the first step of phospholipid synthesis. Increased phosphorylation of choline is a hallmark characteristic of the malignant phenotype in a variety of neoplasms. However, in hypoxic cancer cells, choline phosphorylation is decreased. To understand the mechanism behind this altered metabolic state, we examined the expression and regulation of the major choline kinase isoform, choline kinase α (ChKα), in hypoxic PC-3 human prostate cancer cells. Hypoxia decreased choline phosphorylation, choline kinase activity, and ChKα mRNA and protein levels. Promoter analysis studies revealed a region upstream of the ChKα gene bearing a conserved DNA consensus binding motif, hypoxia response element-7 (HRE7), at position −222 relative to +1 translation start site, for binding the hypoxia dependent master regulator transcription factor, hypoxia-inducible factor 1α (HIF-1α). Electrophoretic mobility shift competition/supershift assay and chromatin immunoprecipitation assay confirmed binding of HIF-1α to HRE7. A putative promoter of ChKα was isolated from PC-3 genomic DNA and cloned into a luciferase-based reporter vector system. In PC-3 cells, hypoxia decreased the expression of luciferase under the control of the ChKα promoter. Mutation of HRE7 abrogated this hypoxia effect, further demonstrating the involvement of HRE7 in hypoxia-sensitive regulation of ChKα. The results strongly suggest that transcriptional control of choline phosphorylation is largely mediated via HIF-1α binding to the newly identified HRE7.
Keywords: phospholipids/phosphatidylcholine, gene expression, lipid kinases, phospholipids/metabolism, cancer
In recent years, choline phospholipid metabolism has been widely studied in cancer research. Choline is an important precursor of phospholipids. Its phosphorylation by choline kinase to form phosphocholine is the first step of multistep Kennedy pathway (1) that synthesizes the major membrane phospholipid, phosphatidylcholine. Increased choline phosphorylation (primarily by choline kinase α, ChKα) in tumor as compared with normal tissue has been reported in lung, breast, colorectal, and prostate cancers (2–5). This has motivated evaluation of cancer therapies involving choline kinase inhibition (6) and use of cancer imaging techniques with choline phosphorylation as a diagnostic metabolic step (7, 8).
Metabolism of choline in cancer cells is known to be sensitive to its microenvironment. Tracer studies in the mouse atrial cardiomyocyte tumor lineage, AT-1 (9), and 9L glioma allografts (10) showed that radiolabeled choline phosphorylation and accumulation is significantly diminished in hypoxia. Our previous tracer studies with two human prostate cancer cell lines, PC-3 and LNCaP, showed 15% and 28% decreases in choline accumulation, respectively, after 4 h of anoxia (0% O2) (11). After 24 h of anoxia, choline accumulation continued to decrease in both cell lines without loss of cellular viability. Because low oxygen exposure is a common factor in the microenvironment of tumors, it is important to understand the mechanisms of this effect and the implications for therapeutic and diagnostic applications involving choline metabolism.
The goals of the present study were to utilize PC-3 prostate cancer cells to assess the effects of hypoxia on 1) steady-state levels of choline metabolites, 2) equilibrium status of choline phosphorylation, 3) radiolabeled choline uptake and phosphorylation, 4) ChKα mRNA and protein levels, and 5) choline kinase activity. In this work, we demonstrate that choline phosphorylation is not at equilibrium in hypoxia. It is further shown that modulation of ChKα expression and choline kinase activity is a HIF-1α dependent response. Characterization of the ChKα promoter for regulation of ChKα expression in hypoxia revealed a novel hypoxia response element, HRE7, which is strongly implicated in this study to mediate the effects of hypoxia on ChKα expression.
MATERIAL AND METHODS
Cell culture, hypoxic conditions, and cell viability assay
The human prostate cancer cell line, PC-3 (ATCC, Manassas, VA) was cultured in complete RPMI-1640 medium under normoxic (21% O2) or hypoxic (1% O2) conditions for 24 h as described in the supplemental information available online. It has been well reported that in a cell exposure system, the medium equilibrates with chamber atmosphere within 0.5–3 h (12). Cells cultured in medium were maintained under normoxic and hypoxic conditions for 24 h in closed chamber, which allowed adequate exposure and full equilibration of medium with the chamber environment. Cell viability assays were performed using trypan blue staining (10). In some assays, hypoxic conditions were mimicked by exposing cells to 24 h of 2 mM dimethyloxalylglycine (DMOG). DMOG stabilizes the hypoxia dependent master regulator, HIF-1α, thereby acting as a hypoxia mimetic.
Cell counting and calculation of population doubling time
Cells were trypsinized and suspended in medium. Cells were counted and population doubling time was calculated as previously described (10).
Choline accumulation and metabolism study
Normoxic and hypoxic PC-3 cells were cultured in a 6-well format and incubated for different durations with ∼74KBq [3H]choline (GE Healthcare, Piscataway, NJ) per well for cellular uptake measurement and with ∼444KBq [3H]choline per well for metabolite analysis. After incubation with the radiotracers, cellular accumulation measurements and radiolabeled choline metabolite estimations were performed as previously described (10).
Pulse-chase experiment
To investigate the efflux rates of radioactivity from PC-3 cells after initial uptake, pulse chase experiments with [3H]choline were performed as previously described (10). Efflux measurements were made every 15 min for 2 h.
Choline kinase activity assay
Choline kinase activity assays from normoxic and hypoxic cell extracts were performed as previously described (10).
ATP, choline, phosphocholine, and MAR measurement
ATP concentrations in cultured cells were determined as previously described (10). Choline was measured in the perchloric extracts of cells by spectrophotometric assay (13). Phosphocholine was estimated in cell extracts by dephosphorylation of phosphocholine by phosphatase and measurement of the subsequent increase in choline (14). Mass action ratio (MAR) for choline phosphorylation reaction was calculated by using the formula MAR = [phosphocholine] × [ADP] / [choline] × [ATP] with measured choline, phosphocholine, and ATP. Intracellular concentration of [ADP] is assumed to be 1.1 mM (15). For a reaction to be at equilibrium, MAR should be equal to Keq. Equilibrium status was established by comparing calculated MAR with the known equilibrium constant, Keq(1.24 × 10⁴) for choline phosphorylation (16).
Western blotting
Protein was extracted from PC-3 cells using RIPA lysis buffer (SIGMA, St. Louis, MO) with Complete protease inhibitor cocktail (Roche Diagnostics GmbH, Germany). Western blotting was performed as described in the supplemental information available online. Monoclonal anti-HIF-1α (BD Biosciences, San Jose, CA) and polyclonal anti-ChKα (SCBT, Santa Cruz, CA) were used for evaluating HIF-1α and ChKα protein levels and anti-β-actin (SCBT) was used as a loading control.
RT-PCR
Total cellular RNA was isolated from cells using RNeasy Plus mini Kit (Qiagen, Valencia, CA). RT-PCR and data analysis was performed with validated ChKα and vascular endothelial growth factor (VEGF) specific TaqMan gene expression assays (Applied Biosystems, Foster City, CA). RT-PCR analysis was performed using five independent RT-PCR estimations.
HIF-1α silencing
Short-hairpin RNA (shRNA)-based lentiviral approach was used to silence HIF-1α in PC-3 cells. Lentiviral expression vectors, pLKO.1 (control and HIF-1α targeting-shRNA constructs) were kindly provided by Dr. Andrew L. Kung (Dana Farber Cancer Institute) and packaging plasmids (pCMV-dR8.91 and VSV-G/pMD2G) were kindly provided by Dr. William C. Hahn (Dana Farber Cancer Institute). Recombinant lentiviruses were produced by cotransfecting HEK 293T cells with the lentivirus expression vector and packaging plasmids using Lipofectamine 2000 (Invitrogen, Carlsbad, CA) as a transfection reagent. Infectious lentiviruses were collected at 24 and 48 h after transfection and the pooled supernatants centrifuged to remove cell debris and filtered through a 0.45 μm filtration unit. PC-3 cells were infected with these lentiviruses and stable transfectants were selected in puromycin for 14 days.
ChKα silencing
ON-TARGET plus SMARTpools small interfering RNA (siRNA) target sequences reagents (Thermo Fisher Scientific, Dharmacon Products, Lafayette, CO) were used to silence ChKα in PC-3 cells according to the manufacturer's protocol. ON-TARGET plus NonTargeting Pool (Thermo Fisher Scientific) was used as a control.
EMSA
Nuclear proteins were prepared using the NE-PER nuclear and cytoplasmic extraction kit (Piercenet, Rockford, IL). Complementary PAGE purified biotinylated or unbiotinylated oligonucleotides (Eurofins MWG Operon, Huntsville, AL) were annealed to make double-stranded probes. The labeled probes were incubated with hypoxic PC-3 cell nuclear extracts according to the manufacturer's protocol in LightShift Chemiluminescent electrophoretic mobility shift assay (EMSA) Kit (Piercenet). The DNA-protein complexes were resolved in 5% nondenaturing TBE polyacrylamide gel (Biorad, Hercules, CA), followed by wet transfer to Biodyne B Nylon membrane (Piercenet). Complex was detected using Chemiluminescent Nucleic acid Detection Module (Piercenet). For competition assays, 4 pmol (200 times excess) unlabeled probes and 0.5μg monoclonal anti-HIF-1α (BD Biosciences) were used. For supershift assay, 0.5μg polyclonal anti-HIF-1α (Novus Biologicals, Littleton, CO) was used. Incubation without nuclear extract was used as a negative control. Details of probes are described in supplementary Table I.
ChIP assay
A standard chromatin immunoprecipitation (ChIP) assay protocol was followed (17, 18). Chromatin was sonicated to 500- to 1,000-bp fragments and immunoprecipitation was carried out with polyclonal anti-HIF-1α (Novus Biologicals). Chromatin (sonicated or immunoprecipitated) was purified by a standard phenol-chloroform procedure followed by column purification using the minElute PCR purification kit (Qiagen). DNA was quantified by Quant-IT Picogreen quantification kit (Invitrogen). Equal amount of unprocessed (Input) and immunoprecipitated (ChIP) chromatin was used for PCR. Traditional PCR was performed to standardize conditions for quantitative PCR. Q-solution (Qiagen) additive was included in amplification of the promoter region spanning the HRE7 site due to high GC content of the amplicon. Fold enrichment of a promoter region was assessed by performing quantitative PCR using QuantiTect SYBR Green PCR Kit (Qiagen) with chromatin samples taken before (input) and after immunoprecipitation (ChIP). Details of the primers and calculations for fold enrichment are described in supplementary Table II.
Promoter isolation, mutation, cloning, and luciferase assay
The genomic DNA was extracted from PC-3 cells using DNeasy Blood and Tissue Kit (Qiagen) and quantified. The putative promoter region upstream of ChKα was amplified from genomic DNA using Phusion High-Fidelity PCR Master Mix with GC Buffer (NEB, Ipswich, MA). The identity of the promoter was confirmed using nested PCR amplifications and sequencing. Details of primers used are described in supplementary Table III. The amplified full length promoter had restriction sites, Acc651 and HindIII at the 5′ and 3′ end, respectively, for directed cloning into the pGL4.10 [luc2] vector (Promega, Madison, WI). The sequence alignment of the putative promoter of ChKα from rat, mouse, human, and chimpanzee was analyzed using the on-line EBI Clustal W program. Mutation at the conserved HRE site (5′-TCGTGC-3′) to (5′-AGCATT-3′) was performed using a QuikChange Site-Directed Mutagenesis Kit (Stratagene, La Jolla, CA). Promoter assays were performed with pGL4.74[hRluc/TK] as transfection control using a Dual-Glo® Luciferase Assay System (Promega).
Statistical analysis
Results are presented as means ± SD. Student's t-test was applied for statistical evaluation and a p-value < 0.05 was considered significant.
RESULTS
Effect of hypoxia on cell population doubling time and viability
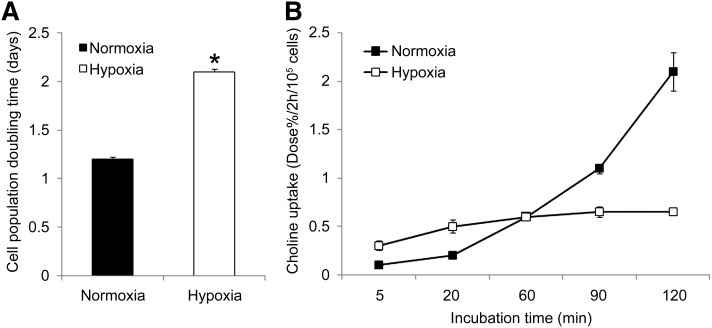
The cell population of hypoxic PC-3 cells doubled at a 75% slower rate than their normoxic counterparts (Fig. 1A), whereas cellular viability was preserved at nearly 100% over 24 h.
Fig. 1.
Effect of 24 h hypoxia (1% O2) on (A) cell population doubling time and (B) [3H]choline uptake time course in PC-3 cells (n = 3, each condition). The cell population of hypoxic PC-3 cells doubled at a 75% slower rate than their normoxic counterparts (* P < 0.05) and hypoxia blunted the phosphorylation dependent accumulation of [3H]choline at later time points.
Effect of hypoxia on choline accumulation and metabolism
In normoxic PC-3 cells incubated with radiolabeled choline, the choline tracers were taken up avidly and rapidly phosphorylated. The accumulation of choline increased in a linear fashion with increasing incubation time in normoxic PC-3 cells (Fig. 1B). The accumulated radioactivity was nearly completely (>95%) in the form of phosphocholine at incubation periods as short as 5 min. The nature of accumulated choline was very different in hypoxic PC-3 cells. Following exposure to chronic hypoxia, at early incubation times (<60 min), there was a linear increase in choline accumulation, but at later time points (>60 min), choline accumulation saturated with no change in tracer accumulation (Fig. 1B). In hypoxic PC-3 cells, potent inhibition of choline phosphorylation was seen with <10% of the radioactivity contributed by phosphorylated choline at all incubation time points. Choline accumulation rate in normoxic cells was slightly slower in early incubation times (<20 min) as compared with hypoxic cells but significantly higher at later incubation times (>60 min).
To further investigate the fate of radiolabeled choline metabolites, a pulse-chase experiment was performed. After administering a pulse of radiolabeled choline tracers for 2 h in normoxic conditions, moderate levels of radioactivity were washed out of the cells in successive 15 min incubations. The washout rate was 0.05 ± 0.02%/min (Fig. 2). In contrast, in hypoxic PC-3 cells, the washout rate was 0.6 ± 0.05%/min, a factor of 12 times higher than for normoxic cells. Nearly all the radioactivity was washed out of the hypoxic cells in successive incubations with fresh buffer (Fig. 2).
Fig. 2.
Representative plot of efflux of 3H-radioactivity from normoxic and hypoxic PC-3 cells upon successive washing with growth medium after incubating the cells for 2 h with [3H]choline under normoxia (21% O2) and hypoxia(1% O2). Hypoxia dramatically enhanced washout of 3H-radioactivity from the cells, demonstrating a profound decrease of metabolic sequestration of [3H]choline.
In normoxic conditions, PC-3 cells contained 0.031 ± 0.012 μmol choline/200 mg protein and 2.1 ± 0.2 μmol phosphocholine/200 mg protein (Table 1). Marked changes in steady-state concentrations of these metabolites were seen in hypoxia. Hypoxia caused a 666% increase in concentration of choline and 14% decrease of phosphocholine (Table 1). Consistent with the decreased choline phosphorylation, a 30% decrease in choline kinase activity was observed in hypoxic cells (1.7 ± 0.1 nmol/min/mg protein) as compared with normoxic cells (2.43 ± 0.02 nmol/min/mg protein). Hypoxia also decreased the energy state of PC-3 cells as evidenced by ∼19% reduction in concentration of ATP (Table 1). The phosphocholine/choline ratio was decreased by 10-fold in hypoxic cells (phosphocholine/choline = 7.8) as compared with normoxic cells (phosphocholine/choline = 70) (Table 1).
TABLE 1.
Metabolite levels and mass action ratio (MAR) of choline phosphorylation in PC-3 cells after 24 h normoxia (21% O2) and hypoxia (1%O2)
| Choline | Phosphocholine | ATP | MAR | |
| Normoxia | 0.031 ± 0.012 | 2.1 ± 0.2 | 3.2 ± 0.2 | 23.3 ± 9.4 |
| Hypoxia | 0.23 ± 0.06a | 1.8 ± 0.1a | 2.6 ± 0.1a | 3.3 ± 0.9 |
Concentration is expressed as μmol/200 mg protein. n = 3, each condition.
P < 0.05 versus values for normoxia, unpaired student t-test, n = 3.
Equilibrium status of choline phosphorylation step
Choline phosphorylation was not at equilibrium in normoxic and hypoxic cancer cells based on comparison of the estimated MAR and Keq constant. MAR for choline phosphorylation was 23.3 ± 9.4 for normoxic cells and 3.3 ± 0.9 for hypoxic cells (Table 1), which was far from the value of Keq constant 1.24 × 10⁴ (15). Estimation of MAR was made after assuming ADP concentration to be 1.1 mM (15). This is a reasonable assumption based on the physiological range of ADP (15) that should not severely affect the MAR estimations. The measured choline, phosphocholine, ATP, and MAR estimates further supports assumption of ADP concentration and nonequilibrium status of choline phosphorylation in PC-3 cells because it would require nonphysiological ADP concentrations of ∼0.6 M or 4 M to achieve equilibrium status (MAR = Keq) in normoxic or hypoxic PC-3 cells, respectively.
ChKα gene expression in hypoxia
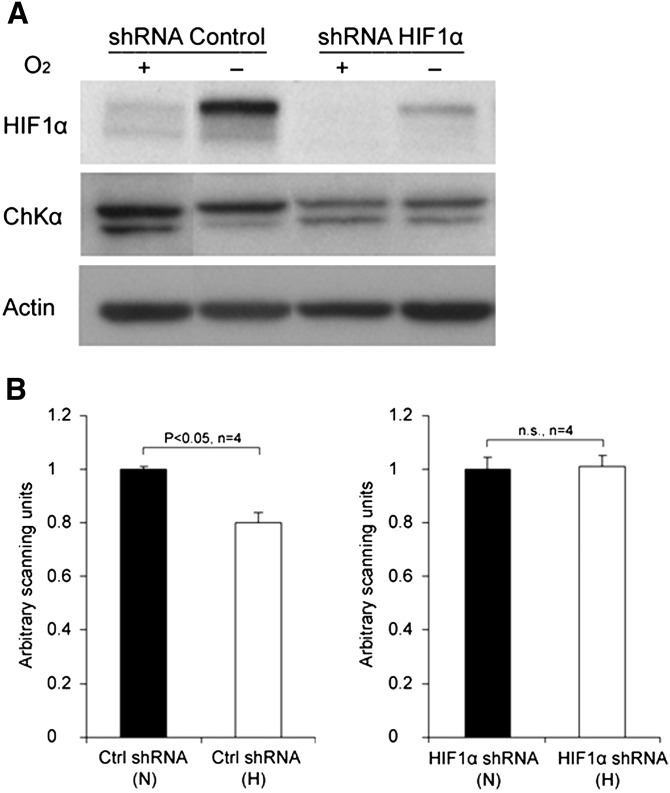
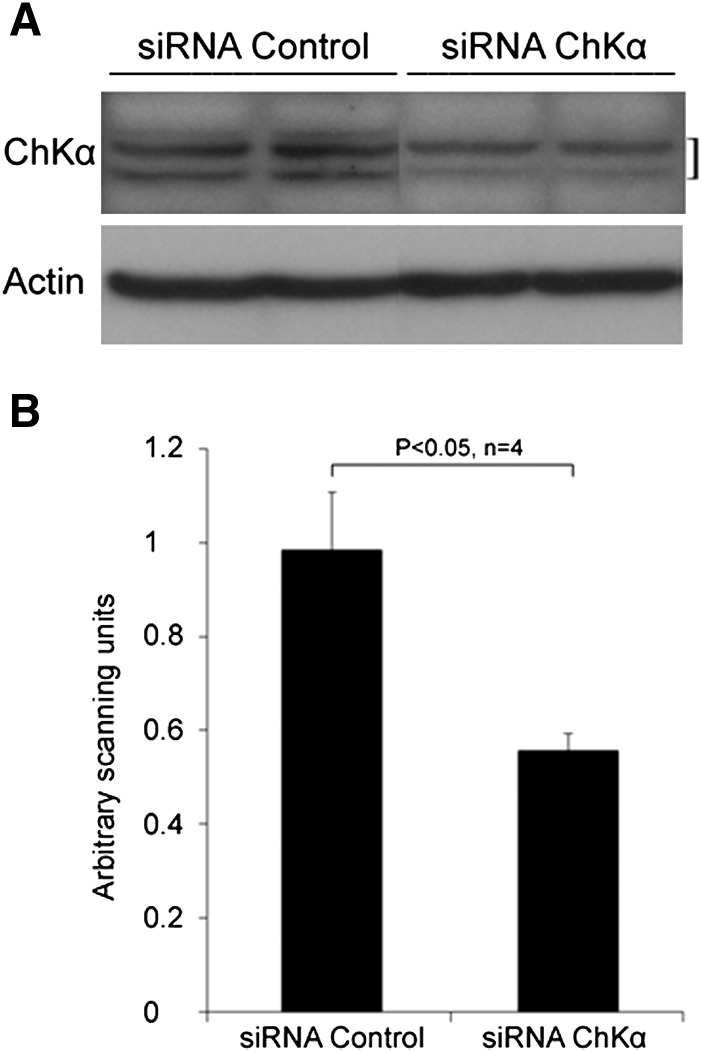
Hypoxic incubations resulted in significant elevation of levels of hypoxia inducible factor (HIF-1α) protein in PC-3 cells (Fig. 3). Existence of a HIF-1α dependent response in hypoxic PC-3 cells was confirmed by increased mRNA levels of the hypoxia marker VEGF gene under chronic hypoxia using RT-PCR analysis. VEGF levels in hypoxic cells were 2.44 ± 0.4-fold increased relative to normoxic cells for PC-3 cells, respectively. Hypoxic exposure to PC-3 cells resulted in ∼30% decreases in choline kinase activity. Likewise, RT-PCR and Western blot assay (Fig. 3) showed ∼26% decrease in ChKα mRNA (hypoxia: normoxia = 0.74 ± 0.12) and ∼20% protein levels in hypoxic PC-3 cells. For the Western blot assay, highly specific commercially available polyclonal antibody against ChKα protein was used and identity of the ChKα protein band (doublet) in the blot was validated using siRNA based ChKα silencing (Fig. 4).
Fig. 3.
Effect of hypoxia and HIF-1α silencing on HIF-1α and ChKα protein levels in PC-3 prostate cancer cell line. A: Western blot showing expression of HIF-1α and ChKα in PC-3 cells and (B) quantitative densitometry analysis of ChKα doublet in the Western blot. The expression of ChKα was decreased in hypoxic control PC-3 cells (shRNA Control) as compared with normoxic control PC-3 cells whereas in PC-3 cells with suppressed HIF-1α expression (shRNA HIF-1α), hypoxia did not decrease ChKα expression (Fig. 4) suggesting a possible involvement of HIF-1α in regulation of ChKα expression.
Fig. 4.
Western blot analysis showing ChKα protein levels in PC-3 prostate cancer cell lysates identified using highly specific commercially available polyclonal antibody against human ChKα. Inhibition of choline kinase expression by siRNA approach significantly reduced the intensity of ChKα protein bands as seen in (A) Western blot and (B) quantitative densitometry analysis.
As shown earlier, hypoxia decreased choline kinase expression in PC-3 cells but it was not clear if this reduction was mediated by HIF-1α. In order to investigate a potential mediatory role of HIF-1α, stable PC-3 cell lines were generated with suppressed HIF-1α expression. The HIF-1α expression status of these cell lines was confirmed by Western blot assay (Fig. 3). ChKα expression was decreased in hypoxic control PC-3 cells as compared with normoxic control PC-3 cells whereas in PC-3 cells with suppressed HIF-1α expression, hypoxia did not decrease ChKα expression (Fig. 3), suggesting a possible HIF-1α involvement.
HIF-1α binding sites and promoter alignment
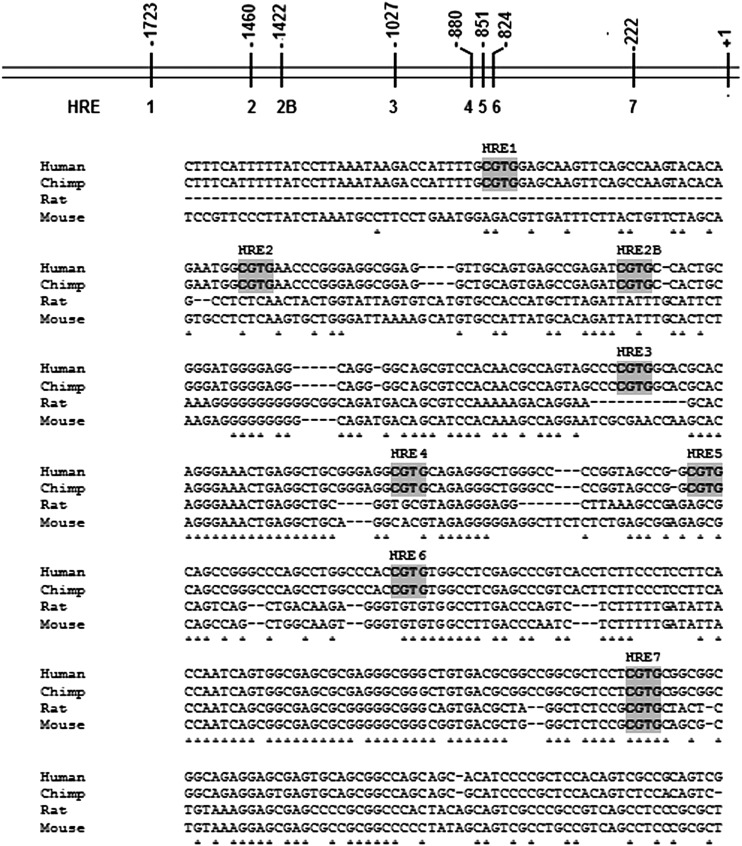
HIF-1α regulates gene expression by binding to hypoxia response core elements (HREs, 5′- CGTG - 3′) in the proximal promoter region of the hypoxia responsive genes. In the promoter region upstream of human choline kinase α (hChKα), six previously identified HRE sites relative to +1 translation start site (19) were confirmed as HRE1 (−1723); HRE2 (−1460); HRE3 (−1027); HRE4 (−880); HRE5 (−851); and HRE6 (−825) (Fig. 5). In addition to these, two putative HRE sites were newly identified as HRE2B (−1422) and HRE7 (−222). DNA sequence alignment of promoter region upstream of the hChKα (19), chimp [from National Center for Biotechnology Information (NCBI)], rat (20), and mouse (from NCBI) showed that out of these eight putative HRE sites in the proximal promoter region, only HRE7 positioned at −222 nucleotide was conserved across all species (Fig. 5).
Fig. 5.
Nucleotide alignments of segments of promoter region upstream of ChKα gene from human, chimp, rat, and mouse showing eight putative HRE sites in the promoter region from human ChKα. The schematic diagram and HRE nomenclature was adapted from Glunde et al. (19).
EMSA
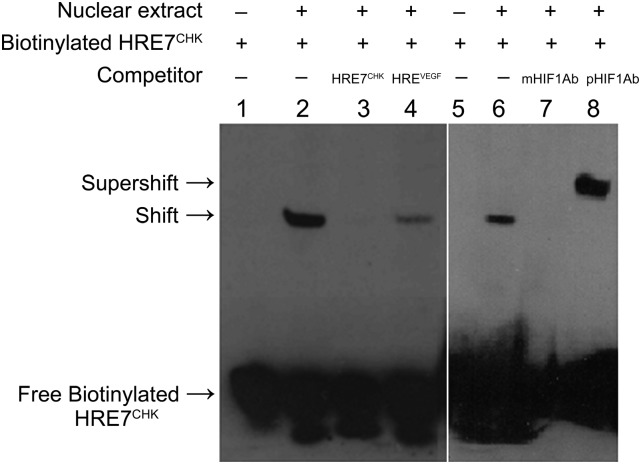
An EMSA was performed to assess the binding ability of HIF-1α to HRE7 in in vitro conditions (Fig. 6). Lanes 1 and 5 showed only a single band of unbound or free biotinylated probe (containing HRE7 site). With the addition of the nuclear protein extract of hypoxic PC-3 cells in the binding reaction, an extra band of decreased mobility was observed (Fig. 6; Lanes 2 and 6). This extra band represented the binary HIF-1-biotinylated probe complex. The binary complex was not visible when the binding assay was performed with unlabeled probe (with HRE7 site) added 200 times in excess of the biotinylated probe (Fig. 6; Lane 3), demonstrating saturability of binding. A significant decrease in intensity of the extra band was also seen when an unlabeled probe with a known functional HRE site upstream of the VEGF gene was added in 200 times in excess of the biotinylated probe (Fig. 6; Lane 4). Incubation with a specific monoclonal antibody against HIF-1α prevented binding of HIF-1α to the biotinylated probe (Fig. 6; Lane 7). Incubation with a specific polyclonal antibody against HIF-1α did not disrupt the HIF-1-biotinylated probe complex but formed a tertiary complex of anti-HIF-1α, HIF-1α, and biotinylated probe. This tertiary complex was seen as an extra band on the acrylamide gel that was above the band represented by the HIF-1α-biotinylated oligo binary complex (Fig. 6; Lane 8). Thus, a supershift of biotinylated probe was caused due to a significant decrease in mobility of the tertiary complex.
Fig. 6.
In vitro binding of HIF-1α to HRE7 within the human ChKα promoter as shown by electrophoretic mobility shift competition and supershift assay using nuclear extract from hypoxic PC-3 cells. HRE7CHK – 200-fold excess of unlabeled probe with HRE7 site; HREVEGF – 200-fold excess of unlabeled probe with functional HRE upstream of VEGF; mHIF-1Ab – monoclonal anti - HIF-1α and pHIF-1Ab- polyclonal anti-HIF-1α. The experiment was performed in triplicate.
ChIP assay
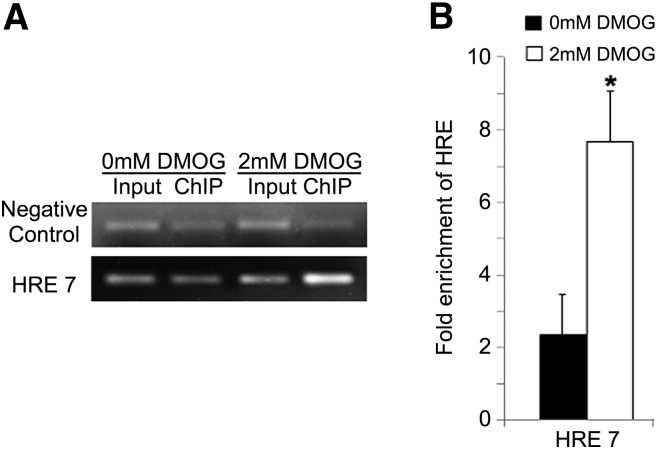
A ChIP assay was performed to determine whether HIF-1α binds to the putative HRE7 site in vivo in normoxic and hypoxic PC-3 cells. For this assay, hypoxia was mimicked by incubation with 2 mM DMOG. Using traditional PCR, we observed significant enrichment of promoter regions with HRE7 in the DMOG-treated cells (Fig. 7A). The enrichment in hypoxia and normoxia was quantified from threshold Ct values obtained by quantitative PCR (Fig. 7B). Based on the quantitative PCR results, following ChIP, HRE7 showed 7.7-fold enrichment in hypoxia as compared with 2.3- fold enrichment in normoxia, suggesting increased binding of HIF-1α to HRE7 in hypoxic conditions.
Fig. 7.
In vivo binding of HIF-1α to HRE7 within the hChKα promoter region in PC-3 cells as shown by ChIP assay. Following 24 h exposure to normoxia (0 mM DMOG) or hypoxia (2 mM DMOG), chromatin was cross-linked, sonicated, and immunoprecipitated with polyclonal anti-HIF-1α. PCR was performed with reverse-cross-linked chromatin samples taken before (input) and after immunoprecipitation (ChIP). Enrichment of chromatin fragment including the specific HRE in immunoprecipitated chromatin was compared with unprocessed chromatin (input) by (A) semi-quantitative traditional PCR (representative gel) and (B) fold enrichment calculated by quantitative PCR (n = 5, each condition). Fold enrichment calculated by quantitative PCR was normalized with fold enrichment in negative control. Negative control used was a region upstream of VEGF gene that contained no HRE site. DMOG caused a significant fold increase in enrichment of HRE7 demonstrating HIF-1α binding to HRE7.
Promoter isolation, cloning, mutation, and luciferase assay
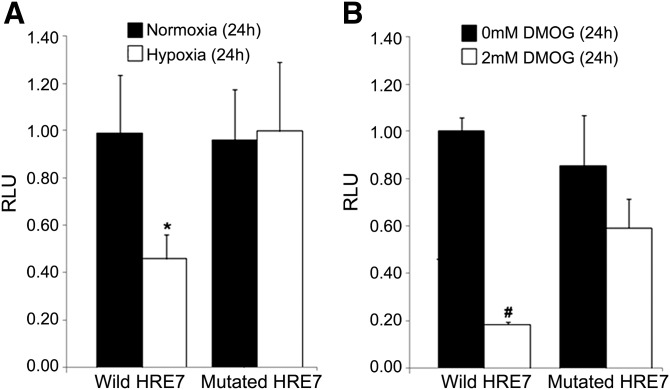
Further evidence for a primary role of the newly identified HRE7 site was obtained by investigating the effects of specific mutation at this site. The proximal promoter (∼2.2 Kb) upstream of hChKα was successfully isolated from PC-3 genomic DNA and cloned into a luciferase vector construct. This was confirmed with nucleotide sequencing and amplification with nested primers. Mutation at the conserved HRE7 site (5′-TCGTGC-3′ to 5′-AGCATT-3′) was successful and confirmed by nucleotide sequencing. In normoxic conditions (21% O2 or 0 mM DMOG), there was no difference in promoter-mediated luciferase signal from PC-3 cell lines expressing promoter with wild-type HRE7 and mutated HRE7 (Fig. 8). In contrast, in hypoxic conditions (1% O2 or 2 mM DMOG), a significant decrease in luciferase signal was observed in PC-3 cells expressing wild-type HRE7 as compared with PC-3 cells expressing mutated HRE7 (Fig. 8). Thus, the HRE7 site represents a predominant role in response to hypoxia. Taken together with the previous results on the critical interaction of HIF-1α at the HRE7 site, it is strongly implied that the wild-type HRE7 but not the mutated HRE7 site is responsive to increased levels of HIF-1α in hypoxic and DMOG-treated cells.
Fig. 8.
Promoter-reporter construct assay showing ChKα gene promoter dependent luciferase signal from PC-3 cells expressing wild-type promoter and mutated promoter in (A) normoxia (21% O2) and hypoxia (1% O2), and in (B) presence of 0 mM DMOG and 2 mM DMOG. Hypoxia (* P < 0.05 vs. normoxia) and DMOG (# P < 0.01 vs. 0 mM DMOG) reduced luciferase signal with wild-type ChKα promoter but had no significant effect with the mutated HRE7. RLU, relative luminescence unit = luminescence as compared with luminescence of promoter construct with wild-type HRE7 in normoxia (Fig. 8A) or in presence of 0 mM DMOG (Fig. 8B). Means and SDs were calculated using three independent assays.
DISCUSSION
The goal of the present study was to utilize prostate cancer cells to understand the mechanisms behind low oxygen mediated reduction in rate of choline phosphorylation in cancer cells (9–11). It should be noted that in our previous study (11), we focused on the effect of anoxia (0% O2) on uptake of glucose, acetate, and choline in cancer cells. The longest exposure to anoxia studied was 4 h. To understand the effect of low oxygen environment on regulation of choline kinase expression (mRNA and protein), a chronic exposure is required. We found that PC-3 cells cannot be exposed to 0% O2 for more than 24 h due to significant decrease in viable cell population in chronic anoxia. Chronic hypoxic exposure (1% O2) avoids this problem. A significant reduction in choline uptake was also observed in hypoxic (1% O2) cells with no loss in cell viability in PC-3 cells in the present study. Therefore, hypoxia (1% O2) was used in order to study the effect of chronic low oxygen environment on regulation of choline kinase expression (mRNA and protein) and choline metabolism. In addition, the results of our study can be compared with other studies as hypoxia (∼1% O2) is commonly utilized (21–23). The oxygen concentration in solid tumors varies considerably (0.1–2% O2). Low concentration of oxygen has been reported in HGL-21 tumor (1% O2) (21), SCC-21 tumor (1% O2) (21), FaDu tumor (1% O2) (21), fibrosarcoma (0.3–1% O2) (22), 9L tumor (0.1–0.9% O2) (22), L8174T tumor (2% O2) (21), HP-555 tumor (0.7% O2) (21), and rat mammary tumor, R3230Ac (0.5% O2) (23). Accordingly, we chose 1% O2 as the oxygen concentration for the hypoxic condition in the present study.
The upregulation of choline phosphorylation in normoxic tumors is well recognized but the reasons for decreased choline phosphorylation in hypoxic (∼1% O2) tumors are poorly understood. Hypoxia-mediated inhibition of choline phosphorylation has been reported in cancer cell lines derived from mouse (9), rat (10), and humans (11). In these previous studies, hypoxic treatment of the cells was followed by sample processing in normoxic laboratory conditions. This brief exposure to normoxia could mask the overall changes in cells due to hypoxia. Therefore, to rule out any artifact from reoxygenation, we used a hypoxia chamber in our study that maintained uninterrupted hypoxia for the entire experiment including sample processing. The present results on choline tracer phosphorylation and steady-state choline metabolites in PC-3 cells confirm that hypoxia significantly reduces choline phosphorylation.
The MAR estimates from our study suggest that the choline phosphorylation step catalyzed by choline kinase was far from equilibrium in normoxic and hypoxic cancer cells. This implies that the rate of choline phosphorylation should be sensitive to changes in choline kinase expression and choline kinase activity. Our finding of intracellular ATP levels (∼3 mM) that are close to the Km of choline kinase for ATP (∼1.5 mM) (24) suggests that decreases in ATP levels in hypoxic cancer cells could also contribute to reduction in choline phosphorylation, an effect that could compound with changes in choline kinase expression and activity. In cells under moderate hypoxic stress, there are mechanisms that maintain ATP levels in a range that keeps the cell viable (25–27). This is usually done by coordinating various energy-supplying and energy-consuming processes. In our study, the level of hypoxic stress resulted in moderate decrease in cellular ATP levels, whereas significant increases in levels of hypoxia markers HIF-1 α and VEGF were observed.
In the present study, we showed that hypoxia decreases expression of ChKα in human prostate cancer cells. The decreased ChKα mRNA and protein levels correlated with decreased in vitro choline kinase activity observed in hypoxic cell extracts. These results suggest a hypoxia-induced transcriptional control of the ChKα gene. It was also shown that HIF-1α silencing in hypoxic prostate cancer cell line PC-3 is sufficient to abolish the negative effect of hypoxia on the expression of ChKα. Our observations corroborate a HIF-1α silencing microarray study performed in a breast cancer cell line, MCF-7, that showed possible involvement of HIF-1α in downregulation of many genes including choline kinase (28). Thus, there is compelling evidence of HIF-1α mediated negative control of choline kinase transcription in hypoxic cancer cells.
Transcriptional control of hypoxia responsive genes by HIF-1α is mediated by binding of HIF-1α to HRE sites in the regulatory promoter region of a target gene (29). In our analysis of the promoter region of the hChKα, we confirmed the six HRE sites previously reported with the sequence 5′-G/CCGTG-3′ (19). In addition, we identified two novel putative HRE sites (HRE2B and HRE7) with a nucleotide sequence 5′-TCGTG-3′. This nucleotide sequence has been previously reported to bind HIF-1α in the promoter region of a different hypoxia responsive gene PGK-1 (30). To find conserved putative HRE sites that could potentially mediate the hypoxic response across species, we aligned the nucleotide sequence for the promoter of ChKα gene from rat, mouse, chimp, and human. All putative HRE core sites are not conserved across species as we found only one well conserved HRE site, HRE7 at the −222 nucleotide position. An interaction of HRE7 with HIF-1α was confirmed by in vitro and in vivo assays. In vitro binding of HIF-1α to HRE7 was confirmed by EMSA. Following hypoxia or DMOG exposure, significant enrichment of chromatin fragments with HRE7 in the in vivo ChIP assay confirmed in vivo binding of HIF-1α to HRE7 in hypoxia.
The present study provides a novel contribution to the understanding of the regulation of ChKα by its promoter in hypoxia. A recent promoter deletion study by Glunde et al. (19) suggested the existence of two nonoverlapping regions in the ChKα promoter that upregulate or downregulate ChKα expression in hypoxia. It was shown that ChKα promoter-mediated upregulation occurs in hypoxia only when the highly repressive downstream +1 to −338 nucleotides were deleted from the promoter. Based on our present work, we have for the first time shown that this dominant highly repressive downstream ∼338bp ChKα promoter region contains the conserved HIF-1α binding HRE7 site at the −222 nucleotide position. The role of HRE7 in transcriptional downregulation of ChKα was confirmed when the mutation of HRE7 abrogated the transcriptional repressive control of full length ChKα promoter under hypoxia or DMOG exposure in the promoter-luciferase construct assays.
This work provides a mechanistic understanding to the observation that hypoxic regions within tumors exhibit low accumulation of radiotracer choline, for example, as seen in choline radiotracer studies of tumors and cultured cancer cells (9–11). Choline accumulation is decreased primarily due to decrease in choline phosphorylation. Reduction in choline kinase expression, activity, and reduced ATP levels in hypoxic cells contributes to the decrease in choline phosphorylation. Decreases in choline kinase expression in hypoxia are likely mediated by HIF-1α. Therefore, it is suggested that the potential impact of tumor oxygenation on choline phosphorylation in the phospholipid synthesis pathway should be considered when choline-based cancer therapy and imaging applications are pursued.
CONCLUSIONS
The present study confirms that hypoxia downregulates both ChKα expression and choline kinase activity in PC-3 human prostate cancer cells. The repression of ChKα expression most likely results from transcriptional level mediation by HIF-1α at a newly identified HRE site (HRE7) at the −222 position of the ChKα promoter region. Because the choline phosphorylation reaction is far from equilibrium, small changes in ChKα expression, choline kinase activity, or intracellular ATP concentrations can sensitively modulate cellular choline and phosphocholine concentrations.
Supplementary Material
Acknowledgments
The authors acknowledge the generosity of Dr. H. Franklin Bunn for providing HIF-1α expression plasmids and Dr. Mark Perrella for providing access to his instrumentation facility. We thank Dr. William F. Bosron, Dr. James E. Klaunig, and Dr. Andrew L. Kung for their valuable suggestions throughout this work.
Footnotes
Abbreviations:
- ChIP
- chromatin immunoprecipitation
- ChKα
- choline kinase α
- DMOG
- dimethyloxalylglycine
- EMSA
- electrophoretic mobility shift assay
- hChKα
- human ChKα
- HIF
- hypoxia-inducible factor
- HRE
- hypoxia response element
- MAR
- mass action ratio
- shRNA
- short-hairpin RNA
- VEGF
- vascular endothelial growth factor
This work was funded in part by the National Institutes of Health (TRD: CA108620). Its contents are solely the responsibility of the authors and do not necessarily represent the official views of the National Institutes of Health.
The online version of this article (available at http://www.jlr.org) contains supplementary data in the form of three tables and supplementary material and methods.
REFERENCES
- 1.Kent C. 2005. Regulatory enzymes of phosphatidylcholine biosynthesis: a personal perspective. Biochim. Biophys. Acta. 1733: 53–66. [DOI] [PubMed] [Google Scholar]
- 2.DeGrado T. R., Coleman R. E., Wang S., Baldwin S. W., Orr M. D., Robertson C. N., Polascik T. J., Price D. T. 2001. Synthesis and evaluation of 18F-labeled choline as an oncologic tracer for positron emission tomography: initial findings in prostate cancer. Cancer Res. 61: 110–117. [PubMed] [Google Scholar]
- 3.Katz-Brull R., Seger D., Rivenson-Segal D., Rushkin E., Degani H. 2002. Metabolic markers of breast cancer: enhanced choline metabolism and reduced choline-ether-phospholipid synthesis. Cancer Res. 62: 1966–1970. [PubMed] [Google Scholar]
- 4.Katz-Brull R., Degani H. 1996. Kinetics of choline transport and phosphorylation in human breast cancer cells; NMR application of the zero trans method. Anticancer Res. 16: 1375–1380. [PubMed] [Google Scholar]
- 5.Hara T., Kosaka N., Kishi H. 2002. Development of (18)F-fluoroethylcholine for cancer imaging with PET: synthesis, biochemistry, and prostate cancer imaging. J. Nucl. Med. 43: 187–199. [PubMed] [Google Scholar]
- 6.Ramírez de Molina A., Gallego-Ortega D., Sarmentero-Estrada J., Lagares D., Gómez Del Pulgar T., Bandrés E., García-Foncillas J., Lacal J. C. 2008. Choline kinase as a link connecting phospholipid metabolism and cell cycle regulation: implications in cancer therapy. Int. J. Biochem. Cell Biol. 40: 1753–1763. [DOI] [PubMed] [Google Scholar]
- 7.Talbot J. N., Gutman F., Fartoux L., Grange J. D., Ganne N., Kerrou K., Grahek D, Montravers F., Poupon R., Rosmorduc O. 2006. PET/CT in patients with hepatocellular carcinoma using [(18)F]fluorocholine: preliminary comparison with [ (18)F]FDG PET/CT. Eur. J. Nucl. Med. Mol. Imaging. 33: 1285–1289. [DOI] [PubMed] [Google Scholar]
- 8.Kwee S. A., Wei H., Sesterhenn I., Yun D., Coel M. N. 2006. Localization of primary prostate cancer with dual-phase 18F-fluorocholine PET. J. Nucl. Med. 47: 262–269. [PubMed] [Google Scholar]
- 9.Sarri E., Garcia-Dorado D., Abellan A., Soler-Soler J. 2006. Effects of hypoxia, glucose deprivation and acidosis on phosphatidylcholine synthesis in HL-1 cardiomyocytes. CTP:phosphocholine cytidylyltransferase activity correlates with sarcolemmal disruption. Biochem. J. 394: 325–334. [DOI] [PMC free article] [PubMed] [Google Scholar]
- 10.Bansal A., Shuyan W., Hara T., Harris R. A., Degrado T. R. 2008. Biodisposition and metabolism of [(18)F]fluorocholine in 9L glioma cells and 9L glioma-bearing fisher rats. Eur. J. Nucl. Med. Mol. Imaging. 35: 1192–1203. [DOI] [PMC free article] [PubMed] [Google Scholar]
- 11.Hara T., Bansal A., DeGrado T. R. 2006. Effect of hypoxia on the uptake of [methyl-3H]choline, [1–14C] acetate and [18F]FDG in cultured prostate cancer cells. Nucl. Med. Biol. 33: 977–984. [DOI] [PubMed] [Google Scholar]
- 12.Allen C. B., Schneider B. K., White C. W. 2001. Limitations to oxygen diffusion and equilibration in in vitro cell exposure systems in hyperoxia and hypoxia. Am. J. Physiol. Lung Cell. Mol. Physiol. 281: L1021–L1027. [DOI] [PubMed] [Google Scholar]
- 13.Gurantz D., Laker M. F., Hofmann A. F. 1981. Enzymatic measurement of choline-containing phospholipids in bile. J. Lipid Res. 22: 373–376. [PubMed] [Google Scholar]
- 14.Murray J. J., Dinh T. T., Truett A. P., 3rd, Kennerly D. A. 1990. Isolation and enzymic assay of choline and phosphocholine present in cell extracts with picomole sensitivity. Biochem. J. 270: 63–68. [DOI] [PMC free article] [PubMed] [Google Scholar]
- 15.Infante J. P. 1977. Rate-limiting steps in the cytidine pathway for the synthesis of phosphatidylcholine and phosphatidylethanolamine. Biochem. J. 167: 847–849. [DOI] [PMC free article] [PubMed] [Google Scholar]
- 16.Guynn R. W. 1976. Equilibrium constants under physiological conditions for the reactions of choline kinase and the hydrolysis of phosphorylcholine to choline and inorganic phosphate. J. Biol. Chem. 251: 7162–7167. [PubMed] [Google Scholar]
- 17.Xia X., Kung A. L. 2009. Preferential binding of HIF-1 to transcriptionally active loci determines cell-type specific response to hypoxia. Genome Biol. 10: R113. [DOI] [PMC free article] [PubMed] [Google Scholar]
- 18.Xia X., Lemieux M. E., Li W., Carroll J. S., Brown M., Liu X. S., Kung A. L. 2009. Integrative analysis of HIF binding and transactivation reveals its role in maintaining histone methylation homeostasis. Proc. Natl. Acad. Sci. USA. 106: 4260–4265. [DOI] [PMC free article] [PubMed] [Google Scholar]
- 19.Glunde K., Shah T., Winnard P. T., Jr, Raman V., Takagi T., Vesuna F., Artemov D., Bhujwalla Z. M. 2008. Hypoxia regulates choline kinase expression through hypoxia-inducible factor-1 alpha signaling in a human prostate cancer model. Cancer Res. 68: 172–180. [DOI] [PMC free article] [PubMed] [Google Scholar]
- 20.Uchida T. 1994. Regulation of choline kinase R: analyses of alternatively spliced choline kinases and the promoter region. J. Biochem. 116: 508–518. [DOI] [PubMed] [Google Scholar]
- 21.Boucher Y., Lee I., Jain R. K. 1995. Lack of general correlation between interstitial fluid pressure and oxygen partial pressure in solid tumors. Microvasc. Res. 50: 175–182. [DOI] [PubMed] [Google Scholar]
- 22.Cárdenas-Navia L. I., Yu D., Braun R. D., Brizel D. M., Secomb T. W., Dewhirst M. W. 2004. Tumor-dependent kinetics of partial pressure of oxygen fluctuations during air and oxygen breathing. Cancer Res. 64: 6010–6017. [DOI] [PubMed] [Google Scholar]
- 23.Braun R. D., Lanzen J. L., Snyder S. A., Dewhirst M. W. 2001. Comparison of tumor and normal tissue oxygen tension measurements using OxyLite or microelectrodes in rodents. Am. J. Physiol. Heart Circ. Physiol. 280: H2533–H2544. [DOI] [PubMed] [Google Scholar]
- 24.Aoyama C., Liao H., Ishidate K. 2004. Structure and function of choline kinase isoforms in mammalian cells. Prog. Lipid Res. 43: 266–281. [DOI] [PubMed] [Google Scholar]
- 25.Heerlein K., Schulze A., Hotz L., Bartsch P., Mairbaurl H. 2005. Hypoxia decreases cellular ATP demand and inhibits mitochondrial respiration of a549 cells. Am. J. Respir. Cell Mol. Biol. 32: 44–51. [DOI] [PubMed] [Google Scholar]
- 26.Vander Heiden M. G., Cantley L. C., Thompson C. B. 2009. Understanding the Warburg effect: the metabolic requirements of cell proliferation. Science. 324: 1029–1033. [DOI] [PMC free article] [PubMed] [Google Scholar]
- 27.Izyumov D. S., Avetisyan A. V., Pletjushkina O. Y., Sakharov D. V., Wirtz K. W., Chernyak B. V., Skulachev V. P. 2004. “Wages of fear”: transient threefold decrease in intracellular ATP level imposes apoptosis. Biochim. Biophys. Acta. 1658: 141–147. [DOI] [PubMed] [Google Scholar]
- 28.Elvidge G. P., Glenny L., Appelhoff R. J., Ratcliffe P. J., Ragoussis J., Gleadle J. M. 2006. Concordant regulation of gene expression by hypoxia and 2-oxoglutarate-dependent dioxygenase inhibition: the role of HIF-1alpha, HIF-2alpha, and other pathways. J. Biol. Chem. 281: 15215–15226. [DOI] [PubMed] [Google Scholar]
- 29.Caro J. 2001. Hypoxia regulation of gene transcription. High Alt. Med. Biol. 2: 145–154. [DOI] [PubMed] [Google Scholar]
- 30.Okino S. T., Chichester C. H., Whitlock J. P., Jr 1998. Hypoxia-inducible mammalian gene expression analyzed in vivo at a TATA-driven promoter and at an initiator-driven promoter. J. Biol. Chem. 273: 23837–23843. [DOI] [PubMed] [Google Scholar]
Associated Data
This section collects any data citations, data availability statements, or supplementary materials included in this article.


