

Abstract
The POU-domain transcription POU4F3 is expressed in the sensory cells of the inner ear. Expression begins shortly after commitment to the hair cell (HC) fate, and continues throughout life. It is required for terminal HC differentiation and survival. To explore regulation of the murine Pou4f3 gene, we linked enhanced green fluorescent protein (eGFP) to 8.5 kb of genomic sequence 5’ to the start codon in transgenic mice. eGFP was uniformly present in all embryonic and neonatal HCs. Expression of eGFP was also observed in developing Merkel cells and olfactory neurons as well as adult inner and vestibular HCs, mimicking the normal expression pattern of POU4F3 protein, with the exception of adult outer HCs. Apparently ectopic expression was observed in developing inner ear neurons. On a Pou4f3 null background, the transgene produced expression in embryonic HCs which faded soon after birth both in vivo and in vitro. Pou4f3 null HCs treated with caspase 3 and 9 inhibitors survived longer than untreated HCs, but still showed reduced expression of eGFP. The results suggest the existence of separate enhancers for different HC types, as well as strong autoregulation of the Pou4f3 gene. Bioinformatic analysis of four divergent mammalian species revealed three highly-conserved regions within the transgene: 400 bp immediately 5’ to the Pou4f3 ATG, a short sequence at -1.3 kb, and a longer region at -8.2 to -8.5 kb. The latter contained E-box motifs that bind bHLH transcription factors, including motifs activated by ATOH1. Co-transfection of HEK293 or VOT-E36 cells with ATOH1 and the transgene as a reporter enhanced eGFP expression when compared to the transgene alone. Chromatin immunoprecipitation of the three highly conserved regions revealed binding of ATOH1 to the distal-most conserved region. The results are consistent with regulation of Pou4f3 in HCs by ATOH1 at a distal enhancer.
Keywords: autoregulation, gene expression, hair cell, POU4F3
The sensory hair cells (HCs) of the inner ear depend for development, function and survival upon a number of highly specialized genes. Examples include the transcription factor (TF) ATOH1 (Bermingham et al., 1999), motor proteins myosin VI (Avraham et al., 1995) and myosin VIIA (Hasson et al., 1997), and the acetylcholine receptor subunits alpha-9 (Elgoyhen et al., 1994) and alpha-10 (Elgoyhen et al., 2001). The electromotor protein prestin is even further restricted to the mechanically active outer HCs (Belyantseva et al., 2000; Zheng et al., 2000a). However, these genes are also expressed in other cell types outside of the inner ear. That no genes expressed exclusively in HCs have yet been identified is perhaps not surprising, given the relatively small number of genes in the mammalian genome (Abdellah et al., 2004; Salzberg and Pertea, 2010), and the consequent need for multiple functions of each gene.
The POU-domain TF POU4F3 (BRN-3.1; BRN-3C) is also expressed in the inner ear exclusively by HCs. This occurs from their commitment to the HC lineage and, unusually for a developmental regulator, continues throughout life (Erkman et al., 1996; Xiang et al., 1998). Upon deletion of the murine Pou4f3 gene, HCs form and exhibit early signs of differentiation, but late differentiation is not observed and HCs die perinatally (Erkman et al., 1996; Ryan, 1997; Xiang et al., 1997). The appearance of the dying HCs suggests apoptosis (Xiang et al., 1998) and HC loss is delayed by a pan-caspase inhibitor (Atar and Avraham, 2010).
How genes are regulated in HCs has received relatively little study. Helms et al. (2000) localized regulatory elements in the Atoh1 gene that target gene expression, but did not identify motifs that restrict expression to HCs. Boeda et al. (2001) found a combination of regulatory sequences in the Myo7a gene (about 2 kb) that directed expression to HCs, but not to other tissues that normally express myosin VIIA. Sage et al. (2006) evaluated Cre recombinase expression under the control of 9 kb of 5’ upstream DNA in the Pou4f3 gene. This genomic fragment directed gene expression to HCs but also to other inner ear cells including stromal cells in the vestibular system and supporting cells of the cochlea.
The initiation of POU4F3 expression in newly committed HCs is presumably controlled by upstream developmental TFs. Indeed, Hu et al. (2010) found that a Pou4f3 gene reporter construct was activated in cochlear neural progenitor cells by the class II basic helix-loop-helix (bHLH) TF ATOH1. However, given the restricted temporal expression of most developmental factors, late Pou4f3 gene expression seems likely to be regulated differently. Lifelong expression of the gene in HCs suggests the possibility that this late expression is maintained by positive feedback. We explored the temporal regulation of Pou4f3 in HCs, by generating transgenic mice in which 8.5 kb of DNA 5’ to the Pou4f3 gene is linked to the reporter constructs β-galactosidase or enhanced green fluorescent protein (eGFP). The transgene was expressed on both wild-type and Pou4f3-null backgrounds. In addition, bioinformatic analysis of the transgene, evaluation of transgene expression after ATOH1 or POU4F3 co-transfection, and chromatin immunoprecipitation (ChIP) were conducted to explore mechanisms of Pou4f3 gene regulation.
Experimental Procedures
Generation of transgenic mice
All procedures were approved by the Animal Subjects Committee of the San Diego VA Medical Center, and were in accordance with the National Institute of Health policies regarding the treatment of animal subjects.
An 8.5 kb genomic DNA fragment immediately 5’ to the ATG of the murine Pou4f3 gene was isolated from a strain 129 genomic library. The fragment was ligated to one of two reporter constructs. The first was a beta galactosidase (β-gal) coding sequence. The second consisted of an enhanced green fluorescent protein sequence (eGFP; Clontech, Mountain View CA). In both cases, the SV40 termination sequence was employed. Each of these constructs was used to generate transgenic mice on a C57Bl/6 background by male pronuclear injection of fertilized oocytes, as previously described (Ittner and Gotz, 2007). Transgenic mice in which eGFP expression was controlled by the 8.5 kb 5’ genomic fragment (Pou4f3-8.5-eGFP) were crossed with mice carrying a targeted deletion of the expressed sequence of the Pou4f3 gene (Erkman et al., 1996). F1 animals carrying both the null allele and the Pou4f3-8.5-eGFP transgene were crossed, in order to produce F2 mice in which various combinations of the two transgenes were present.
Histology
The transgenic mice were sacrificed at various ages, and tissues were imaged either unfixed, or fixed in 4% paraformaldehyde (PFA). β-gal was visualized by development in X-gal (Takeda and Toyoda, 1991). eGFP, Texas Red-phalloidin (Invitrogen, Carlsbad CA) labeled actin, and DAPI labeled nuclei were visualized by fluorescence microscopy. Additional eGFP+ tissue was embedded in JB-4 resin and sectioned for high-resolution fluorescence microscopy.
Sensory epithelial culture
Organ of Corti (oC) and vestibular sensory epithelia were harvested from Pou4f3-8.5-eGFP/ Pou4f3+/+ and Pou4f3-8.5-eGFP/Pou4f3-/- mice at birth. Sensory epithelial explants were maintained in the culture medium (DMEM/F12, 25μM HEPES, 5% FBS, 30 U/ml penicillin), and digitally imaged with a Spot camera and software (Diagnostic Instrument, Inc., Sterling Height MI) once per day. Automatic exposure was employed to identify the number of eGFP+ cells, even if expression levels were low. A standard time exposure was used to track the level of eGFP expression over time.
Untreated explants consisting of the entire organ of Corti from Pou4f3-8.5-eGFP/Pou4f3-/- mice (n=10) were compared to explants that were treated with the pan-caspase inhibitor zVAD-fmk (150 μM) (n=5) (Sakurada et al., 2002), the selective caspase 8 inhibitor zLETD-fmk (10 μM) (n=8) (Zhuang et al., 1999), or the selective caspase 9 inhibitor zLEHD-fmk (10 μM) (n=8) (Kermer et al., 2000; Wang et al., 2004). The number of eGFP+ HCs was counted for each full-length explant, with or without caspase inhibitors. All inhibitors were from Calbiochem (San Diego CA).
Bioinformatic analysis
TF binding sites are often arranged in clusters that group combinations of regulatory factors into a functional complex via protein-DNA and protein-protein binding (Ma, 2006). These regulatory domains can sometimes be detected by homology analysis since their function, and to a lesser extent their sequence, are conserved across evolution. To identify critical gene regulatory elements and TFs for Pou4f3 expression in the 8.5 kb of regulatory DNA, we compared 5’ genomic sequences from the Pou4f3 gene between species separated by a substantial period of evolutionary time; mouse, human, dog, and cow (60-100 million years; DeMuth et al., 2006). We performed a series of stepwise alignment in addition to simple sequence alignments of the mouse 8.5 kb region 5’ to the ATG between species, because the locations of distal enhancer elements may not be constrained. Once regions of homology between all four species had been identified, we performed cross-species alignment of binding motifs for known TFs within the regions using rVISTA (http://genome.lbl.gov/vista/index.shtml). We also evaluated the presence of conserved motifs reported in papers but not represented in rVISTA. We refer to the TFs which bind to the conserved motifs as conserved TFs in this paper. To identify potential regulatory TFs, we initially evaluated TFs for which there were fewer than 60 binding sites identified in the 10 kb 5’ to the mouse Pou4f3 ATG. This analysis identified potential TFs for the majority of the highly-conserved, short sequence motifs in the regions of high homology. However, this analysis left a number of highly-conserved sequences that did not correspond to a TF. We then evaluated TFs for which there were more than 60 but less than 500 binding sites in 10 kb of mouse 5’ DNA. This identified potential TF binding motifs for the remaining conserved sequences, albeit with less probability of functional significance. We also used rVISTA to determine whether DNA motifs that have been associated with ATOH1 DNA binding and activation (Klisch et al., 2011) were present and conserved in 8.5 kb of 5’ Pou4f3 regulatory DNA of each of the four mammalian species.
Finally, we assessed TF expression in the inner ear sensory epithelium as reported in the literature and present at embryonic day 14.5 (e14.5) in the GenePaint expression database (http://www.genepaint.org/Frameset.html) to explore their potential involvement in the inner ear sensory epithelial development. To semi-quantify GenePaint expression levels, the expression of Atoh1 mRNA in e14.5 oC was coded as ++, and those of other TFs were coded from – (no expression) to ++ (expression similar to Atoh1 mRNA).
Transfection of HEK293 and VOT-E36cells
We identified clustered and conserved E-box motifs that can support ATOH1 binding in the 8.5 kb DNA with bioinformatic analysis. To evaluate whether ATOH1 might influence the Pou4f3-8.5-eGFP expression, we transfected HEK293 with 1.6 μg/ml of the Pou4f3-8.5-eGFP transgene alone or in combination with 0.8 μg /ml of a plasmid encoding the human Atoh1 mRNA sequence (hAtoh1; OriGene, Rockville MD) using 4 μl/ml lipofectamin (Invitrogen) (n=24 wells for either condition) according to the manufacturer’s instructions. Control wells received a plasmid encoding red fluorescence protein (RFP) to estimate transfection intensity, plasmid encoded hAtoh1 alone, an empty version of the Origene expression vector, or the Pou4f3-8.5-eGFP transgene construct plus the empty vector. Fluorescence was visualized using an inverted fluorescent microscope (IX 70, Olympus, Tokyo Japan) 72 h after transfection. To quantify the intensity of eGFP expression, the average brightness of 60 cells, 15 each from four indendent cultures, was determined by outlining each cell and measuring average pixel intensity, followed by background substraction (Photoshop, version 10.0.1, Adobe Systems Incorporated, San Jose CA). This experiment was replicated twice. In addition, the response of the HEK293 cell populations to co-transfection was evaluated by performing a “virtual Western.” Four independent, confluent HEK293 cell cultures were transfected with either Pou4f3-8.5-eGFP or Pou4f3-8.5-eGFP plus hAtoh1. After 72 hours, the cultures were imaged and any cells expressing eGFP within the entire image were selected based on the wavelength of fluorescence and a fixed threshold. The area of each image that fell above threshold reflected the number of cells expressing eGFP, while the average emission in the eGFP channel reflected the cells’ average eGFP expression level. Average emission times area provided a population measure of eGFP expression. To estimate the efficiency of Atoh1 transfection, confluent HEK293 cells were transfected with an expression vector encoding Atoh1 with a myc/flg tag (hAtoh1-myc/flg; OriGene, Rockville MD), and reacted 72 hours later with an anti-myc/flg antibody. To assess response to POU4F3, HEK293 cells were transfected with Pou4f3-8.5-eGFP alone or with a vector encoding human POU4F3 (hPou4f3).
To assess the response of cells derived from the inner ear, confluent VOT-E36 cells derived from the Immortomouse inner ear by Dr. Matthew Holley (Lawoko-Kerali et al., 2004) were transfected with Pou4f3-8.5-eGFP alone, Pou4f3-8.5-eGFP plus hAtoh1, or Pou4f3-8.5-eGFP plus empty vector and analyzed as above.
Chromatin immunoprecipitation
To determine whether ATOH1 binds to any of the conserved regions of the Pou4f3 gene, six 75cm2 flasks of VOT-E36 cells were grown in MEM with 10% FBS and 50U/ml of γ-IFN (Invitrogen). After the cells were 80% confluent (3×10⁷ cells/flask), they were transfected with either Lipofectamine alone (negative control) (Invitrogen) or 10μg of hAtoh1-myc/flg with Lipofectamine in serum free media. 18 hours later, the transfection was stopped and the cells were allowed to grow for 48 hours total. Cells were then treated with formaldehyde to a final concentration of 1% for 10 minutes to crosslink DNA to protein. Cells were then washed in ice cold PBS and collected using a cell scraper. The samples were sonicated to lyse the cells and shear the DNA/chromatin complexes into ~700 bp lengths. After cleanup of DNA, samples were immunoprecipated with no antibody (control) or 15μg of anti-myc (Abcam) antibody overnight at 4°C. Samples were then coupled to Protein-A beads and washed to purify immunoprecipitated DNA. Decrosslinking was performed by Proteinase K treatment at 65 °C overnight. Samples were cleaned using Affymetrix cDNA cleanup columns and PCR was performed on control and precipitated DNA, using primers that amplified DNA from the proximal conserved region (forward: CTG GGA CAG GAC AGA GGT TTA GG; reverse: GCG GGG GAG ATG GAA TCA AG), distal conserved region 1 (forward: TTT CCA CAC TCT GCC CCC TC; reverse: CCT CTT AGC CTC CTC TTC TTC CTT TAG), or distal conserved region II (forward: AGA GAA AGA GAG AGG AAG GCA AGG; reverse: GGG CAG TTA GTT GGA ACC ACA G).
Data analysis
For sensory epithelial culture and HEK293 or VOT-E36 cell transfection experiments, Fisher’s protected least-significant difference test with correction for multiple tests and t-test was used respectively to evaluate differences between individual conditions using Stat-View software (SAS Institute, Inc, Cary NC), and differences with a p value less than 0.05 were considered significant. The data were presented as means ± standard deviations.
Results
Expression of β-gal was restricted to HCs within the inner ear of Pou4f3-8.5-β-gal mice
Three lines of Pou4f3-8.5-β-gal mice were generated and characterized in neonatal and adult inner ears. Within the inner ear, X-gal reaction product was restricted to HCs. In neonatal animals, all types of both cochlear and vestibular HCs exhibited β-gal expression. However, as illustrated in Fig. 1a for cochlear HCs, the levels observed were highly variable, ranging from undetectable to highly dense. A similar response was observed in vestibular HCs (data not shown). Essentially the same response was observed in all three lines. In the adult inner ear, expression was similar except that no β-gal was observed in cochlear outer HCs (Fig. 1b,1c). These data indicate that regulatory elements that direct gene expression to HCs during development are present in the 8.5 kb 5’ DNA fragment, but may not include all HCs. However, elements that directed expression to adult outer HCs did not appear to be present.
FIG. 1.
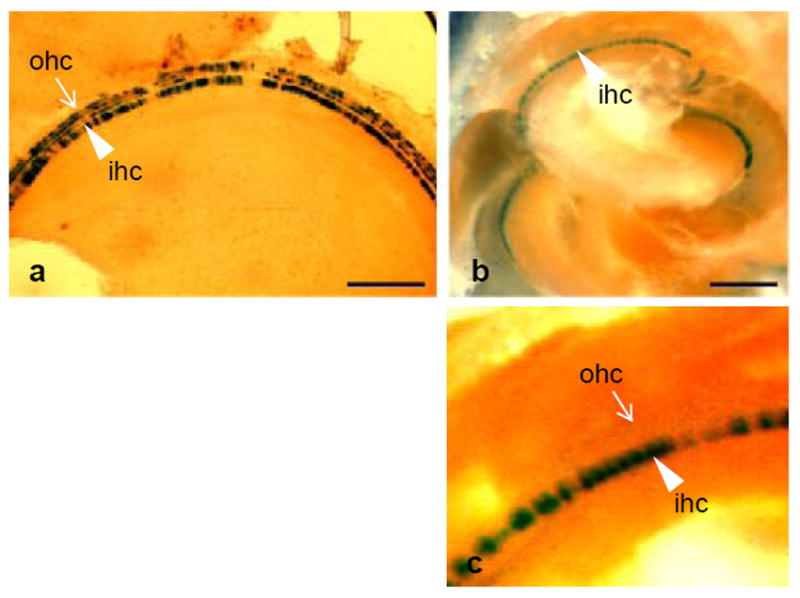
X-gal reaction product reflecting expression of β-galactosidase under the control of 8.5 kb of DNA 5’ to the Pou4f3 ATG, in postnatal day 5 (p5) (a) and adult (b, detail in c) oC. The reaction product in neonates is restricted to inner HCs (arrow head, ihc) and outer HCs (arrow, ohc), but is irregular. In the adult, only inner HCs are labeled. Scale bar = 200 μm.
Sequential change in eGFP expression during development was observed within the inner ear of Pou4f3-8.5-eGFP mice
Three lines of Pou4f3-8.5-eGFP mice were generated and characterized. Similar eGFP expression patterns were observed in all three lines (Figs. 2 and 3), although the level of expression varied among the lines perhaps due to copy number variation.
FIG. 2.

Expression of eGFP in perinatal transgenic mice inner ear, under the control of 8.5 kb of DNA 5’ to the Pou4f3 ATG (Pou4f3-8.5-eGFP mice). (a) The inner ear of an e19.5 embryo from which the capsule is partially removed is shown. The HCs in all of the sensory epithelia express eGFP. oC = organ of Corti; Utr = utricular macula; Sac = saccular macula; SSC = semicircular canal crista. (b) The cochlea from a p5 mouse with the capsule and lateral wall removed. Only HCs express eGFP. (c) A surface preparation of the oC from a p3 mouse and (d) a plastic section of the cochlear duct from a p5 mouse. Outer and inner HCs express eGFP, while erythrocytes auto-fluoresce yellow. (e) A surface preparation of the utricular macula from a p5 mouse and (f) a section through the saccular macula and semicircular canal of a p5 mouse. eGFP expression is limited to vestibular HCs. (g) In the cochlea of 3 week old (3w) mouse eGFP is expressed in the inner and outer HCs (IHCs and OHCs), but in the 6 w mouse (h), OHCs do not show eGFP expression. Phalloidin (red) and DAPI (blue) counterstains. The Scale bar in a, b = 200 μm. The Scale bar in c, d, e, f, h = 100 μm.
FIG. 3.

Confocal microscopy of p5 Pou4f3-8.5-eGFP mouse inner ear sensory epithelia labeled with phalloidin (red) for actin and DAPI (blue) for cell nuclei. A 3-D reconstruction of the oC (a) illustrates the stereociliary arrays of labeled HCs. An image of the utricular macula (b) merges the eGFP labeling in the narrowest region of the HC body with stereociliary arrays and nuclei. The scale bar = 20 μm.
Expression of eGFP was first observed in the newly formed otocyst on embryonic day 10.5 (e10.5) (Fig. 4a). Two closely-spaced cells in the anterior quadrant of the otocyst (Fig. 4b) expressed eGFP. No eGFP expression was observed in the inner ear at e11.5.
FIG. 4.

Expression of eGFP in embryos. In the e10.5 otocyst (Oto) of Pou4f3-8.5-eGFP mice, faint eGFP is expressed ectopically in the statoacoustic ganglion (sag) (a), although the expression disappears after birth. In addition, two closely-spaced cells in the anterior quadrant of the otocyst (b) expressed eGFP. By e14.5, expression was observed in the inner HCs of the basal turn of the cochlea (c), and spiral ganglion (SG). eGFP expression in the SG is not detectable after birth. Outside of the inner ear of the e16.5 fetus, strong eGFP expression was observed in the tips of the digits (d), Merkel cells around the vibrissae (e), as well as the nasal (arrow) and oral (arrow head) epithelia (f). Strong expression was also noted in cells of the amniotic membrane lining the uterus (g). Expression in structures outside of the inner ear decreased in late embryonic development and disappeared during the first week after birth, except for the Merkel cells which persisted for 2-3 weeks. The scale bar in a, d and e = 200 μm. The scale bar in b and c = 50 μm. The scale bar in f and g = 500 μm.
Inner ear eGFP expression was first noted in cells at the position of HCs on e12.5, in the epithelial organs of the vestibular system. By e14.5, expression was observed in the inner HCs of the basal turn of the cochlea (Fig. 4c). By e16.5, all HCs of the cochlea exhibited eGFP expression, but eGFP was not detected in supporting cells or stromal cells under the oC. eGFP expression in HCs was uniform along the length of the cochlea, with none of the variation seen in X-gal labeled sensory epithelia. Robust eGFP expression was noted in all HCs through the first three postnatal weeks (Figs. 2 and 3). Thereafter, expression levels declined but remained clearly visible even in adult cochlear inner HCs and vestibular HCs. In the adult, as with β-gal, eGFP expression was not observed in outer HCs (Fig. 2h).
During development, faint expression of eGFP was also observed in the statoacoustic ganglion at e10.5, and moderate expression was observed in the prenatal cochlear and vestibular ganglia until e16.5 (Fig. 4c). By birth, no inner ear ganglion expression was detectable.
Expression of eGFP was detected outside of the inner ear of Pou4f3-8.5-eGFP mice
Expression of eGFP was observed in other cells of Pou4f3-8.5-eGFP mice (Fig. 4d-g). During embryonic development, strong eGFP expression was observed in Merkel cells around the vibrissae. The tips of the digits also strongly expressed eGFP, as did cells in the nasal and oral epithelia, and the trigeminal nucleus. Strong expression was noted in cells of the amniotic membrane lining the uterus. Slight expression was observed in the dorsal root ganglia. Expression in structures outside of the inner ear decreased in late embryonic development and disappeared during the first week after birth, except for the Merkel cells which persisted for 2-3 weeks.
The number of eGFP+ cells and the intensity of eGFP were lower in Pou4f3-8.5-eGFP/Pou4f3-/- mice than those of Pou4f3+/+ or Pou4f3+/- mice bearing the transgene
In newborn Pou4f3-null mice bearing the transgene, eGFP+ cells were observed in the oC (Fig. 5b) and vestibular sensory epithelia (Fig. 5d). In the oC, numerous eGFP+ cells were present in the upper basal, middle and lower apical turns. Only scattered cells were present in the extreme base. In the vestibular organs, eGFP+ cells were numerous and were distributed across the epithelia, but were clearly present in lower numbers than in Pou4f3+/+ or Pou4f3+/- animals. The level of expression of eGFP was lower and more variable in Pou4f3-null epithelia than in Pou4f3+/+ or Pou4f3+/- animals (Fig. 5a, c).
FIG. 5.
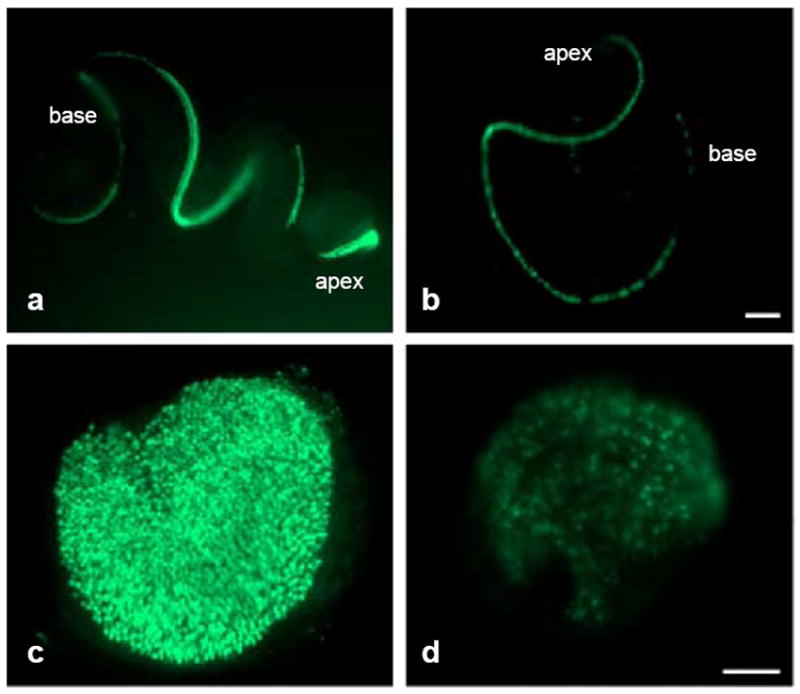
Expression of eGFP in cultured p0 oC and vestibular HCs of Pou4f3+/+ (a, c) and Pou4f3-/- mouse (b, d). The intensity of eGFP is much lower and more variable in Pou4f3-/- epithelia than that of Pou4f3+/+ mouse. Also, scattered HC loss is observed in the extreme basal oC of the Pou4f3-/- mouse. In the vestibular organs, eGFP+ HCs are distributed across the epithelia, but the number and the level of eGFP expression is lower than in Pou4f3+/+ mouse. The scale bar in b = 200 μm. The scale bar applies to a. The scale bar in d = 100 μm. The scale bar applies to c.
In Pou4f3-8.5-eGFP/ Pou4f3-/- oC, the number of eGFP+ cells and the level of eGFP declined in vitro
When postnatal day 0 (p0) oC from wildtype Pou4f3-8.5-eGFP mice was placed in culture, a moderate decline of eGFP intensity was observed across cells over the initial days of culture. Expression then stabilized for the remainder of the 11-day culture period (data not shown). However, no eGFP+ cells were lost.
For Pou4f3-null oC followed over time in culture (Fig. 6), loss of a significant number of eGFP+ cells that had been present at birth was apparent after one day in vitro (1 div), with even more loss at 2 div. By 5 div, very few eGFP+ cells were observed. However, a small number of cells survived until 11 div. In the vestibular organs, gradual cell loss of eGFP+ cells was observed over the first week of culture. The rate of loss then accelerated until few cells were present at 11div.
FIG. 6.
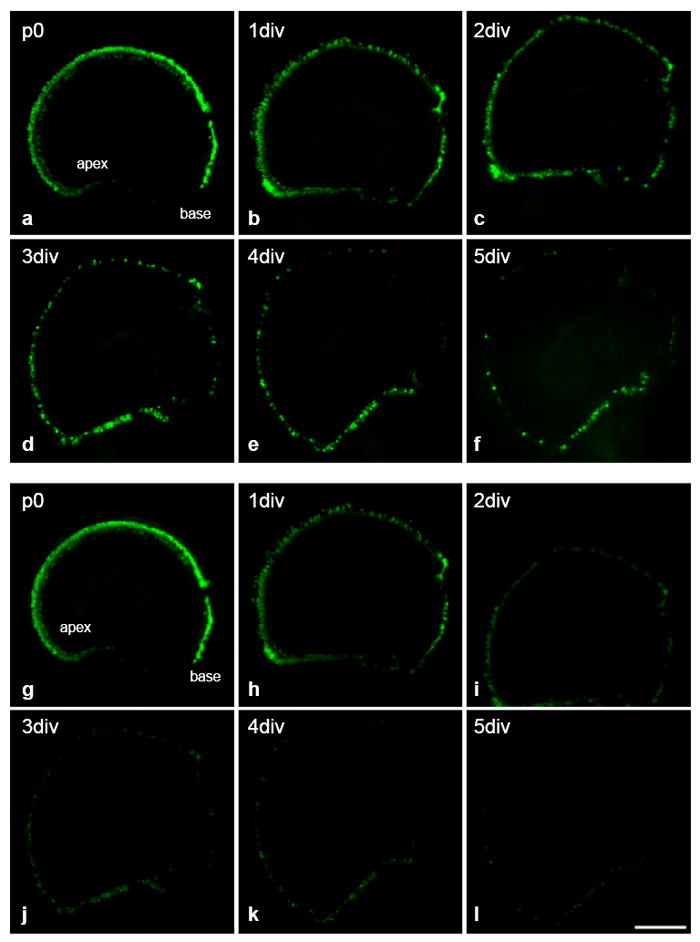
Expression of eGFP in cultured p0 oC of Pou4f3-/- mouse using increased exposure duration to allow detection of all GFP+ cells (a-f), and a uniform exposure time for detection of change of the eGFP level (g-l). A significant number of HCs disappear after one day in vitro (1 div) (a-f). Intensity of eGFP significantly decreased from 1 div (g-l). Few HCs are observed by 3 div, although they remained detectable at 5 div. The scale bar = 200 μm.
For surviving eGFP-positive cells in the Pou4f3-null oC, the level of eGFP expression declined slightly from p0 to 1 div, and then precipitously so that only faint fluorescence was observed by 2 div. The level of eGFP then declined more gradually, but remained detectable above background for more than one week. A similar response was observed in vestibular sensory epithelia.
Caspase inhibitors increased the survival rate of eGFP+ cells in Pou4f3-8.5-eGFP/ Pou4f3-/- sensory epithelia
In contrast to untreated or caspase 8 inhibitor-treated explants, explants treated with the pan-caspase inhibitor or the caspase 9 inhibitor showed minimal loss of eGFP+ HCs until 2 div (p<0.01 from untreated and caspase 8 inhibitor treated samples), and cell survival was significantly higher than in untreated samples for several days afterward (Figs. 7 and 8). On the other hand, explants treated with a caspase 8 inhibitor were initially not significantly different from untreated explants. However, a protective effect was observed at 5 div. Thereafter, all caspase inhibitors showed protective effect, but the number of HCs declined until almost all cells had been lost by day 11.
FIG. 7.

Effect of pan-caspase inhibitor treatment on eGFP+ HCs in Pou4f3-null oC maintained in culture. Expression of eGFP was observed using automatic exposure (a-f) and standard time exposure (g-l). In contrast to untreated epithelia, Pou4f3-null oC treated with the pan-caspase inhibitor zVAD-fmk showed minimal loss of eGFP+ cells from P0 to 2 div. Treatment with the caspase inhibitor also increased eGFP expression levels in surviving cells within Pou4f3-null oC. (Compare the level in Fig. 7 g-l to Fig. 6 g-l.) The scale bar = 200 μm.
FIG. 8.

Quantitative analysis of HC survival during treatment with specific inhibitors of caspase 8 or 9, or with a pan-caspase inhibitor, on HCs in Pou4f3-null oC in culture. (Data points in this figure are shifted slightly along the time axis in order to facilitate comparison between treatment conditions.) A pan-caspase inhibitor and a caspase 9 inhibitor were more effective in delaying the loss of eGFP+ cells than a caspase 8 inhibitor. + or ++ indicates a significant difference at p<0.05 or p<0.01 from non-treated samples. * or ** indicates a significant difference at p<0.05 or p<0.01 from caspase 8 inhibitor-treated samples.
Interestingly, treatment with caspase inhibitors also increased the intensity of eGFP in surviving cells within Pou4f3-8.5-eGFP/ Pou4f3-/- oC, when compared to untreated organs (Figs. 6 and 7). Moreover, the caspase 8 inhibitor zLETDfmk preserved expression to a greater extent than did the caspase 9 inhibitor zLEHDfmk, in contrast to the effects on eGFP+ cell survival rate. Caspase inhibitors had no effect on eGFP expression in wildtype oC.
Three highly conserved regions were identified in the 8.5 kb region 5’ to the mouse Pou4f3 ATG
Three regions that were free from repeats and showed high sequence homology among four widely separated mammalian species were located in the 8.5 kb region of mouse Pou4f3 5’ DNA employed for the transgene, using simple or stepwise alignments. The first region consisted of ~400 bp region immediately 5’ to the ATG (hereafter referred to as the proximal homology region, Fig. 9a). This region contained a conserved TATA box and overlapping initiator element (Fig. 9a, motif ii), at ~300 bp 5’ to the ATG, suggesting that the conserved region represents a core and proximal promoter, as well as a 5’ untranslated region. A second conserved region was identified starting 1.3 kb 5’ to the ATG in all species, with the length of ~60 bp (distal homology region I; Fig. 9b). A third region started 8.2, 4.7, 5.4, and 7.1 kb 5’ to the ATG of the mouse, human, dog, and cow respectively, and with a length of ~260 bp (distal homology region II; Fig. 9c).
FIG. 9.


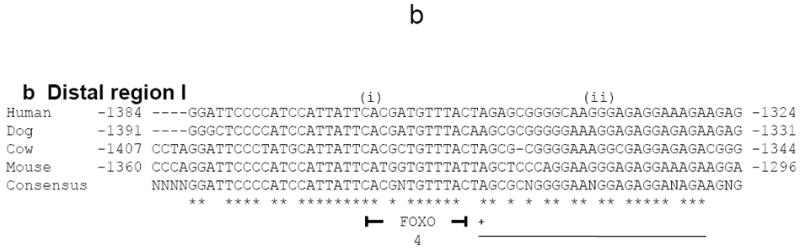

DNA sequences in 8.5 kb 5’ to the mouse Pou4f3 gene ATG, that are highly conserved across four mammalian species. Conserved TF binding motifs found using the rVISTA TF search algorithm are also indicated. One bp 5’ to the start codon is defined as -1. A proximal conserved region was located immediately 5’ to the ATG in all species (a). A second conserved region (distal conserved region I) was located ~1.3 kb 5’ to the ATG in all species (b). A third conserved region (distal conserved region II) was located 8.2-8.4 kb 5’ to the ATG in the mouse, and at various locations in other species (c). Clusters of E-boxes (CANNTG) were conserved in the regions, at numbers much higher than would be expected based on random DNA sequence. Several of these were consistent with activation by class I/class II bHLH heterodimers in general (green), and two E-boxes observed in distal conserved region II (red) can be activated by ATOH1 (Klisch et al., 2011). A number of other conserved motifs for TFs were also identified. Binding sequences of TFs for which there is evidence of expression in the inner ear are identified in the figure. Expression in e14.5 cochlear sensory epithelium was evaluated on a semi-quantitative scale for TFs represented in GenePaint, using ++ to indicate mRNA expression similar to that of Atoh1, and ± to indicate slight expression.
No additional regions of high cross-species homology were detected. This included the region of a variable guanine repeat, associated with variable SP1 binding, identified by Nolan et al. (2007).
The proximal homology region contains conserved binding motifs for a number of TFs
In the 400 bp immediately 5’ to the Pou4f3 ATG, comparison of known DNA binding motifs across the four species genomes revealed one conserved E-box that supports the binding of class I/class II bHLH TFs, such as E2A/ATOH1 according to Akazawa et al. (1995) (Fig. 9a, motif vii). However, this E-box is not consistent with the ATOH1 activation motif recently identified by Klisch et al. (2011). An additional E-box consistent with binding by class I bHLH TF homodimers and class III bHLH TFs (Fig. 9a, motif ix) and HES binding sites (Fig. 9a, motifs iv and vii) (Akazawa et al., 1995; Atchley and Fitch 1997; Jippo et al., 1997; Fukuda et al., 2006) were also conserved. A number of additional conserved motifs consistent with binding by PATZ1, MEIS1, MAZ, ELF2, ETS2, GABPA, ETV4, NFE2 and NFE2L2, AHR, AHR/ARNT heterodimer, AHR/HIF heterodimer, c-ETS1-68, ETS1, LMO2/COM heterodimer, NKX2-5, NFKB1, SMAD3, NKX2-1, TCFCP2, and ETS2 were also identified (at Fig. 9a, motifs i, iii, v, vi, viii and x) by rVISTA. However, of these factors, only ELF2 and NFE2 are reported to be expressed in the developing inner ear, or were found to be expressed in the sensory cell region of the cochlear sensory epithelium at e14.5 in the GenePaint database (GenePaint set ID DA104-2C and EH419-2D respectively).
Distal homology region I contains conserved TF binding motifs but no E-box
A conserved motif consistent with binding by CUX1, FOXQ1, FOXF1a, and FOXO4 was found in the ~60 bp conserved region 1.3 kb 5’ to the Pou4f3 ATG (Fig. 9b, motif i). Of these TFs, only FOXO4 was expressed in the sensory cell region of the cochlear sensory epithelium at e14.5 (GenePaint set ID MH3109-5B). One conserved motif that does not correspond to a known TF binding site was also identified (Fig.9b, motif ii).
Distal homology region II contains four clustered conserved E-boxes
Nine highly conserved motifs were identified in distal homology region II (Fig. 9c, motifs i-ix). This included four clustered E-boxes (Fig. 9c, motifs iii, v, vi and vii). Three of these E-boxes (motifs iii, vi and vii) support the binding of heterodimers between class I and class II bHLH TFs, and two can be activated by ATOH1, according to the recent paper of Klisch et al. (2011) (motifs vi and vii). The remaining E-box (motif v) supports the binding of class III and IV bHLH factors (Fisher et al., 1992; Hamid and Kakar, 2004). None of the additional five conserved motifs supported the binding of TFs for which there were fewer than 60 binding sites in the 10 kb 5’ to the mouse Pou4f3 ATG. Therefore, we screened TF binding motifs for which numbers were 61-500 in 10 kb of 5’ DNA. Two of the motifs (i and viii) were consistent with binding by SP1, FOXM1, E2F1, or GATA TFs. Of these TFs, SP1 is expressed in the cochlea (Gross et al., 2011) and has been implicated in the regulation of the human Pou4f3 gene (Nolan et al., 2007) while GATA3 shows strong expression in the developing cochlear sensory cell region (Lillevali et al., 2004) (GenePaint set ID MH754-2B). No TFs were identified for the remaining two highly conserved motifs (Fig. 9c, motifs ii and ix). While there are 12 class I/class II-binding E-boxes in the transgene, only the four mentioned (three in distal region II and one in the proximal region) are conserved across all four mammalian species. In addition, there are only two conserved E-boxes that can be activated by ATOH1 (Klisch et al., 2011), both in distal region II.
Co-transfection of Pou4f3-8.5-eGFP with Atoh1 enhanced eGFP intensity in HEK293 and VOT-E36 cells
Because we identified clustered E-boxes consistent with binding and activation by ATOH1 in highly conserved regions of our Pou4f3 transgene, we speculated that ATOH1 would play a role in the regulation of Pou4f3 expression. To evaluate this possibility, we transfected HEK293 cells with the same Pou4f3-8.5-eGFP construct used to generate the transgenic mouse, either alone or in combination with hAtoh1.
Transfection of the transgene alone into HEK-293 cells induced modest eGFP expression in a small number of cells, even though transfection with an RFP reporter indicated that more than 50% of cells should have been transfected. However, co-transfection of hAtoh1 with the transgene significantly enhanced both the number of cells expressing eGFP, as well as the average eGFP intensity of sampled GFP-positive cells (Fig. 10a,b; p < .0001). To assess overall GFP expression, a measure of average eGFP intensity (background subtracted fluorescence intensity in the appropriate spectral range) times the area expressing eGFP (all pixels above threshold) was used. This “virtual Western” averaged 975 (±821) emittence units × pixel area for cultures transfected with the Pou4f3-8.5-eGFP construct alone, versus 44,940 (±6515) for cultures co-transfected with Pou4f3-8.5-eGFP construct plus the hAtoh1 construct (p <.0001).
FIG. 10.

Responsiveness of the Pou4f3-8.5-eGFP transgene to co-transfection with Atoh1. (a) Co-transfection of HEK293 cells with the transgene and hAtoh1 resulted in more eGFP+ cells and stronger eGFP expression than with the transgene alone. Expression of RFP or anti-Myc immunolabeled hAtoh1-Myc/Flg indicate the efficiency of transfection. The scale bar = 100 μm. Increased eGFP observed after co-transfection of Pou4f3-8.5-eGFP in both HEK293 (b) and VOT-E36 (c) cells with hAtoh1 was statistically significant. Co-transfection with an empty vector had no effect. (d) PCR of DNA immunoprecipitated with anti-myc following transfection of VOT-E36 cells with hAtoh1-myc/flg showed a much more intense band for distal conserved region II than was observed with unselected DNA.
Transfection of HEK293 cells with hAtoh1 alone or with an empty vector alone resulted in no eGFP expression, while co-transfection of Pou4f3-8.5-eGFP construct plus an empty vector produced eGFP expression comparable to that observed with Pou4f3-8.5-eGFP alone (Figure 10b, p >0.5). Co-transfection of VOT-E36 cells with Pou4f3-8.5-eGFP plus hAtoh1 gave results similar to those observed with HEK-293 cells (Figure 10c, p < .05).
Immunoprecipitation of conserved distal region II from VOT-E36 cells was enhanced by transfection with hAtoh1
To determine whether hAtoh1 binds to conserved regulatory regions in the Pou4f3 gene, we transfected VOT-E36 cells with hAtoh1-Myc/Flg. After 72 hours, ChIP was performed with an anti-Myc antibody. Immunoprecipitated and unselected DNA was amplified with primers specific for the conserved proximal region, or for conserved distal regions I or II (Figure 10d). PCR bands produced amplification of DNA from the proximal region was comparable between unselected and immunoprecipitated DNA, while a slightly more intense band for distal region I was observed for selected DNA. However, with distal region II primers, a very weak band was amplified from unselected DNA while a robust band was obtained from immunoprecipitated DNA. The activity of hAtoh1-Myc/Flg was verified by co-transfection of HEK-293 cells with Pou4f3-8.5-eGFP plus hAtoh1 versus Pou4f3-8.5-eGFP. Results were comparable to those seen with hAtoh1.
Co-transfection of Pou4f3-8.5-eGFP with Pou4f3 enhanced eGFP intensity in HEK293 cells
To evaluate the potential for regulation of the Pou4f3 gene by POU4F3 itself, the Pou4f3-8.5-eGFP reporter construct was transfected into HEK293 cells alone, or co-transfected with an expression plasmid encoding human POU4F3 (hPou4f3). The average fluorescence intensity of HEK cells in the eGFP channel was increased from 45.0 (±7.9) to 63.7 (±12.5) emittence units by hPou4f3 (p < .05).
Discussion
Expression of eGFP under the control of 8.5 kb of 5’ Pou4f3 genomic DNA largely though not completely mimics, in transgenic mice, in vivo expression of Pou4f3 mRNA (Erkman et al., 1996; Artinger et al., 1998; Leonard et al., 2002). That is, expression occurred in most cells that normally produce POU4F3. Variable X-gal reaction product in the HCs of Pou4f3-8.5-β-gal mice seems likely to have resulted from irregular X-gal penetration into HCs, since in the eGFP transgenic, eGFP was uniformly present in all HCs. The eGFP expression pattern suggests the presence of enhancers that direct gene expression to HCs in the 8.5 kb 5’ segment of the Pou4f3 gene. However, ectopic inner ear expression was also observed, notably in cells in the statoacoustic ganglion and in the embryonic cochlear and vestibular ganglia. Brief eGFP expression observed in two anterior otocyst cells at e10.5 has not been reported for Pou4f3 mRNA or POU4F3 protein. The cells positive for eGFP could therefore reflect brief, restricted Pou4f3 expression, or ectopic reporter gene expression. Atoh1 mRNA expression has been noted in the otocyst at this age (Matei et al., 2005).
Despite a similar promoter construct, the eGFP transgene expression pattern we observed varied from that documented in transgenic mice using Pou4f3-cre (9 kb of 5’ DNA) × Rosa26 or × pRbflox/flox animals (Sage et al., 2006). Sage et al. (2006) observed more ectopic expression than was seen in our animals. This may not reflect differential regulation in the two constructs, since an indirect detection method, such as that based on Cre recombinase, may be more sensitive than detection of eGFP directly driven by Pou4f3 regulatory DNA.
While our data are consistent with the presence in the transgene of enhancers that specifically direct expression to HCs, a notable difference from the native Pou4f3 gene was adult outer HCs. We (Erkman et al., 1996) previously demonstrated robust Pou4f3 mRNA expression in adult outer HCs, while Xiang et al. (1997) demonstrated the presence of POU4F3 protein. However, adult mice bearing either the Pou4f3-8.5-β-gal or the Pou4f3-8.5-eGFP transgene did not exhibit reporter expression in outer HCs.
These data suggest a minimum of two HC enhancers present in the Pou4f3 gene. One enhancer located within the 8.5 kb 5’ to the start codon directs early expression to all HCs, and late expression to inner and vestibular HCs. One or more additional enhancers, presumably located outside of this region, direct late expression to outer HCs. It may be relevant that outer HCs develop many unique characteristics, beginning at the time that reporter gene expression decreases in Pou4f3-8.5-eGFP mice. It might be speculated that enhancers similar to those directing late outer HC Pou4f3 expression regulate expression of other outer HC genes such as prestin (Gross et al., 2010). Additional analysis of the Pou4f3 gene will be necessary to address this issue.
A striking feature of our Pou4f3 transgene is the cluster of four canonical E-boxes (CANNTG) in distal region II, 8.2-8.5 kb 5’ to the murine Pou4f3 ATG, that is conserved across three other widely divergent mammalian species. This E-box density is much higher than would be expected, based on random DNA sequence (Krizhanovsky et al., 2006). Such clustering has been linked to direct regulation by bHLH TFs (Krizhanovsky et al., 2006), since the E-box is a mandatory element by which bHLH TFs bind DNA and regulate gene transcription. Class I bHLH TFs, like the E2A proteins E12 and E47, are expressed in many tissues and are capable of forming either homo- or heterodimers that bind E-boxes (Akazawa et al., 1995; Massari and Murre, 2000; Slattery et al., 2008). On the other hand, class II bHLH TFs such as ATOH1, NEUROD, or MYOD typically show a tissue-restricted pattern of expression, and are generally incapable of forming homodimers. They heterodimerize with class I TFs to bind a specific subset of E-box motifs, primarily CAGCTG and CAGGTG (CACCTG in reverse) (Akazawa et al., 1995; Conway et al., 2010). Three of the E-boxes in Pou4f3 distal homology region II are of this type. Moreover, two of these E-boxes are consistent with the recently described motif that is associated with activation by ATOH1 (Klisch et al., 2011). Distal region II also contains conserved, non-canonical motifs for binding HES factors (rVISTA and TRANSFAC data bases), well known negative regulators of ATOH1 in HC development that are strongly expressed in the sensory epithelium (Zheng et al., 2000b; Zine et al., 2001; Li et al., 2008), inside the cluster of E-boxes (Fig. 9c, motif vi). These motifs all suggest the potential of distal homology region II to serve as a Pou4f3 regulatory sequence important to HCs. Two canonical E-boxes are also present in the proximal conserved region, and one of these supports the binding of class I/class II heterodimers (Fig. 9a, motif vii), although it is not consistent with the ATOH1 activation motif identified by Klisch et al. (2011). This and its location imply that the proximal conserved region is also of potential importance to regulation of the Pou4f3 gene.
Comparative analysis of mammalian genomes is often used to identify TF binding sites. However, might including non-mammalian vertebrates have identified more highly-conserved motifs? Dermitzakis and Clark (2002) reported widespread turnover of TF binding sites between mammalian species, with loss of 30-40% of sites between mouse and human. Hannenhalli (2008) similarly argues that human/mouse homology is likely to identify only ancient regulatory elements. Chan et al. (2009) found that while tissue patterns of gene expression are highly conserved between mammals and non-mammalian vertebrates, nonexonic sequence is highly divergent. They concluded that homology of distantly-related vertebrates is unlikely to identify most tissue-specific regulatory sequences.
Regarding TFs that may bind to conserved E-boxes in the Pou4f3 gene, there are many possible combinations of class I/class II bHLH factors that preferentially bind to appropriate E-boxes, and binding affinity can vary with different binding partners (Conway et al., 2010). However, when the timing of Pou4f3 gene expression onset is considered, ATOH1 is the only known class II bHLH TF expressed at high levels in HCs at a time appropriate to mediate Pou4f3 gene regulation (Xiang et al., 1998; Bermingham et al., 1999; Woods et al., 2004). Strongly supporting this possibility, Hu et al. (2010) co-transfected both an ATOH1 expression construct and a reporter construct consisting of 1244 bp of 5’ murine Pou4f3 genomic DNA driving luciferase expression in cochlear neural progenitor cells. They found that ATOH1 significantly increased expression of the reporter. Our observation that co-transfection of plasmids encoding hAtoh1 and the Pou4f3-8.5-eGFP transgene produced increased eGFP expression in HEK293 and VOT-E36 cells, as well as an increase in the overall number of eGFP+ cells, is similarly consistent with an hypothesis of direct binding of ATOH1 to the transgene. Moreover, our finding that an antibody against tagged ATOH1 preferentially immunoprecipitated distal region I and II DNA from hAtoh1-transfected VOT-E36 cells provides strong evidence of direct binding of ATOH1 at these sites.
Class II bHLH TFs require a class I partner for high-affinity binding to their DNA motifs. There are many potential class I bHLH partners of ATOH1, since these factors are constitutively expressed by many cell types. The E2A proteins such as E12 and E47 have been suggested for this role in HCs by other authors (Helms et al., 2000; Zheng et al., 2000b; Scheffer et al., 2007), and E2a mRNA is expressed at low levels in the developing sensory epithelium at e14.5 (see GenePaint set ID 770-6C, 2C, 5B).
Other conserved TF binding sites within distal homology region II include two sequences that support GATA TF binding, one of which overlaps with conserved motifs for FOXM1 and E2F1. GATA3 shows very strong expression in the developing oC (see GenePaint set ID MH754-2B) and is known to be involved in its development (Lawoko-Kerali et al., 2002; Lillevali et al., 2004). The presence of highly conserved GAT motifs is consistent with GATA3 binding to distal homology region II in Pou4f3 regulation. Finally, two of the highly conserved sequences in distal homology region II did not correspond to known TF binding sites (Fig. 9c, motifs ii and ix). These motifs could support binding of TFs for which DNA binding sequences are not yet defined, or could serve another function. Enhancers often support the binding of multiple TFs in a combinatorial code. The cluster of conserved known and potential binding motifs in distal homology region II suggests that this site may represent an enhancer in the Pou4f3 gene, regulated by a complex of TFs.
In distal homology region I, two motifs were recognized as conserved (Fig. 9b, motifs i and ii). One of these supports binding by FOXO4, a member of the forkhead TF family (Wijchers et al., 2006). FOXO4 is known to regulate expression of Znf216, identified as a candidate gene for hearing loss (Hishiya et al., 2006).
Our data also suggest that the Pou4f3 gene is subject to autoregulation. We observed that Pou4f3-null oC lost most eGFP+ cells after a few days in vitro, and that eGFP expression even in the surviving cells was reduced to extremely low levels. This suggests that POU4F3 protein is required not only for the survival of HCs, but also for maintaining expression of its own gene into adulthood. This conclusion is supported by our observation that co-transfection of hPou4f3 with Pou4f3-8.5-eGFP in HEK293 cells enhanced eGFP expression compared to Pou4f3-8.5-eGFP alone. Taken together, our data imply that the early regulatory signals that initiate Pou4f3 gene expression and maintain it during development are normally replaced by positive autoregulation of the gene, either direct or indirect, during the first week after birth.
The loss of eGFP-positive HCs in Pou4f3-null oC was delayed by treatment with pan-caspase and specific caspase inhibitors, implicating apoptosis in the death of the undifferentiated HCs. Xiang et al. (1998) showed that Pou4f3-null HCs die by apoptosis using TUNEL labeling (Xiang et al., 1998), and Atar and Avraham (2010) found that a pan-caspase inhibitor delayed embryonic Pou4f3-null HC death. Our data support their conclusion of apoptotic cell death. Moreover, the fact that a caspase inhibitor was more effective in delaying the loss of eGFP+ cells than a caspase 8 inhibitor suggests that Pou4f3-null HCs die via the intrinsic pathway of apoptosis rather than a death-receptor mediated process (Galluzzi et al., 2009). This may reflect the involvement of Bcl2 family proteins (Tomicic and Kaina, 2001; Galluzzi et al., 2009; Rolland and Conradt 2010). The related TF POU4F1 has been shown to directly regulate expression of the anti-apoptotic protein Bcl2 (Smith et al., 1998), which opposes activation of the intrinsic pathway of apoptosis by enhancing the integrity of mitochondrial membranes.
Research Highlights.
A 5’ genomic DNA fragment from the murine Pou4f3 gene directs gene expression to hair cells.
The pattern of expression suggests multiple hair cell enhancers in the Pou4f3 gene.
Three regions within this fragment are highly conserved across mammals.
Clustered E-boxes are consistent with class II bHLH transcription factor binding.
The class II factor ATOH1 binds to, and regulates expression directed by, the 5’ DNA fragment.
Acknowledgments
Supported by grants from the Research Service of the Veterans Administration, the NIH/NIDCD (RO1 DC000139), and the National Organization for Hearing Research (NOHR). Eduardo Chavez managed the mouse colony, Julie Lightner formatted the manuscript and Dr. Elizabeth Keithley read the manuscript and provided critical comments. Dr. Matthew Holley generously provided VOT-E36 cells. Their assistance is gratefully acknowledged.
Abbreviations
- β-gal
beta-galactosidase
- bHLH
basic helix-loop-helix
- ChIP
chromatin immunoprecipitation
- eGFP
enhanced green fluorescent protein
- HCs
hair cells
- oC
organ of Corti
- PFA
paraformaldehyde
- PCR
polymerase chain reaction
- p5
postnatal day 5
- RFP
red fluorescent protein
- SG
spiral ganglion
- TF
transcription factor
- Tg
transgene
Footnotes
Publisher's Disclaimer: This is a PDF file of an unedited manuscript that has been accepted for publication. As a service to our customers we are providing this early version of the manuscript. The manuscript will undergo copyediting, typesetting, and review of the resulting proof before it is published in its final citable form. Please note that during the production process errors may be discovered which could affect the content, and all legal disclaimers that apply to the journal pertain.
Contributor Information
Masatsugu Masuda, Email: masoeur13@mac.com.
Didier Dulon, Email: didier.dulon@inserm.fr.
Kwang Pak, Email: kpak@vapop.ucsd.edu.
Lina M. Mullen, Email: lmmullen@ucsd.edu.
Yan Li, Email: yali@ucsd.edu.
Linda Erkman, Email: Linda.erkman@bluewin.ch.
Allen F. Ryan, Email: afryan@ucsd.edu.
References
- Abdellah Z, et al. Finishing the euchromatic sequence of the human genome. Nature. 2004;431:931–945. doi: 10.1038/nature03001. [DOI] [PubMed] [Google Scholar]
- Akazawa C, Ishibashi M, Shimizu C, Nakanishi S, Kageyama R. A mammalian helix-loop-helix factor structurally related to the product of Drosophila proneural gene atonal is a positive transcriptional regulator expressed in the developing nervous system. J Biol Chem. 1995;270:8730–8778. doi: 10.1074/jbc.270.15.8730. [DOI] [PubMed] [Google Scholar]
- Artinger KB, Fedtsova N, Rhee JM, Bronner-Fraser M, Turner E. Placodal origin of Brn-3-expressing cranial sensory neurons. J Neurobiol. 1998;36:572–585. doi: 10.1002/(sici)1097-4695(19980915)36:4<572::aid-neu10>3.0.co;2-a. [DOI] [PubMed] [Google Scholar]
- Atar O, Avraham KB. Anti-apoptotic factor z-Val-Ala-Asp-fluoromethylketone promotes the survival of cochlear hair cells in a mouse model for human deafness. Neuroscience. 2010;168:851–857. doi: 10.1016/j.neuroscience.2010.04.011. [DOI] [PubMed] [Google Scholar]
- Atchley WR, Fitch WM. A natural classification of the basic helix-loop-helix class of transcription factors. Proc Natl Acad Sci U S A. 1997;94:5172–5176. doi: 10.1073/pnas.94.10.5172. [DOI] [PMC free article] [PubMed] [Google Scholar]
- Avraham KB, Hasson T, Steel KP, Kingsley DM, Russell LB, Mooseker MS, Copeland NG, Jenkins NA. The mouse Snell’s waltzer deafness gene encodes an unconventional myosin required for structural integrity of inner ear hair cells. Nat Genet. 1995;11:369–375. doi: 10.1038/ng1295-369. [DOI] [PubMed] [Google Scholar]
- Belyantseva IA, Adler HJ, Curi R, Frolenkov GI, Kachar B. Expression and localization of prestin and the sugar transporter GLUT-5 during development of electromotility in cochlear outer hair cells. J Neurosci. 2000;20:RC116. doi: 10.1523/JNEUROSCI.20-24-j0002.2000. [DOI] [PMC free article] [PubMed] [Google Scholar]
- Bermingham NA, Hassan BA, Price SD, Vollrath MA, Ben-Arie N, Eatock RA, Bellen HJ, Lysakowski A, Zoghbi HY. Math1: an essential gene for the generation of inner ear hair cells. Science. 1999;284:1837–1841. doi: 10.1126/science.284.5421.1837. [DOI] [PubMed] [Google Scholar]
- Boeda B, Weil D, Petit C. A specific promoter of the sensory cells of the inner ear defined by transgenesis. Hum Mol Genet. 2001;10:1581–1589. doi: 10.1093/hmg/10.15.1581. [DOI] [PubMed] [Google Scholar]
- Chan ET, Quon GT, Chua G, Babak T, Trochesset M, Zirngibl RA, Aubin J, Ratcliffe MJ, Wilde A, Brudno M, Morris QD, Hughes TR. Conservation of core gene expression in vertebrate tissues. J Biol. 2009;8:33. doi: 10.1186/jbiol130. [DOI] [PMC free article] [PubMed] [Google Scholar]
- Conway SJ, Firulli B, Firulli AB. A bHLH code for cardiac morphogenesis. Pediatr Cardiol. 2010;31:318–324. doi: 10.1007/s00246-009-9608-x. [DOI] [PMC free article] [PubMed] [Google Scholar]
- Demuth JP, De Bie T, Stajich JE, Cristianini N, Hahn MW. The evolution of mammalian gene families. PLoS One. 2006;1:e85. doi: 10.1371/journal.pone.0000085. [DOI] [PMC free article] [PubMed] [Google Scholar]
- Dermitzakis ET, Clark AG. Evolution of transcription factor binding sites in mammalian gene regulatory regions: conservation and turnover. Mol Biol Evol. 2002;19:1114–1121. doi: 10.1093/oxfordjournals.molbev.a004169. [DOI] [PubMed] [Google Scholar]
- Elgoyhen AB, Johnson DS, Boulter J, Vetter DE, Heinemann S. Alpha 9: an acetylcholine receptor with novel pharmacological properties expressed in rat cochlear hair cells. Cell. 1994;79:705–715. doi: 10.1016/0092-8674(94)90555-x. [DOI] [PubMed] [Google Scholar]
- Elgoyhen AB, Vetter DE, Katz E, Rothlin CV, Heinemann SF, Boulter J. Alpha10: a determinant of nicotinic cholinergic receptor function in mammalian vestibular and cochlear mechanosensory hair cells. Proc Natl Acad Sci U S A. 2001;98:3501–3506. doi: 10.1073/pnas.051622798. [DOI] [PMC free article] [PubMed] [Google Scholar]
- Erkman L, McEvilly RJ, Luo L, Ryan AK, Hooshmand F, O’Connell SM, Keithley EM, Rapaport DH, Ryan AF, Rosenfeld MG. Role of transcription factors Brn-3.1 and Brn-3.2 in auditory and visual system development. Nature. 1996;381:603–606. doi: 10.1038/381603a0. [DOI] [PubMed] [Google Scholar]
- Fisher DE, Parent LA, Sharp PA. Myc/Max and other helix-loop-helix/leucine zipper proteins bend DNA toward the minor groove. Proc Natl Acad Sci U S A. 1992;89:11779–11783. doi: 10.1073/pnas.89.24.11779. [DOI] [PMC free article] [PubMed] [Google Scholar]
- Fukuda A, Kawaguchi Y, Furuyama K, Kodama S, Horiguchi M, Kuhara T, Koizumi M, Boyer DF, Fujimoto K, Doi R, et al. Ectopic pancreas formation in Hes1-knockout mice reveals plasticity of endodermal progenitors of the gut, bile duct, and pancreas. J Clin Invest. 2006;116:1484–1493. doi: 10.1172/JCI27704. [DOI] [PMC free article] [PubMed] [Google Scholar]
- Galluzzi L, Blomgren K, Kroemer G. Mitochondrial membrane permeabilization in neuronal injury. Nat Rev Neurosci. 2009;10:481–494. doi: 10.1038/nrn2665. [DOI] [PubMed] [Google Scholar]
- Gross J, Angerstein M, Fuchs J, Stute K, Mazurek B. Expression analysis of prestin and selected transcription factors in newborn rats. Cell Mol Neurobiol. 2011 May 26; doi: 10.1007/s10571-011-9708-z. Epub ahead of print. [DOI] [PMC free article] [PubMed] [Google Scholar]
- Gross J, Stute K, Moller R, Fuchs J, Amarjargal N, Pohl EE, Angerstein M, Smorodchenko A, Mazurek B. Expression of prestin and Gata-3,-2,-1 mRNA in the rat organ of Corti during the postnatal period and in culture. Hear Res. 2010;261:9–21. doi: 10.1016/j.heares.2009.12.017. [DOI] [PubMed] [Google Scholar]
- Hamid T, Kakar SS. PTTG/securin activates expression of p53 and modulates its function. Mol Cancer. 2004;3:18. doi: 10.1186/1476-4598-3-18. [DOI] [PMC free article] [PubMed] [Google Scholar]
- Hannenhalli S. Eukaryotic transcription factor binding sites--modeling and integrative search methods. Bioinformatics. 2008;24:1325–1331. doi: 10.1093/bioinformatics/btn198. [DOI] [PubMed] [Google Scholar]
- Hasson T, Gillespie PG, Garcia JA, MacDonald RB, Zhao Y, Yee AG, Mooseker MS, Corey DP. Unconventional myosins in inner-ear sensory epithelia. J Cell Biol. 1997;137:1287–1307. doi: 10.1083/jcb.137.6.1287. [DOI] [PMC free article] [PubMed] [Google Scholar]
- Helms AW, Abney AL, Ben-Arie N, Zoghbi HY, Johnson JE. Autoregulation and multiple enhancers control Math1 expression in the developing nervous system. Development. 2000;127:1185–1196. doi: 10.1242/dev.127.6.1185. [DOI] [PubMed] [Google Scholar]
- Hishiya A, Iemura S, Natsume T, Takayama S, Ikeda K, Watanabe K. A novel ubiquitin-binding protein ZNF216 functioning in muscle atrophy. EMBO J. 2006;25:554–564. doi: 10.1038/sj.emboj.7600945. [DOI] [PMC free article] [PubMed] [Google Scholar]
- Hu X, Huang J, Feng L, Fukudome S, Hamajima Y, Lin J. Sonic hedgehog (SHH) promotes the differentiation of mouse cochlear neural progenitors via the Math1-Brn3.1 signaling pathway in vitro. J Neurosci Res. 2010;88:927–935. doi: 10.1002/jnr.22286. [DOI] [PMC free article] [PubMed] [Google Scholar]
- Ittner LM, Gotz J. Pronuclear injection for the production of transgenic mice. Nat Protoc. 2007;2:1206–1215. doi: 10.1038/nprot.2007.145. [DOI] [PubMed] [Google Scholar]
- Jippo T, Morii E, Tsujino K, Tsujimura T, Lee YM, Kim DK, Matsuda H, Kim HM, Kitamura Y. Involvement of transcription factor encoded by the mouse mi locus (MITF) in expression of p75 receptor of nerve growth factor in cultured mast cells of mice. Blood. 1997;90:2601–2608. [PubMed] [Google Scholar]
- Kermer P, Ankerhold R, Klocker N, Krajewski S, Reed JC, Bahr M. Caspase-9: involvement in secondary death of axotomized rat retinal ganglion cells in vivo. Brain Res Mol Brain Res. 2000;85:144–150. doi: 10.1016/s0169-328x(00)00256-4. [DOI] [PubMed] [Google Scholar]
- Klisch TJ, Xi Y, Flora A, Wang L, Li W, Zoghbi HY. In vivo Atoh1 targetome reveals how a proneural transcription factor regulates cerebellar development. Proc Natl Acad Sci U S A. 2011;108:3288–3293. doi: 10.1073/pnas.1100230108. [DOI] [PMC free article] [PubMed] [Google Scholar]
- Krizhanovsky V, Soreq L, Kliminski V, Ben-Arie N. Math1 target genes are enriched with evolutionarily conserved clustered E-box binding sites. J Mol Neurosci. 2006;28:211–229. doi: 10.1385/JMN:28:2:211. [DOI] [PubMed] [Google Scholar]
- Lawoko-Kerali G, Rivolta MN, Holley M. Expression of the transcription factors GATA3 and Pax2 during development of the mammalian inner ear. J Comp Neurol. 2002;442:378–391. doi: 10.1002/cne.10088. [DOI] [PubMed] [Google Scholar]
- Lawoko-Kerali G, Milo M, Davies D, Halsall A, Helyer R, Johnson CM, Rivolta MN, Tones MA, Holley MC. Ventral otic cell lines as developmental models of auditory epithelial and neural precursors. Dev Dyn. 2004;231:801–814. doi: 10.1002/dvdy.20187. [DOI] [PubMed] [Google Scholar]
- Leonard JH, Cook AL, Van Gele M, Boyle GM, Inglis KJ, Speleman F, Sturm RA. Proneural and proneuroendocrine transcription factor expression in cutaneous mechanoreceptor (Merkel) cells and Merkel cell carcinoma. Int J Cancer. 2002;101:103–110. doi: 10.1002/ijc.10554. [DOI] [PubMed] [Google Scholar]
- Li S, Mark S, Radde-Gallwitz K, Schlisner R, Chin MT, Chen P. Hey2 functions in parallel with Hes1 and Hes5 for mammalian auditory sensory organ development. BMC Dev Biol. 2008;8:20. doi: 10.1186/1471-213X-8-20. [DOI] [PMC free article] [PubMed] [Google Scholar]
- Lillevali K, Matilainen T, Karis A, Salminen M. Partially overlapping expression of Gata2 and Gata3 during inner ear development. Dev Dyn. 2005;231:775–781. doi: 10.1002/dvdy.20185. [DOI] [PubMed] [Google Scholar]
- Ma Q. Transcriptional regulation of neuronal phenotype in mammals. J Physiol. 2006;575:379–387. doi: 10.1113/jphysiol.2006.113449. [DOI] [PMC free article] [PubMed] [Google Scholar]
- Massari ME, Murre C. Helix-loop-helix proteins: regulators of transcription in eucaryotic organisms. Mol Cell Biol. 2000;20:429–440. doi: 10.1128/mcb.20.2.429-440.2000. [DOI] [PMC free article] [PubMed] [Google Scholar]
- Matei V, Pauley S, Kaing S, Rowitch D, Beisel KW, Morris K, Feng F, Jones K, Lee J, Fritzsch B. Smaller inner ear sensory epithelia in Neurog 1 null mice are related to earlier hair cell cycle exit. Dev Dyn. 2005;234:633–650. doi: 10.1002/dvdy.20551. [DOI] [PMC free article] [PubMed] [Google Scholar]
- Nolan LS, Jagutpal SS, Cadge BA, Woo P, Dawson SJ. Identification and functional analysis of common sequence variants in the DFNA15 gene, Brn-3c. Gene. 2007;400:89–97. doi: 10.1016/j.gene.2007.05.023. [DOI] [PubMed] [Google Scholar]
- Rolland SG, Conradt B. New role of the BCL2 family of proteins in the regulation of mitochondrial dynamics. Curr Opin Cell Biol. 2010;22:852–858. doi: 10.1016/j.ceb.2010.07.014. [DOI] [PMC free article] [PubMed] [Google Scholar]
- Ryan AF. Transcription factors and the control of inner ear development. Semin Cell Dev Biol. 1997;8:249–256. doi: 10.1006/scdb.1997.0146. [DOI] [PubMed] [Google Scholar]
- Sage C, Huang M, Vollrath MA, Brown MC, Hinds PW, Corey DP, Vetter DE, Chen ZY. Essential role of retinoblastoma protein in mammalian hair cell development and hearing. Proc Natl Acad Sci U S A. 2006;103:7345–7350. doi: 10.1073/pnas.0510631103. [DOI] [PMC free article] [PubMed] [Google Scholar]
- Sakurada K, Kitanaka C, Kokubu A, Tomiyama A, Sunayama J, Kayama T, Kuchino Y. A cellular mechanism that reversibly inactivates pancaspase inhibitor zAsp-CH(2)-DCB: a potential pitfall causing discrepancy between in vitro and in vivo caspase assays. Biochem Biophys Res Commun. 2002;291:1022–1030. doi: 10.1006/bbrc.2002.6560. [DOI] [PubMed] [Google Scholar]
- Salzberg SL, Pertea M. Do-it-yourself genetic testing. Genome Biol. 2010;11:404. doi: 10.1186/gb-2010-11-10-404. [DOI] [PMC free article] [PubMed] [Google Scholar]
- Scheffer D, Sage C, Plazas PV, Huang M, Wedemeyer C, Zhang DS, Chen ZY, Elgoyhen AB, Corey DP, Pingault V. The alpha1 subunit of nicotinic acetylcholine receptors in the inner ear: transcriptional regulation by ATOH1 and co-expression with the gamma subunit in hair cells. J Neurochem. 2007;103:2651–2664. doi: 10.1111/j.1471-4159.2007.04980.x. [DOI] [PubMed] [Google Scholar]
- Slattery C, Ryan MP, McMorrow T. E2A proteins: regulators of cell phenotype in normal physiology and disease. Int J Biochem Cell Biol. 2008;40:1431–1436. doi: 10.1016/j.biocel.2007.05.014. [DOI] [PubMed] [Google Scholar]
- Smith MD, Ensor EA, Coffin RS, Boxer LM, Latchman DS. Bcl-2 transcription from the proximal P2 promoter is activated in neuronal cells by the Brn-3a POU family transcription factor. J Biol Chem. 1998;273:16715–16722. doi: 10.1074/jbc.273.27.16715. [DOI] [PubMed] [Google Scholar]
- Takeda S, Toyoda Y. Expression of SV40-lacZ gene in mouse preimplantation embryos after pronuclear microinjection. Mol Reprod Dev. 1991;30:90–94. doi: 10.1002/mrd.1080300203. [DOI] [PubMed] [Google Scholar]
- Tomicic MT, Kaina B. Hamster Bcl-2 protein is cleaved in vitro and in cells by caspase-9 and caspase-3. Biochem Biophys Res Commun. 2001;281:404–408. doi: 10.1006/bbrc.2001.4367. [DOI] [PubMed] [Google Scholar]
- Wang J, Ladrech S, Pujol R, Brabet P, Van De Water TR, Puel JL. Caspase inhibitors, but not c-Jun NH2-terminal kinase inhibitor treatment, prevent cisplatin-induced hearing loss. Cancer Res. 2004;64:9217–9224. doi: 10.1158/0008-5472.CAN-04-1581. [DOI] [PubMed] [Google Scholar]
- Wijchers PJ, Burbach JP, Smidt MP. In control of biology: of mice, men and Foxes. Biochem J. 2006;397:233–246. doi: 10.1042/BJ20060387. [DOI] [PMC free article] [PubMed] [Google Scholar]
- Woods C, Montcouquiol M, Kelley MW. Math1 regulates development of the sensory epithelium in the mammalian cochlea. Nat Neurosci. 2004;7:1310–1318. doi: 10.1038/nn1349. [DOI] [PubMed] [Google Scholar]
- Xiang M, Gan L, Li D, Chen ZY, Zhou L, O’Malley BW, Jr, Klein W, Nathans J. Essential rol1e of POU-domain factor Brn-3c in auditory and vestibular hair cell development. Proc Natl Acad Sci U S A. 1997;94:9445–9450. doi: 10.1073/pnas.94.17.9445. [DOI] [PMC free article] [PubMed] [Google Scholar]
- Xiang M, Gao WQ, Hasson T, Shin JJ. Requirement for Brn-3c in maturation and survival, but not in fate determination of inner ear hair cells. Development. 1998;125:3935–3946. doi: 10.1242/dev.125.20.3935. [DOI] [PubMed] [Google Scholar]
- Zheng J, Shen W, He DZ, Long KB, Madison LD, Dallos P. Prestin is the motor protein of cochlear outer hair cells. Nature. 2000a;405:149–155. doi: 10.1038/35012009. [DOI] [PubMed] [Google Scholar]
- Zheng JL, Shou J, Guillemot F, Kageyama R, Gao WQ. Hes1 is a negative regulator of inner ear hair cell differentiation. Development. 2000b;127:4551–4560. doi: 10.1242/dev.127.21.4551. [DOI] [PubMed] [Google Scholar]
- Zhuang S, Lynch MC, Kochevar IE. Caspase-8 mediates caspase-3 activation and cytochrome c release during singlet oxygen-induced apoptosis of HL-60 cells. Exp Cell Res. 1999;250:203–212. doi: 10.1006/excr.1999.4501. [DOI] [PubMed] [Google Scholar]
- Zine A, Aubert A, Qiu J, Therianos S, Guillemot F, Kageyama R, de Ribaupierre F. Hes1 and Hes5 activities are required for the normal development of the hair cells in the mammalian inner ear. J Neurosci. 2001;21:4712–4720. doi: 10.1523/JNEUROSCI.21-13-04712.2001. [DOI] [PMC free article] [PubMed] [Google Scholar]